© Mathieu Béland, 2020
Analyse de rentabilité de la récolte de biomasse
dégradée par les insectes pour la bioénergie
Mémoire
Mathieu Béland
Maîtrise en sciences forestières - avec mémoire
Maître ès sciences (M. Sc.)
Analyse de rentabilité de la récolte de biomasse
dégradée par les insectes pour la bioénergie
Mémoire
Mathieu Béland
Sous la direction de :
Evelyne Thiffault, directrice de recherche Warren Mabee, codirecteur de recherche
iii
Résumé
Les perturbations naturelles font partie intégrante de l’aménagement des forêts boréales canadiennes. Des débouchés doivent être trouvés pour les quantités importantes de bois provenant d’arbres dégradés ou morts. Une option prometteuse est la bioénergie. Cependant, il est essentiel de regarder la rentabilité de cette filière. Une approche par étude de cas a été réalisée pour évaluer la rentabilité d’une usine de bioénergie qui utilise de la biomasse dégradée, dans la province de Québec (Canada), en s’approvisionnant sur les mêmes territoires que les usines de sciage et de pâte. Les opérations forestières de récolte et transport ont été simulées. La rentabilité d’un scénario témoin, pour lequel seulement la récolte de bois marchand destiné au sciage et à la pâte et qui laisse les arbres trop dégradés intacts, a été comparée à la rentabilité d’un scénario transformant les arbres dégradés en bioénergie, tout en transformant les arbres sains en sciage et pâte. Aussi, l’effet de la répartition des coûts fixes sur un plus grand volume de bois a été évalué. Les bénéfices de la récolte de biomasse pour la bioénergie, en termes de réduction de l’intensité des travaux de préparation de terrain, a aussi été évaluée. Les résultats montrent qu’au prix actuel du marché, dominé par les granules de bois, la récolte de bois morts ou dégradés pour faire de la bioénergie n’est pas aussi rentable que de laisser les arbres debout, non coupés. Le scénario de bioénergie reste rentable lorsque le niveau de dégradation moyen est modéré. Aussi, la répartition des coûts fixes sur un plus grand volume de bois a permis de réaliser des économies de 2.83$C/m3 en moyenne. Finalement, la récolte de biomasse pour la bioénergie a permis de réaliser des économies allant de 0 à 500$/ha, en évitant des coûts de préparation de terrain.
iv
Table des matières
Résumé ... iii
Table des matières ... iv
Liste des figures ... vi
Liste des tableaux ... vii
Remerciements ... viii
Avant-propos ... ix
Introduction générale... 1
Bioénergie ... 1
Différentes matières premières de biomasse forestière ... 2
Produits de bioénergie ... 4
La bioénergie, une énergie renouvelable au potentiel limité ... 4
L’économie de l’exploitation de la biomasse pour la bioénergie ... 5
Répartition des coûts fixes ... 5
La récolte de bioénergie comme un traitement sylvicole ... 5
Buts et objectifs ... 6
Hypothèses ... 6
Chapitre1 Insect degraded trees as bioenergy feedstock: a profitability analysis ... 8
Résumé ... 8 Abstract ... 8 Introduction ... 9 Method ... 12 Study area ... 12 Feedstock costs ... 15 Harvesters’ productivity ... 16
v
Stumpage costs ... 17
Transport costs ... 17
Fixed costs ... 17
Processing costs and revenues... 18
Wood volume distribution among products ... 18
Costs and revenues ... 19
Silvicultural savings ... 22
Results ... 23
Harvesters’ productivity ... 23
Fixed Costs ... 25
Silvicultural savings ... 25
Tree degradation level ... 26
Bioenergy selling price... 27
Discussion ... 29
Conclusion ... 33
Acknowledgement ... 34
Conclusion générale ... 35
Résultats saillants et retour sur les hypothèses... 35
Limites méthodologiques ... 36
Implications et recherche future ... 38
vi
Liste des figures
FIGURE 1 STUDY LOCATION, IN THE CÔTE-NORD REGION (QUÉBEC, CANADA) 13 FIGURE 2 RELATIONSHIP BETWEEN THE STAND MEAN VOLUME PER STEM AND THE MEAN HUNTER CLASS
OF A STAND 24
FIGURE 3 VOLUME DISTRIBUTION OF WOOD PRODUCTS ACCORDING TO STAND MODIFIED HUNTER CLASS 25 FIGURE 4 STAND PROFITABILITY AS A FUNCTION OF DEGRADATION LEVEL AT DIFFERENT BIOENERGY
vii
Liste des tableaux
TABLE 1 CHARACTERISTICS OF THE STANDS 14
TABLE 2 DEFINITION OF MODIFIED HUNTER CLASSES 15
TABLE 3 STUMPAGE RATES BY QUALITY AND SPECIES FOR THE CÔTE-NORD REGION (MANAGEMENT UNIT
960) 17
TABLE 4 COST OF PRODUCTS TRANSFORMATION STEPS 20
TABLE 5 REVENUES OF THE DIFFERENT PRODUCTS 21
TABLE 6 RESULTS OF THE LINEAR MODEL GIVEN A BIOENERGY SELLING PRICE OF C$32.58/M3 26
STD.ERROR 26
TABLE 7 COMPARISON OF THE DIFFERENCE IN PROFITABILITY (C$) FOR A CHANGING DEGRADATION LEVEL
viii
Remerciements
Je tiens à remercier tout d’abord ma directrice, Evelyne, pour son immense support. Ta bonne humeur, ton attitude positive et tes compétences m’ont permis de mener à bien cet immense projet. Merci aussi pour l’opportunité de faire un séjour de recherche en Australie durant ma maîtrise, ce fut une expérience incroyable.
Je voudrais aussi remercier tous les nombreux collaborateurs à ce projet, pour votre aide à tous les niveaux, notamment Denis Villeneuve, pour la journée terrain qui m’a donné une meilleure compréhension des enjeux liés à ma maîtrise. Aussi, Denis Cormier et l’équipe de FPInnovations pour la licence du logiciel FPInterface et pour le support lorsque j’en ai eu besoin. De même, merci à Guillaume Robert du Ministère des forêts, de la faune, et des parcs pour l’accès à différentes données.
Je veux aussi remercier tous les organismes qui ont contribués financièrement à ce projet, notamment Biofuelnet. Merci aussi pour l’occasion de participer à deux reprises au symposium sur les biocarburants, ce fut à deux reprises des expériences très enrichissantes, tant au plan personnel que professionnel. Merci au CRMR pour les différentes contributions sous forme de bourses. Je voudrais aussi dire un mot de gratitude à mes anciens partenaires de bureau et collègues de maîtrise, pour tous ces merveilleux cafés prêts le matin en arrivant ou encore pour ces petites bières d’après-midi au fou lorsque tout allait mal. Ainsi, merci Pierre-Yves, Guillaume, Sébastien, Maxime et tous les autres du ABP.
Finalement, un immense merci à mes amis et à ma famille pour le précieux support durant ces années. Merci de m’avoir encouragé à faire ce que je voulais vraiment faire.
ix
Avant-propos
Ce mémoire est présenté sous la forme d’article rédigé en anglais, avec une introduction et une conclusion en français. L’objectif est de soumettre l’article pour publication d’ici l’été 2020. Ayant réalisé les analyses, l’interprétation des résultats et la rédaction, je serai l’auteur principal. Les coauteurs sont : Evelyne Thiffault, professeur agrégée à l’Université Laval, à la faculté de foresterie, géographie et géomatique, membre du département des sciences du bois et de la forêt et Warren Mabee, de Queen’s University, professeur et chef de département du Department of Geography and Planning. Evelyne m’a aidé tout au long de mes travaux, de la récolte des données à la relecture, en passant par toutes les autres étapes; elle est donc la deuxième auteure. Finalement, Warren a révisé et commenté l’article, il sera donc troisième auteur de l’article inséré.
1
Introduction générale
Les changements climatiques sont une préoccupation internationale. Selon le groupe d’experts intergouvernemental sur l’évolution du climat (GIEC) (2014a), : « Le réchauffement du
système climatique est sans équivoque et, depuis les années 1950, beaucoup de changements observés sont sans précédent depuis des décennies voire des millénaires. L’atmosphère et l’océan se sont réchauffés, la couverture de neige et de glace a diminué, et le niveau des mers s’est élevé. »
Ainsi, les répercussions de ces changements sont visibles notamment par une augmentation de la température des océans, une augmentation localisée des précipitations, la fonte des glaciers et de la banquise arctique, une augmentation du niveau des mers et une augmentation de l’incidence des phénomènes météorologiques extrêmes (GIEC, 2014b).
La première raison de ces changements serait l’augmentation de gaz à effet de serre (GES) dans l’atmosphère. Le GES d’origine humaine ayant l’empreinte écologique la plus importante serait, en raison des quantités émises à l’atmosphère, le dioxyde de carbone (CO2) (Crombie et Mašek, 2014). Les deux principales raisons de son augmentation dans l’atmosphère seraient l’utilisation de combustibles fossiles et la déforestation, notamment à cause de la conversion de forêts en terres agricoles (GIEC, 2011). Entre 1970 et 2010, 78% de l’accroissement du total mondial des émissions de GES seraient dû à l’usage de combustibles fossiles et aux procédés industriels (GIEC, 2014a). Pour diminuer les émissions anthropiques, il faut donc diminuer la consommation énergétique par personne et trouver des énergies alternatives pour les besoins énergétiques restants.
Les énergies renouvelables représentent une alternative de choix. En plus d’émettre moins de CO2 que les énergies fossiles, elles peuvent offrir d’autres avantages. Ainsi, par rapport aux sources d’énergie fossile, elles peuvent contribuer au développement social et économique, de même qu’assurer une sécurité énergétique, tout en offrant un potentiel de réduction des impacts sur la santé (GIEC, 2011).
Bioénergie
La bioénergie est une énergie renouvelable possédant un grand potentiel pour diminuer les émissions de GES. En effet, les technologies sur lesquelles elle repose sont disponibles actuellement et possèdent un grand potentiel de déploiement à court terme (GIEC, 2011). De plus,
2
en étant une des seules énergies pouvant produire de l’énergie sous forme solide, liquide ou gazeuse, la bioénergie est versatile et facilement utilisable maintenant et est donc une étape importante d’une transition énergétique vers d’autres formes d’énergies (Nigam & Singh, 2011).
Il existe plusieurs matières premières pour la bioénergie, notamment la biomasse agricole, la biomasse forestière, les déchets organiques municipaux ainsi que les déchets de transformation alimentaire (noyaux d’olive, péricarpes de noix de coco, etc.). Les deux plus importantes sources sont la matière agricole et la matière forestière, qui représentent respectivement 10% et 13% de l’énergie produite à partir de biomasse1 (GIEC, 2011). La biomasse agricole peut être produite soit à partir de glucides ou d’huiles végétales ou encore à partir de résidus cellulosiques. Les deux premières sources sont controversées, à cause de la compétition à l’industrie alimentaire qu’elles créent (Srinivasan, 2009). La biomasse agricole cellulosique, elle, pourrait être intéressante à exploiter, à condition de bien cerner les limites d’une utilisation durable (Eisentraut, 2010).
La biomasse forestière, pour sa part, est intéressante tout particulièrement si elle est utilisée de façon moderne. En effet, les produits tels que les granules de bois et les biocarburants peuvent répondre à des besoins tout en permettant l’atteinte d’une grande efficacité énergétique, comparativement à simplement brûler du bois dans un foyer ouvert (GIEC, 2011).
Différentes matières premières de biomasse forestière
Pour commencer, il est important de considérer qu’il y a déjà un usage de biomasse par les industries forestières conventionnelles. Ainsi, le bois de bonne qualité va généralement aux industries de déroulage et de sciage, car ces industries sont capables de payer cher pour ces bois de bonne qualité. Par la suite, le bois de moindre qualité ainsi que les résidus d’usines de sciage vont aux usines de pâtes et papiers et de panneaux. Dans ce contexte industriel existant, il est intéressant de se demander quelle place une industrie de bioénergie pourrait avoir.
Inspiré des travaux de Faaij et al. (2011), il existe trois types de matières premières de biomasse forestière pour la bioénergie. Le premier type est les résidus primaires provenant des activités de récolte et d’aménagement forestier, les résidus secondaires provenant des usines de transformation du bois et les résidus tertiaires, c’est-à-dire les résidus post-consommation.
1 Le 13% de l’énergie produite à partir de matière première forestière ne représente que le
pourcentage d’énergie de biomasse forestière destinée à un usage moderne à haute efficacité énergétique. En rajoutant la biomasse à usage traditionnelle, la bioénergie forestière compte pour 87% de l’énergie produite mondialement à partir de biomasse (GIEC, 2011)
3
Généralement, les résidus secondaires sont déjà utilisés par les différents industriels d’une région. Cependant, plusieurs usines de pâtes et papiers canadiennes éprouvent des difficultés financières, ce qui amène le marché à se restructurer (Brandeis & Guo, 2016). Cette restructuration pourrait permettre l’implantation de bioraffineries intégrées (Marinova et al., 2010; MRNF, 2012).
Le deuxième type de matières premières est le bois mort ou moribond provenant de perturbations naturelles (e.g. les feux de forêt ou les épidémies d’insectes). Même si cette catégorie ne peut représenter un approvisionnement durable, notamment à cause de l’impossibilité de prévoir quand et où auront lieu les perturbations naturelles, la bioénergie demeure tout de même une opportunité intéressante pour ces sources de bois périodiques, comme cela a été le cas dans l’Ouest canadien avec le dendroctone du pin (Dendroctonus ponderosae Hopkins) (Lamers et al., 2014). Au Québec, le bois affecté par la tordeuse de bourgeons de l’épinette (Choristoneura fumiferana Clemens) ainsi que des bois affectés par les feux de forêts sont caractéristiques de cette catégorie (Barrette et al., 2015).
La troisième catégorie de biomasse pour la bioénergie est du bois debout qui n’est pas utilisé par les industriels conventionnels (bois sans preneur) e.g. les feuillus de mauvaise qualité, qui représentent, au Québec, une grande quantité de bois à cause de l’aménagement forestier passé (Bedard & Majcen, 2003; Durocher et al., 2018).
À la fois pour les bois affectés par les perturbations naturelles et les bois sans preneur, en laissant ces peuplements sans aménagement, ils continueront à garder une valeur future faible, tandis qu’en les aménageant, leur valeur future pourrait augmenter (Skog et Barbour, 2006). Si l’ajout de la bioénergie dans le panier de produits d’une région permet d’augmenter la valeur de superficies forestières présentement stagnantes ou dégradées par des perturbations naturelles, tout en récoltant de façon rentable du bois, alors l’économie locale se trouverait améliorée.
Pour ce mémoire, la biomasse étudiée fait partie de la deuxième catégorie, soit celle affectée par des perturbations naturelles. Dans la présente étude, la biomasse est affectée par une épidémie d’insectes, la tordeuse de bourgeons de l’épinette. Il s’agit d’un insecte attaquant de façon récurrente les forêts boréales, les épidémies se succédant aux 30-35 ans (Jardon, Morin, & Dutilleul, 2003; Royama, 1984). Il s’attaque principalement au sapin baumier (Abies balsamifera (L.) Mill) et à l’épinette blanche (Picea glauca (Moench) Voss). L’épidémie la plus récente a commencé en 2006; elle a déjà touché plus de 7 millions d’hectares en 2017 dans l’Est du Canada (MRNF, 2017) et les dommages devraient augmenter dans les prochaines années. Le principal
4
problème de telles épidémies est que le secteur industriel du sciage et des pâtes et papiers n’est pas capable de transformer les centaines de milliers de mètres cubes affectés dans un délai raisonnable (Barrette et al., 2015; Vézina, 1985). Les peuplements affectés laissés sur pied voient leur qualité se dégrader rapidement, et deviennent difficilement rentables. Une industrie de bioénergie forte pourrait faire partie de la solution comme preneur de biomasse versatile d’une région, s’approvisionnant en bois affectés par les insectes lors d’épidémies et de bois de faible qualité i.e. biomasse de troisième catégorie lors de périodes non-épidémiques.
Produits de bioénergie
Avec le bois, il est possible de créer plusieurs produits pour la bioénergie, chacun ayant ses caractéristiques propres. Ainsi, les copeaux représentent un produit de bioénergie à faible valeur ajoutée, dont le procédé de fabrication est maîtrisé à l’heure actuelle. Les granules de bois sont aussi relativement faciles à fabriquer, tout en demandant des installations plus complexes pour les produire. Les copeaux et les granules servent à produire de la chaleur et de l’électricité, pour un usage industriel ou résidentiel. Ils peuvent remplacer totalement ou en partie des combustibles tels le mazout, le charbon, etc. Quant à lui, le biodiesel produit par la pyrolyse est un procédé à très haute valeur ajoutée, dont le procédé de fabrication en est à l’étape de l’usine de commercialisation (Ensyn, 2017).
La bioénergie, une énergie renouvelable au potentiel limité
La bioénergie est une énergie qui, même si elle est considérée renouvelable, est limitée. En effet, la quantité maximale mondiale de biomasse disponible pour la production d’énergie, d’ici 2050, ne dépasserait pas de 15 à 25 % des besoins en énergie mondiaux (Beringer et al., 2011; Lauri et al., 2014). Ainsi, la bioénergie doit s’inscrire dans un plan énergétique plus large incluant d’autres énergies renouvelables.
De plus, dans le contexte de forêt boréale, où les arbres ont une croissance annuelle limitée par le climat, il est essentiel de se demander quelle est la meilleure option pour maximiser le potentiel de séquestration de carbone provenant de la forêt (Bellassen & Luyssaert, 2014). Pour les arbres de qualité, une utilisation en cascade, dans laquelle le bois est d’abord utilisé pour des produits solides, qui sont par la suite recyclés en d’autres produits lorsqu’ils sont en fin de vie, et finissent produits de la bioénergie, semble être optimale. Pour les bois dégradés, pour lesquels les autres possibilités d’utilisation sont limités par la configuration du réseau industriel forestier, la bioénergie peut s’avérer une option intéressante, particulièrement dans les peuplements peu productifs ou pour les peuplements qui sont en train de mourir (Bellassen & Luyssaert, 2014).
5
L’économie de l’exploitation de la biomasse pour la bioénergie
La bioénergie semble être difficile à rentabiliser lorsqu’elle nécessite la coupe d’arbres entiers. En effet, l’utilisation de résidus de sciage semble être une avenue plus rentable que la récolte d’arbres spécifiquement pour cet usage (Boukherroub et al., 2016; IEA, 2013; Kumaret al., 2003). Cependant, en période d’épidémie d’insectes, il pourrait en être autrement. De plus, il existe deux aspects souvent négligés qui pourraient permettre d’aller chercher une rentabilité plus élevée pour le bois destiné spécifiquement aux bioénergies. Il s’agit de la répartition des coûts fixes de la récolte sur un plus grand volume de bois et de l’utilisation de la récolte de bois destiné aux bioénergies comme un traitement sylvicole de préparation de terrain.
Répartition des coûts fixes
Un avantage potentiel de l’implantation d’une usine de bioénergie dans une région est la répartition des frais fixes sur un plus grand volume de bois. En effet, si la récolte de bois pour la bioénergie est rentable et que cette bioénergie permet de récolter davantage de biomasse, alors les coûts fixes seront répartis sur une plus grande quantité de bois. Les principaux coûts fixes, lors d’exploitations forestières, sont la construction de chemin et la construction de camps forestiers. Pour ce mémoire, l’approche choisie est de quantifier et d’estimer l’importance d’un tel phénomène. En effet, peu de littérature existe sur ce sujet et ce projet exploratoire a examiné l’importance d’un tel phénomène sur les coûts totaux de récolte.
La récolte de bioénergie comme un traitement sylvicole
En récoltant une quantité additionnelle de biomasse pour la bioénergie, il reste moins de branches et de troncs sur le parterre de coupe. Cela peut réduire les besoins en préparation de terrain et ainsi réduire les frais engendrés par cette opération (Gan & Smith, 2007). Les bénéfices devraient être plus grands en situation d’épidémie d’insectes. En effet, puisqu’une plus grande quantité de biomasse est laissée sur le parterre de coupe, en raison d’une mortalité anormalement élevée, retirer une partie de la biomasse pourrait permettre d’économiser la première étape de préparation de terrain, soit la mise en andain des résidus, ne laissant que le scarifiage à effectuer. Ainsi, pour réaliser des calculs de la rentabilité de la bioénergie qui sont réalistes, il est important d’inclure comme revenus de la bioénergie les crédits sylvicoles représentant les coûts sauvés par l’extraction additionnelle de biomasse pour la bioénergie. Une partie de ce mémoire est dédiée au calcul de tels crédits sylvicoles et à l’évaluation de l’importance de ces crédits sur la rentabilité d’un projet.
6
Buts et objectifs
Buts
1. Comprendre les facteurs affectant la rentabilité des opérations forestières visant la récolte de biomasse pour la bioénergie dans des peuplements affectés par la tordeuse de bourgeons de l’épinette.
Objectifs spécifiques en lien avec ce but
• Déterminer les conditions permettant d’exploiter de façon rentable des chantiers de coupe présentant une haute proportion de bois dégradés.
2. Comprendre le rôle et l’importance de la distribution des coûts fixes sur un plus grand volume de bois sur la rentabilité des opérations de récolte de biomasse pour la bioénergie.
Objectifs spécifiques en lien avec ce but
• Calculer comment la répartition des coûts fixes sur un plus grand volume affecte la rentabilité d’une étude de cas;
• Estimer l’importance de l’impact de la répartition des coûts fixes sur la rentabilité d’une étude de cas.
3. Estimer l’importance relative de la récolte de biomasse sur les coûts de préparation de terrain.
Objectifs spécifiques en lien avec ce but
• Estimer l’impact économique de l’utilisation de la récolte de bioénergie comme traitement sylvicole de préparation de terrain;
• Estimer l’importance de cet impact sur la rentabilité d’une étude de cas.
Hypothèses
1- L’exploitation de bois dégradé pour la bioénergie pourrait être rentable dans des peuplements dégradés si les coûts fixes sont minimisés et les crédits sylvicoles sont maximisés.
7
2- La répartition des coûts fixes sur un plus grand volume de bois aura une influence assez faible sur le coût total de la bioénergie. En effet, les coûts fixes en exploitation forestière ne représentent qu’une faible partie des coûts. Cependant, il devrait tout de même y avoir une certaine différence par m3 de bois exploité, ce qui avantage tout le réseau industriel forestier au complet.
3- Le crédit sylvicole associé à la récolte de biomasse pour la bioénergie aura une grande influence sur le coût de revient de la bioénergie. En effet, en période d’épidémie d’insecte, la grande quantité de bois laissé au sol augmente substantiellement les coûts de préparation de terrain. En récoltant davantage de bois, les coûts de préparation de terrain diminueront et, en appliquant ce crédit sylvicole à la récolte de biomasse pour la bioénergie, la bioénergie sera grandement favorisée.
8
Chapitre1 Insect degraded trees as bioenergy
feedstock: a profitability analysis
Résumé
L’utilisation d’arbres dégradés pour la production de bioénergie est intéressante, si elle s’avère rentable. Une approche par étude de cas a été réalisée pour évaluer la rentabilité d’une usine de bioénergie qui utilise de la biomasse dégradée, dans la province de Québec, au Canada. Les opérations forestières de récolte et transport ont été simulées pour 2 scénarios, un témoin et un récoltant les arbres dégradés pour la bioénergie. L’effet de la répartition des coûts fixes sur un plus grand volume de bois a aussi été évalué, de même que la réduction du coût de préparation de terrain grâce à la bioénergie. Au prix actuel de la bioénergie, la récolte de bois morts ou dégradés n’est pas autant rentable que de laisser les arbres debout. La répartition des coûts fixes sur un plus grand volume de bois a permis de réaliser des économies de 2.83$C/m3 en moyenne. Les crédits sylvicoles associés à la récolte de biomasse forestière pour la bioénergie sont en moyenne de 2.31$C/m3.
Abstract
In Canadian boreal forests, natural disturbances have always been an important consideration in forest management. During and after insect epidemics, forest professionals must deal with a massive amount of degraded or dead wood. One option to use this wood is the creation of wood pellet plants to derive value from these materials. Before making this type of investment, however, profitability of these operations must be assessed. A case study approach was used to consider the profitability of pellet plants using degraded feedstock, in the province of Québec, in eastern Canada. Forest operations were simulated, using FPInterface software. A control scenario was created which left degraded trees on the cutover, while a bioenergy scenario explored harvesting these degraded trees for bioenergy purposes. One important aspect of the study is to examine how the additional harvest of degraded wood would impact the fixed costs associated with harvesting operations. The silviculture costs saved by the procuring of biomass for bioenergy are also assessed. Results show that at current market prices, harvesting degraded trees for pellet production is not as profitable as leaving them uncut in the forest, even though the forest operations are still profitable until very high degradation level. Introducing harvesting for bioenergy options can reduce fixed costs and allow savings of C$2.83 per m3, averaged among all the stands studied. The silvicultural savings range from C$0/ha to as high as C$500/ha; averaged over the study area,
9
C$2.31/m3 are saved in silviculture costs with the introduction of bioenergy harvests. Depending on the stand conditions, the fixed costs distribution and silvicultural savings of harvesting biomass for bioenergy could be either low or important; therefore, more studies should be done to understand more precisely where they could shift an unprofitable scenario to a profitable one.
Introduction
Bioenergy (energy from biomass) has a high potential for reducing greenhouse gas (GHG) emissions and can contribute to the transition of energy systems towards renewable and climate-friendly sources, particularly when the most modern technologies are employed. Investment in a plant for the production of bioenergy is usually contingent upon access to feedstocks produced in a sustainable fashion; this access generally needs to be guaranteed over long periods of time (e.g. 20 years) at relatively low cost. In Canada, boreal forests have been recognized as a stable and long term biomass supply, which could be used for bioenergy (Dymond et al, .2010; Paré et al., 2011). However, the cost of the feedstock remains a key barrier for the large-scale deployment of bioenergy.
There are three potential ‘streams’ of forest biomass that are available from Canadian forests. The first (likely most accessible) option is processing residues from wood products- for example, chips and sawdust generated during the processing of lumber. The availability of wood processing residues is often low, especially in eastern Canada, since they are already widely used as feedstock for pulp and fiberboard manufacturing or for pellet production (Ghafghazi et al., 2017). A second option are post-harvest residues– for example, tree tops and branches – which may be left on the forest floor, or piled at roadside landings. These materials are widely distributed and tend to be bulky; sometimes they are burnt to prevent a build-up of fuel, which could lead to catastrophic wildfires. A third option for bioenergy production is surplus forest growth. This can include unused biomass of desirable species that is part of the annual allowable cut but not harvested due to lack of demand; this category could also include non-merchantable woods that have no conventional application (Durocher, et al, 2018) as well as standing dead trees that would typically not be harvested for solid wood products (Faaij et al., 2011). Unused/non-commercial or dead trees are either left standing or are logged and left on site, with other post-harvest residues, to decay or to be burnt to reduce forest fire hazard.
In the eastern Canadian boreal forest context, natural disturbances, including wildfire and insect outbreaks such as spruce budworm (Choristoneura fumiferana (Clemens)), are common.
10
They affect areas that can be larger than typical harvest blocks (Dymond et al., 2010). Standing degraded or dead wood that result from these disturbances can represent a large part of the available biomass for bioenergy, with Dymond et al. (2010) and Mansuy et al. (2015) calculating that standing degraded or dead wood potential was twice as large as available biomass from post-harvest residues.
Among natural disturbances in eastern Canada, spruce budworm, which has cyclical outbreaks every 30-40 years, causes significant damages (Jardon et al., 2003; Royama, 1984). This defoliator primarily affects balsam fir (Abies balsamifera (L.) Mill) and white spruce (Picea glauca (Moench) Voss). The current outbreak of this insect, which started in 2006, has already affected more than 7 million hectares as of 2016 (MRNF, 2016), and the damages are expected to keep increasing. During the last epidemic, which ended around 1985, a total of 50 million hectares (ha) were affected by the outbreak (Vézina, 1985), with between 140 000 and 240 000 cubic meters (m3) of roundwood killed by the insect. Conventional forest products (mainly lumber and pulp) are not typically sourced from damaged fibre; sawmills select straight, non-degraded stems whereas the pulp industry, while more tolerant of lower-quality inputs, cannot manage large amounts of wood rot, typical of trees affected or killed by insects. Thus, the existing conventional industry is not able to use these trees, resulting in high quantities of fibre that is simply left in the forest.
Bioenergy has different - and somewhat less stringent - requirements than those for sawntimber or pulp and paper. Most bioenergy systems can tolerate biomass with degraded physical properties and the presence of rot. According to Barrette et al. (2015), the most suitable time to harvest wood affected by natural disturbances is 1-2 years after the disturbance for lumber production, and 3-4 years for pulp and paper production; by comparison the “shelf-life” for bioenergy feedstocks could be much longer, depending on the bioenergy product desired. The bioenergy industry therefore has the potential to become a large processing sector for dead or degraded trees to create a whole new range of innovative energy products, from heat and electricity through wood pellets and even to liquid biofuels such as bioethanol and biodiesel.
There is a strong imperative to find more cost-effective sources of biomass for bioenergy options. It has been shown that forest operations dedicated at harvesting roundwood for bioenergy are rarely profitable. Indeed, Barrette et al. (2017) showed that at current market conditions, bioenergy is not as profitable as pulp and paper. Stephen et al. (2014) reported similar findings and also illustrated that using residues from a sawmill was much more profitable than harvesting wood specifically for bioenergy.
11
There are a few trends which may change the profitability of bioenergy options. Bioenergy prices are expected to rise as environmental policies designed to tackle the climate change problem come into effect. Bioenergy production costs are expected to go down as the technologies for converting biomass into various bioenergy carriers continually improve (Faaij et al., 2011). Some biofuels, and in particularly biochemical co-products of bioenergy production, can sell at high prices, which can dramatically influence the economic feasibility of specific projects (Brown et al., 2011). Finally, as worldwide fossil fuel resources deplete, the prices of fossil-derived energies will go up. Thus, bioenergy could become competitive enough to be as profitable as fossil fuels, even when considering the relatively high cost of forest biomass procurement.
Another economic improvement for the bioenergy sector would be the recognition that procuring additional forest biomass for the purpose of bioenergy production could be seen as a silvicultural treatment (Egnell et al., 2016). Indeed, harvesting additional biomass for bioenergy from a given harvest area leads to a smaller number of trunks and branches remaining on the cutover, which can improve microsite quality for the regeneration of the forest (Trottier-Picard et al., 2014; 2016) and reduce the cost of site preparation treatments (Gan & Smith, 2007; Manley & Richardson, 1995). Thus, a silvicultural credit could be incorporated into calculations of bioenergy project profitability, because the costs of site preparation have been reduced. This is especially true in the context of stands affected by natural disturbances in boreal forests of eastern Canada, where the quantity of remaining (mostly dead) trees on the cutover is high, eventually creating important volumes of coarse debris on the ground, which hinder regeneration of the forest (Barrette et al., 2013).
The costs of harvesting insect degraded trees have been examined (Gaudreau, 2016). Degraded trees have a higher harvesting cost than healthy trees, mainly because they break easily and they require additional stem analysis for the operator. The profitability of overall forest operations is also essential to consider, since a wide range of wood products (including conventional products such as sawntimber and pulp, as well as emerging products like bioenergy) would typically be sourced from the same stand. In an undisturbed boreal forest stand, for example, the range of tree species and variability of tree sizes lends itself well to support this range of products; in a boreal stand impacted by spruce budworm, the amount of defoliation and degradation influences the ability to deliver conventional products, thus impacting the overall costs and revenues.
Creating a new outlet for severely degraded trees that are unsuitable for sawntimber and pulp (and would thus otherwise be left on site) would increase the harvested volume from a given stand.
12
By harvesting more wood, the fixed costs of harvesting operations, such as road and forest camp construction, would be effectively distributed over a larger volume of wood, which in turn would influence the costs and profitability of the whole supply chain and its full range of wood products. Analysing the profitability of bioenergy as an integral part of the range of wood products will likely reflect more closely the nature of the forest supply chain of eastern Canada, which is characterized by a tight integration among products.
The general aim of this study was to understand the factors affecting the profitability of bioenergy from roundwood as part of a range of wood products sourced from stands affected by spruce budworm. The specific objectives were to:
1- Assess the conditions for profitability of forest operations aimed at harvesting
roundwood for bioenergy, along with sawntimber and pulp, in stands with various levels of defoliation/degradation from the spruce budworm epidemic;
2- Estimate how the distribution of the fixed costs of harvesting over a larger volume, caused by procurement of additional wood for bioenergy, contributes to the profitability of the whole supply chain;
3- Estimate how different bioenergy products and bioenergy selling prices can affect the profitability;
4- Estimate how silvicultural credits associated with procurement of additional wood for bioenergy can affect the profitability.
Method
Study area
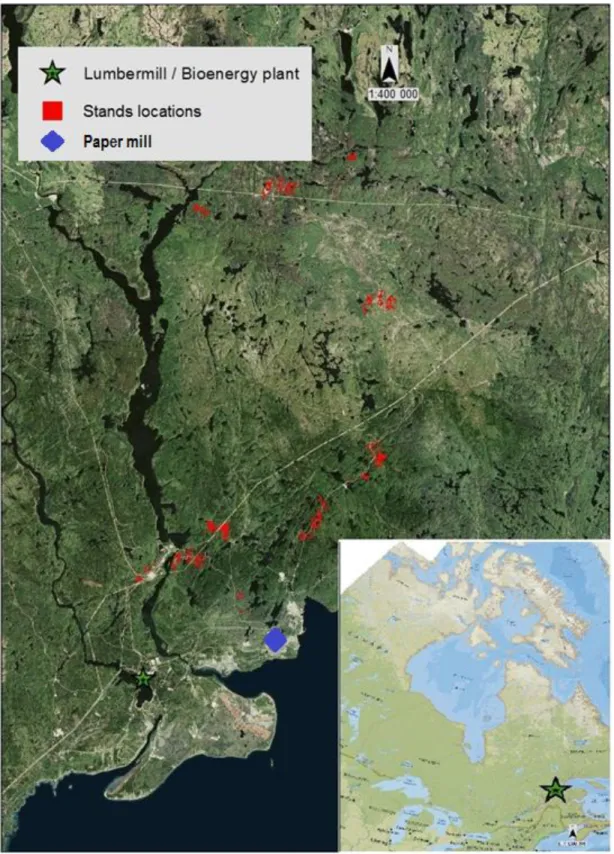
The study area is located in the Côte-Nord region of the province of Quebec, near the city of Baie-Comeau (northeastern Quebec, Canada) (Figure 1). This region is part of the eastern balsam fir-white birch bioclimatic domain (MERN, 2017), within the boreal forest biome. The dominant forest management systems in the region are designed to produce two main product streams, lumber and pulp and paper.
13
14
In this study, the lumbermill and pellet producing plant are collocated. The paper mill is located 21 km from the lumbermill and pellet producing plant.
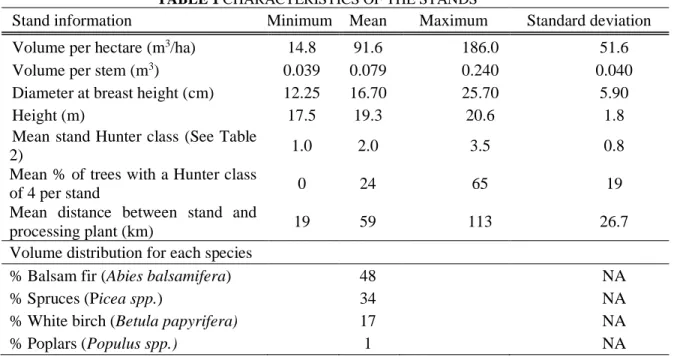
A database containing forest inventory information for 96 stands located across the Côte-Nord region and representing a gradient of stand defoliation and degradation caused by spruce budworm was used. These stands are located in the management unit 960, in which there is an operational sawmill. Thus, the distance between the sawmill and the stands will be a crucial factor to calculate the profitability. For each stand, information such as species, diameter at breast height, degradation level (expressed as modified Hunter classes, see Table 2 for description of classes) and distance to the sawmill were assembled. Table 1 summarizes the mean characteristics of the 96 stands.
TABLE 1 CHARACTERISTICS OF THE STANDS
Stand information Minimum Mean Maximum Standard deviation
Volume per hectare (m3/ha) 14.8 91.6 186.0 51.6
Volume per stem (m3) 0.039 0.079 0.240 0.040
Diameter at breast height (cm) 12.25 16.70 25.70 5.90
Height (m) 17.5 19.3 20.6 1.8
Mean stand Hunter class (See Table
2) 1.0 2.0 3.5 0.8
Mean % of trees with a Hunter class
of 4 per stand 0 24 65 19
Mean distance between stand and
processing plant (km) 19 59 113 26.7
Volume distribution for each species
% Balsam fir (Abies balsamifera) 48 NA
% Spruces (Picea spp.) 34 NA
% White birch (Betula papyrifera) 17 NA
% Poplars (Populus spp.) 1 NA
The volume per ha for the 96 stands summarized in Table 1 was relatively low when compared to healthy stands across the region (typically around 115 m3/ha). The stands were selected based on their degradation level and not on their maturity or volume; some of the stands were not yet fully mature, but they are included in this analysis. A spruce stand is considered mature around 50-70 years old, depending on the site fertility. Also, the size of the stands did not matter in this study. Indeed, even though the size of a stands has major implications in operational conditions, it did not matter in our study. Indeed, since the results are expressed in C$/m3 or per hectare, the size of the stands had no real influence on the results.
15
The level of tree degradation within a stand directly influences the profitability of harvesting operations. To quantify this variable, the degradation classes found in Barrette et al. (2017) and Gaudreau (2016) were used, as shown in Table 2. The degradation classes shown in Table 2 are modifications of classes proposed by Hunter (1990).
TABLE 2 DEFINITION OF MODIFIED HUNTER CLASSES
Hunter class used Definition
1 Live tree
2 Live tree but declining
3 Dead tree without peeling bark
4 Dead tree with peeling bark
To examine the economics of harvesting forest biomass for bioenergy production in those stands, forest supply chains were simulated, in which harvesting costs, transformation costs and revenues were calculated for each of the 96 stands. In these simulations, two scenarios were tested. The first was a control or ‘business-as-usual’ scenario in which trees are harvested for conventional products only, without roundwood procurement for bioenergy product. In this scenario, trees with a modified Hunter class of 4 are considered uneconomical for processing by sawmills and pulpmills, based on the results of Barrette et al. (2012). These trees are left unharvested within the control scenario. In the bioenergy scenario, trees with a modified Hunter class of 4 are harvested for bioenergy purposes in addition to the trees taken for conventional products.
For each of the two scenarios, all harvested roundwood was first directed to a sawmill based in Baie-Comeau, Québec. This sawmill was assumed to be the first point of entry within the forest industrial ecosystem, with sawmilling co-products and lower-quality roundwood then being sold to a nearby pulpmill; trees with a modified Hunter class of 4 were diverted to bioenergy depending on the scenario. In this study, it was assumed that the bioenergy production plant would be integrated within the sawmill, as suggested in Boukherroub et al. (2015), which eliminates the costs and logistical challenges associated with additional transport.
Feedstock costs
Simulations were conducted using the FPInterface software (FPInnovations, n.a.). This software simulates harvesting operations, and tracks the costs incurred on the cutting block as well as the costs of delivering wood to the gate at different processing plants. The software uses default values for each step in harvesting and transporting processes, based on multiple profitability studies
16
linked to individual stand characteristics. User-defined values can also be entered manually when required; in this study user-defined values were entered to allow the simulation of stands affected by spruce budworm epidemic.
Harvesters’ productivity
For both scenarios, the selected machine for the cutting operations was a harvester. The presence of degraded trees in a stand has an impact on the harvesting costs of trees. Indeed, even in the control scenario, in which the most degraded trees are left on the cutover, dead trees reduce the productivity of harvesters, expressed in harvested cubic meters (m3) per productive machine hour (PMH) (Gaudreau, 2016). There are two reasons for this. First, the operators must spend more time analysing which sections of each stem being cut may be adequate for processing into conventional products. Second, the degraded stems are more prone to breaking during the cut, reducing the recovered wood volume per tree and the productivity (Barrette et al., 2012). To take into account these constraints, the default values for harvesting costs were adjusted in the FPInterface software for both the control and bioenergy scenario. According to Gaudreau (2016) and DGR (2014), another important variable to describe the impact of degraded woods on harvesters productivity is the DBH. The productivity of a harvester increases as the DBH increases. For the purpose of this study, DBH was classified according to the three classes defined by Gaudreau (2016): small woods i.e. 9.00 cm up to 14.99 cm, medium woods i.e. 15.00 cm up to 20.99 cm and big woods i.e. ≥ 21.00cm. An adjustment was made to the available volume per tree based on the modified Hunter class and DBH class. This adjustment was then applied to every tree of the 96 stands under consideration, and a mean harvester productivity could thus be estimated; these values were used in the modeling exercise for the control scenario. Based on these calculations, the mean productivity of harvesters in degraded stands affected by the spruce budworm was thus lowered by 8% compared to productivity in healthy stands.
In the bioenergy scenario, the productivity loss calculated as described above was then reduced by half and was thus set to 4%. This was done because it was assumed that the operators could harvest all trees within the stand indiscriminately in the bioenergy scenario, which means that there is reduced machinery movement per volume of wood relative to the control scenario. Because even rotten sections of the stems are harvested, the operator spends less time on stem analysis and optimization, relative to the reference scenario, thus improving productivity. Since trees are still more prone to breaking during the forwarding operation, and because there is still some sorting to do compared to standard healthy stand conditions, there is still some productivity loss in the bioenergy scenario relative to harvesting in healthy, non-degraded stands.
17
To move the harvested stems from the cut site to the roadside, a forwarder was selected within the FPInterface software. Wood was then simulated to be transported by trucks from the roadside landing to the sawmill gate in Baie-Comeau.
Stumpage costs
Since harvesting operations occur on public (i.e. Crown) land within the province of Québec, stumpage fees had to be calculated and added to the harvesting costs. Stumpage fees are published by the Quebec government’s wood marketing bureau (Bureau de mise en marché des
bois du Québec) and are listed according to species, wood quality and management unit. The
stumpage costs used in the models are detailed in Table 3. It was assumed that stumpage was the same for pulp and bioenergy, as the government to date has not published a bioenergy stumpage rate for roundwood.
TABLE 3 STUMPAGE RATES BY QUALITY AND SPECIES FOR THE CÔTE-NORD REGION (MANAGEMENT UNIT 960, YEAR 2017)
Species Lumber stumpage rate
($/m3)
Pulp (and bioenergy) stumpage rate ($/m3)
Balsam fir (Abies balsamifera (L.) Mill) $9.00 $1.05
Spruces (Picea spp.) $15.10 $2.13
White birch (Betula papyrifera Marshall) $4.02 $0.74
Poplars (Populus spp.) $0.8 $0.8
Transport costs
Based on current knowledge, it was assumed that transport costs would not be significantly different for degraded trees compared to sound trees. Thus, the default transport costs from the FPInterface software were used. The mean transport costs, for an average distance of 59 km between the cutover and the mill, was C$10.72 /m3 delivered.
Fixed costs
Fixed costs were calculated for both control and bioenergy scenarios. The volume of harvested wood from a given cutover was larger in the bioenergy scenario, thus reducing the fixed costs per each cubic meter of volume harvested. The fixed costs identified in this study were for road construction costs and for installation of the forest camp, which were estimated at C$10.57/m3 in the control scenario using the FPInterface software. The fixed costs per cubic meter in the bioenergy scenario were estimated using the following equation:
18
Eq. 1
𝐶
𝐵=
𝐶𝐶∗𝑉𝐶𝑉𝐵
Where:
CB = Fixed cost per volumeof wood in the Bioenergy scenario
CC=Fixed cost per volume of wood in the Control scenario (10.57$/m3) VC = Total volume of wood in the Control scenario (m3)
VB = Total volume of wood in the Bioenergy scenario (m3)
While it was assumed that fixed costs for road construction and installation of the forest camp would stay constant between the scenarios, it was also anticipated that additional harvested volumes in the bioenergy scenario would increase road maintenance costs relative to the control scenario, due to the higher truck traffic. An additional maintenance cost was therefore added to the bioenergy scenario, at a rate of C$0.05/km·m3 of additional bioenergy wood harvested.
Processing costs and revenues
Wood volume distribution among products
The harvested wood volume delivered to the sawmill in Baie Comeau was processed into a range of different products depending on the scenario. The processing costs and revenues were calculated using the FPInterface software based on the average costs in Eastern Canada in the acquisition of, handling, and processing of loads of roundwood within the sawmill. In the control scenario, trees with Hunter class of 1, 2 and 3 (Table 2) were brought to the sawmill and processed into sawntimber with co-products sold for pulp. In the bioenergy scenario, trees from all Hunter classes (1, 2, 3 and 4) were brought to the sawmill; however, only trees from class 1, 2 and 3 were assumed to be processed for sawntimber, with co-products used as feedstock for pulp. Trees from Hunter class 4 were shifted to the bioenergy plant, and processed for bioenergy only.
For all scenarios, the volume of sawntimber (in thousand board feet or TBF) from black and white spruce (Picea mariana and Picea glauca) and from balsam fir (Abies balsamifera) of Hunter class 1, 2 and 3, was estimated using the equation from Barrette et al. (2012); this equation considers the degradation level of each tree, based on its Hunter classification. The sawntimber volume was estimated using the Statsaw model in R (Auty et al., 2014).
The difference between the total merchantable volume of the tree and the calculated sawntimber output provided the remaining volume for co-products, comprised of sawdust and wood chips (Barrette et al. 2012). The sawdust was assumed to represent 5% of the volume of
co-19
products, and the rest was assumed to be wood chips. In the control scenario, the wood chips and the sawdust were sold to pulp and paper operations, with different prices for each product as shown in table 4. In the bioenergy scenario, co-products from Hunter class 1, 2 and 3 trees were also directed to pulp and paper, whereas the total merchantable volume of Hunter 4 trees were directed to bioenergy.
Note that spruce budworm only impacts the softwood or coniferous trees in the stand. For the other (hardwood) tree species present, including poplar (Populus tremuloides), white birch (Betula papyrifera) and red maple (Acer rubrum), merchantable volumes were equally divided between pulp and paper and sawntimber. While this probably overestimate the sawntimber volume, the 50:50 ratio was used consistently in all scenarios in order to ensure that the bias, if any, was consistent throughout the results.
Costs and revenues
Lumber
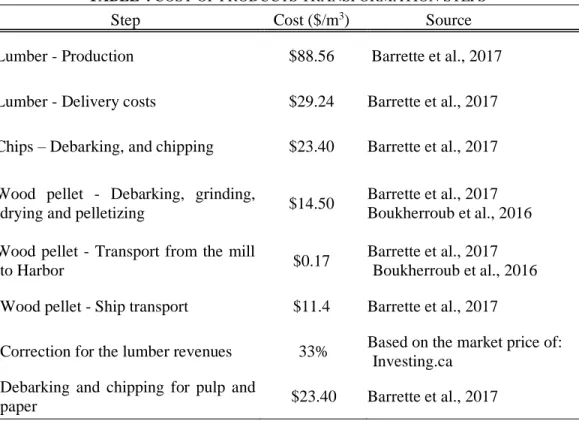
The main costs of lumber production used in this study are described in Table 4. The prices shown are in 2017 Canadian dollars (C$); the conversion rate used to change US currency to C$ was C$1.33/ $1 US, based on currency conversions published by the Bank of Canada (Bank of Canada, n.a.).
The main lumber processing costs consist of sawing, drying and planing. The combined costs for these three operations were estimated at C$88.56/m3 (Barrette et al., 2017). Delivery costs between the sawmill and the retailer were estimated at C$29.24/m3, for an average distance of 1000 km (Barrette et al., 2017).
Revenues were estimated using the equation in Barrette et al. (2012), after adjusting for differences in lumber market prices between 2012 and 2017. Since revenues vary according to stem degradation level and size, they were calculated for each individual tree.
20
TABLE 4 COST OF PRODUCTS TRANSFORMATION STEPS
Step Cost ($/m3) Source
Lumber - Production $88.56 Barrette et al., 2017 Lumber - Delivery costs $29.24 Barrette et al., 2017 Chips – Debarking, and chipping $23.40 Barrette et al., 2017 Wood pellet - Debarking, grinding,
drying and pelletizing $14.50
Barrette et al., 2017 Boukherroub et al., 2016 Wood pellet - Transport from the mill
to Harbor $0.17
Barrette et al., 2017 Boukherroub et al., 2016 Wood pellet - Ship transport $11.4 Barrette et al., 2017
Correction for the lumber revenues 33% Based on the market price of: Investing.ca
Debarking and chipping for pulp and
paper $23.40 Barrette et al., 2017
Wood chips for pulp and paper industry
The main processing cost for chips destined for the pulp and paper industry were debarking and chipping. Based on Barrette et al., (2017), the cost for these operations was estimated at C$23.40/m3.
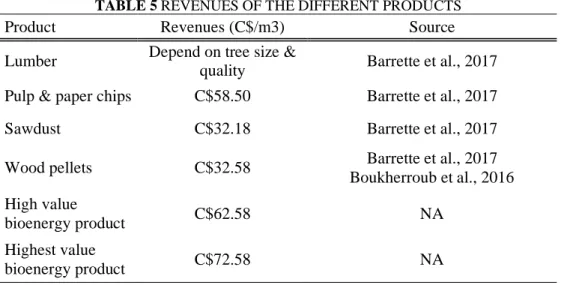
Barrette et al. (2017) used a chip value for the pulp and paper industry of C$58.50/m3 and a value of shavings and sawdust of C$32.18/m3. By subtracting processing costs from the selling price, overall revenues were estimated at C$33.78 per cubic metre of wood chips for the pulp and paper industry. To obtain net benefits, the operational costs e.g. harvesting and transporting to the mill were then subtracted from this price.
Bioenergy
Calculations were made to estimate processing costs and revenues on a unit basis for bioenergy products using wood pellets as a starting point. Since this product is already produced and sold at an industrial scale, data are already available about production costs and selling prices on international markets. Using these data as a baseline, other (higher) selling prices were used to test a range of net revenues from bioenergy, again calculated as the differences between selling
21
prices and processing costs. This was done to simulate situations where bioenergy products generated from these stands would be worth more on the market – for example, if a higher value bioenergy product such as cellulosic ethanol, biogas, or renewable diesel was being produced.
The main production costs for wood pellet production are debarking, grinding, drying and pelletizing. Based on Barrette et al. (2017) and assuming a conversion factor of 1.37 tonne of wood per tonne of pellets produced, the cost for these operations was estimated at C$14.50/m3 of pellets. This is similar to costs reported by Boukherroub et al. (2015) for a plant with capacity of 100 000 tonnes of pellets per year. Reported values for transport costs from the simulated pellet plant to the harbor of Baie-Comeau (20 km) vary between C$0.16/m3 (Boukherroub et al., 2015) and C$0.18/m3 (Barrette et al., 2017); an average value of C$0.17/m3 was used. The shipping cost (including handling) from the Baie-Comeau harbor to Rotterdam in the Netherlands was estimated at C$11.40/m3, free on board (FOB), according to Barrette et al. (2017).
The selling price for wood pellets was assumed to be C$32.58/m3 (Barrette et al., 2017), based on the hypothesis that all of the pellets produced are exported in bulk to Rotterdam for European distribution. Thus, overall revenues (subtracting processing costs from the selling price) were estimated to be C$6.51/m3.
In order to simulate alternative bioenergy conditions, two higher selling prices were also tested, adding C$30 and C$40 per cubic metre; the anticipated revenues at higher selling prices were estimated at C$62.58/m3 and C$72.58/m3.
TABLE 5 REVENUES OF THE DIFFERENT PRODUCTS
Product Revenues (C$/m3) Source
Lumber Depend on tree size &
quality Barrette et al., 2017 Pulp & paper chips C$58.50 Barrette et al., 2017
Sawdust C$32.18 Barrette et al., 2017
Wood pellets C$32.58 Barrette et al., 2017
Boukherroub et al., 2016 High value
bioenergy product C$62.58 NA
Highest value
22
Silvicultural savings
In order to estimate the silvicultural savings generated by additional biomass procurement explored in the bioenergy scenario, the default Québec value for silvicultural site preparation treatments of boreal coniferous stands following clearcut harvesting (MFFP, 2016) were used. Under the Québec system, credits of C$747/ha are given for windrowing (i.e. removal, combing and piling of coarse debris), while C$380/ha credits are provided for soil tillage operations. In the control scenario, windrowing is sometimes required to remove trees that are knocked down during harvesting operations, as well as standing trees, in order to improve soil mixing and minimize tillage costs. In the bioenergy scenario, it was assumed that only soil tillage was required for site preparation, since the additional biomass procurement already limited the amount of debris on the cutover.
Since windrowing is required (and thus credits paid) in the control scenario only in the cases where natural regeneration would otherwise be significantly hindered by debris, the probability of a stand needing windrowing needed to be estimated for the control scenario. The requirement for windrowing was assumed to be a function of a stand degradation level, since the probability of a stand to require additional site preparation is linked to the number of debris with a diameter higher than 5.0 cm, which is much higher in degraded stands (Bérubé, 2011). To estimate the probability for windrowing treatment being required, a factor of 0.25 was multiplied by the mean modified Hunter class of each stand. Thus, in the control scenario, stands with a mean modified Hunter class of 1 would have a 25% chance to need a windrowing operation, while a stand with a mean modified Hunter class of 3 would have a 75% chance to require a windrowing operation and a stand with a mean Hunter class of 4 would always receive windrowing treatment. Another important aspect of the silvicultural savings is the gain in productive forest area. In scenarios with biomass procurement for bioenergy purpose, considering a distance of 20 meters (McCavour et al., 2014) between the windrows and assuming a windrows width of 2 meters, around 10% of every cutover area is lost to windrows for the next rotation. Assuming this area will not be productive for the next decades, 10% of the revenues of the next rotation are lost in business as usual scenarios. By harvesting additional wood for bioenergy, the area reduction could be minimized or even removed, considering that the windrows will be almost inexistent because of the additional harvested biomass. If the profits of the next rotation are the same as the profits of this rotation, this would represent in average over all our stands, loss of 270$/ha (10% of the revenues estimated with table 6 and assuming the mean modified Hunter class is 1.5, the
23
volume/stem is 79 dm3, the average volume per hectare is 92 m3/ha, bioenergy is produced and the distance between the stand and the plant is 59 km). To estimate the value in $ (2017), a discount equation was used:
Eq. 2
𝑃𝑣 = 𝐹𝑣 × (1 + 𝑖)−𝑛Where:
Pv represents the present value
Fvn represents the expected value of money at year n, (C$2750/ha) i represents the discount rate (assumed to be 4%)
n represents the time in years before the cash flow (90 years)
Simulations with FPInterface provided estimates of costs, which were then used in a statistical linear regression, with the lm function of the Stats package in R software (R team, 2017). The model was fitted using a multiple linear regression, with the mean Hunter class of a stand, its mean volume per stem, the distance (km) between the stand and the processing plant- all three expressed as continuous variables - and the use of bioenergy or not- a categorical variable represented by a dummy variable with 0=No Bioenergy/Control and 1=Bioenergy- as independent variables, and the profit (C$ per m3 of feedstock harvested) as the dependent variable. Thus, it was possible, using this model, to estimate which variables had the biggest influence on the profitability of the whole bioenergy scenario.
Results
Harvesters’ productivity
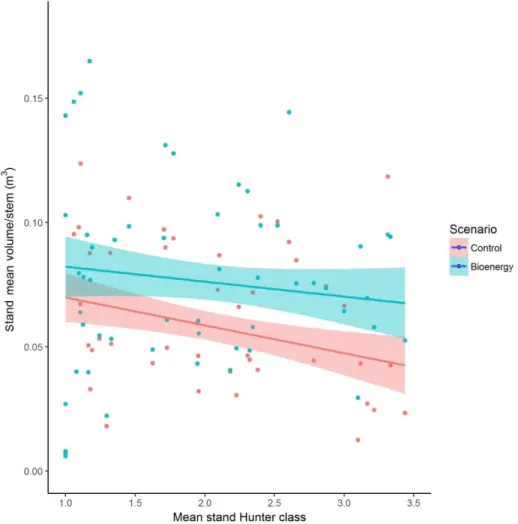
The mean harvested volume per stand was 64 m3/ha in the control scenario. This assumes that trees with a modified Hunter class of 4 were not harvested. In the bioenergy scenario, the mean harvested volume was 91.64 m3/ha, since every tree was harvested. Moreover, a relationship was found in the database between the average volume per stem, averaged per stand, and the modified Hunter class, with larger stems being more degraded and thus more likely to be harvested in the Bioenergy scenario (Figure 2). The total volume harvested from the 96 simulated stands was 64 971 m3 in the control scenario and 91 418 m3 in the bioenergy scenario, thus allowing the additional harvesting of almost 30% of wood in the bioenergy scenario. The shaded area represents the confidence interval of the line. Thus, whenever the shaded area touches, there is no significant difference between the scenarios. In the middle section, the two shaded areas are separated, meaning there is a significant difference between the two scenarios.
24
FIGURE 2 RELATIONSHIP BETWEEN THE STAND MEAN VOLUME PER STEM AND THE
MEAN HUNTER CLASS OF A STAND (CONTROL = NO BIOMASS PROCUREMENT FOR ENERGY)
Accounting for differences in harvesters’ productivity, harvested stand volume and stem volume between the two scenarios, the harvesting cost per cubic meter, including roundwood for all products and averaged over all simulated stands,was C$58.57/m3 for the control scenario, and C$45.25/m3 for the bioenergy scenario.
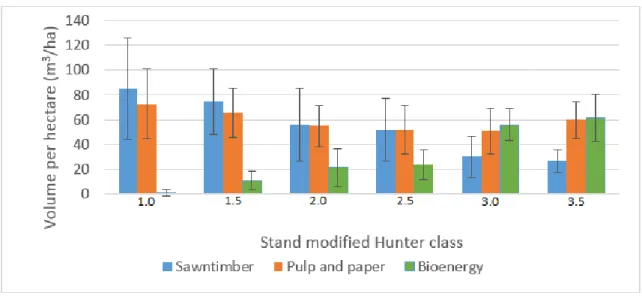
Figure 3 shows the volume distribution among the different products. It shows that when the mean modified Hunter class of a stand increases, the pulp and paper volume of the stand stays at similar levels. However, the sawntimber volume decreases as the bioenergy volume increases.
25
FIGURE 3 VOLUME DISTRIBUTION OF WOOD PRODUCTS ACCORDING TO STAND
MODIFIED HUNTER CLASS
Fixed Costs
The construction and maintenance of forest roads in the control scenario was estimated to cost C$10.57/m3, based on FPInterface software. The distribution of the fixed costs over a larger volume of harvested wood had an impact on the costs of road construction in the bioenergy scenario. Even considering the additional road maintenance costs of C$0.05/kmcaused by the increased truck circulation (equivalent to C$0.29/m3, given an average distance of 59 km between the mill and the stands) the average road construction and maintenance cost was only C$7.74/m3 in the bioenergy scenario. Accessing additional feedstocks in the bioenergy scenario therefore had the effect of saving approximately C$2.83/m3 in unit costs for all products, including lumber; this represents relative savings of 27% compared to the standard fixed costs per unit in the control scenario.
Silvicultural savings
Savings of C$367/ha are possible where the additional harvesting of biomass for bioenergy allows to avoid windrowing operations for stands in which high amounts of debris would otherwise hinder establishment of regeneration. These savings represent the difference between the price of windrowing (C$747/ha) and soil tillage (C$380/ha).
The present value of the savings made by minimizing the area lost to windrows means that the equivalent of C$63.87/ha (in 2017 dollars) could be added as a revenue today in the bioenergy scenario.
26
Considering a volume of 92 m3/ha, C$3.99/m3 could be accounted as additional benefits of procuring degraded trees for bioenergy by saving on silvicultural treatments and C$0.69/m3 could be accounted as additional benefits by preventing the loss of productive forest area, relative to a business-as-usual scenario. Taken together, C$4.68/m3 could be added to the benefits of the bioenergy scenario in stands where procuring biomass for bioenergy removes the need for windrowing and where the windrows are minimized because of additional biomass harvest. On average, across all 96 stands considered, the benefits of using bioenergy as a site preparation treatment was C$2.31/m3, with the minimum and maximum savings being C$0.90/ha and C$499/ha, respectively.
Tree degradation level
The mean stand degradation level is another important variable to predict the profitability of forest operations in insect infected forests. Indeed, results showed that the mean modified Hunter level of the stand had a significant impact on the profitability of the stand, especially in the bioenergy scenario, as shown in Table 6.
TABLE 6 RESULTS OF THE LINEAR MODEL GIVEN A BIOENERGY SELLING PRICE OF
C$32.58/M3
Term Estimate STD.ERROR P. Value
Intercept 14.48 10.32 0.16 Hunter -6.59 3.83 0.08764 Bioenergy 22.02 11.67 0.0601 Volume/stem 0.51 0.06 4.32e-13* Distance (km) -0.16 0.07 0.0338* Hunter:Bioenergy -22.53 5.26 2.93-05* Multiple R-squared: 0.51, Adjusted R-squared: 0.50* Where:
Hunter represents the mean Hunter class of a stand (see Table 2 for the different classes)
Bioenergy is a dummy binomial variable representing whether bioenergy is added to the range of products or not
Volume/stem represents the mean volume per stem of the stand (in dm3/stem) Distance represents the distance between the stand and the processing plant (in km) Hunter:Bioenergy represents the interaction between the Hunter and Bioenergy variables
The variable with the greatest influence was the interaction between the Hunter variable and the Bioenergy variables. Thus, a stand with a high modified Hunter class (i.e. high level of degradation) is likely to cause unprofitable operations in the bioenergy scenario, compared with
27
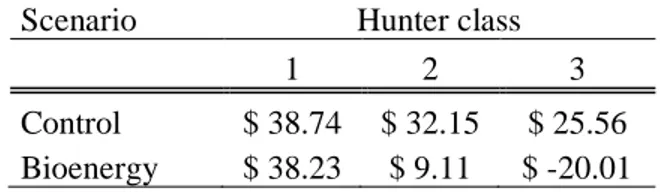
the same stand in the control scenario. An example of this is shown in Table 7, which is simply the application of the model of Table 6, showing the profitability of stands with various modified Hunter classes with or without bioenergy (bioenergy vs control), and the other variables being kept constant.
TABLE 7 COMPARISON OF THE DIFFERENCE IN PROFITABILITY (C$) FOR A CHANGING
DEGRADATION LEVEL
Scenario Hunter class
1 2 3
Control $ 38.74 $ 32.15 $ 25.56 Bioenergy $ 38.23 $ 9.11 $ -20.01
Bioenergy selling price
Figure 4 shows the influence of different bioenergy selling prices on the profitability of the stands under the bioenergy scenario, relative to the control scenario where no harvest takes place and no bioenergy values are realized. The independent variable is profits in C$/m3 (i.e. revenues minus harvesting, processing and transport/shipping costs). The dependent variable is the mean Hunter class of the stand. The figure includes the fixed costs and silvicultural savings found earlier. The shaded areas represent the confidence interval of each scenario. Thus, if the shaded areas of two scenarios touches, there is no significant difference
The scenario where the bioenergy is sold at C$32.58/m3 is clearly not as profitable as the control scenario. Thus, at current market prices (C$32.58/m3), procuring biomass for bioenergy in addition to conventional wood products incurs losses relative to a scenario without additional biomass procurement. Indeed, stand profitability with bioenergy procurement at current bioenergy market prices stays under the confidence interval for almost all of the stands considered in the study. Even at a bioenergy selling price of C$62.58/m3, which represents a tremendous increase in bioenergy value on the market, the stand profitability with bioenergy feedstock removals is lower than the control scenario, although the difference between the control scenario and the bioenergy scenario is less significant. At a bioenergy selling price of C$72.58/m3, the bioenergy scenario is more profitable than the control scenario for almost all stands, but not significantly more profitable.
28
FIGURE 4 STAND PROFITABILITY AS A FUNCTION OF DEGRADATION LEVEL AT DIFFERENT BIOENERGY SELLING PRICES