Received 29 Nov 2013
|
Accepted 24 Jun 2014
|
Published 1 Sep 2014
A Cenozoic-style scenario for the end-Ordovician
glaciation
Jean-Franc¸ois Ghienne
1
, Andre
´ Desrochers
2
, Thijs R.A. Vandenbroucke
3
, Aicha Achab
4
, Esther Asselin
5
,
Marie-Pierre Dabard
6
, Claude Farley
2
, Alfredo Loi
7
, Florentin Paris
6
, Steven Wickson
2
& Jan Veizer
2
The end-Ordovician was an enigmatic interval in the Phanerozoic, known for massive
glaciation potentially at elevated CO
2levels, biogeochemical cycle disruptions recorded as
large isotope anomalies and a devastating extinction event. Ice-sheet volumes claimed to be
twice those of the Last Glacial Maximum paradoxically coincided with oceans as warm as
today. Here we argue that some of these remarkable claims arise from undersampling of
incomplete geological sections that led to apparent temporal correlations within the relatively
coarse resolution capability of Palaeozoic biochronostratigraphy. We examine exceptionally
complete sedimentary records from two, low and high, palaeolatitude settings. Their
correlation framework reveals a Cenozoic-style scenario including three main glacial cycles
and higher-order phenomena. This necessitates revision of mechanisms for the
end-Ordovician events, as the first extinction is tied to an early phase of melting, not to initial
cooling, and the largest d
13C excursion occurs during final deglaciation, not at the glacial apex.
DOI: 10.1038/ncomms5485
OPEN
1Institut de Physique du Globe de Strasbourg, UMR7516 CNRS/Universite´ de Strasbourg, 1 rue Blessig, 67084 Strasbourg, France.2Department of Earth
Sciences, University of Ottawa, Ottawa, Ontario, Canada K1N 6N5.3Ge´osyste`mes, UMR8217 CNRS/Universite´ Lille 1, Avenue Paul Langevin, baˆtiment SN5,
59655 Villeneuve d’Ascq, France.4Institut National de la Recherche Scientifique, Centre Eau Terre Environnement, 490 rue de la Couronne, Quebec City,
Quebec, Canada G1K 9A9.5Natural Resources Canada, Geological Survey of Canada, 490 rue de la Couronne, Quebec City, Quebec, Canada G1K 9A9.
6Universite´ de Rennes 1, Ge´osciences CNRS UMR 6118, Campus de Beaulieu, 35042 Rennes, France.7Dipartimento di Scienze chimiche e geologiche,
Universita` degli Studi di Cagliari, Scienze della Terra, Via Trentino, 51, 09127 Cagliari, Italy. Correspondence and requests for materials should be addressed to
S
helf sedimentary architecture is controlled essentially by
relative rates of base-level change and sediment supply
1,2.
The base level reflects the interplay between tectonics
(subsidence, volume change at mid-oceanic ridges) and the
orbitally tuned, glacio-eustatically driven, sea-level change. The
rate of the latter, at tens of metres per 10
4–10
5years, is one to
three orders of magnitude greater than the tectonically driven
sea-level change, at tens of metres per million years or less. The
critical issue for analysing the stratigraphic record, therefore, is
the correct assignment of depositional units to their appropriate
temporal hierarchy alongside a given sea-level curve. Another
consideration is the temporal significance of the observed or
suspected hiatuses. Any stratigraphic record of ancient shelf
deposits, and their isotopic or palaeontological proxies, inevitably
samples only the discontinuous segments of a given sea-level
curve
3, which often are below the relatively coarse resolution
correlation potential of Palaeozoic biostratigraphy
4. Regardless,
shelf deposits are the principal record that we have for
pre-Mesozoic glaciations and they must therefore serve as
stratigraphic archives for glacially driven events, providing:
subsidence was active; water depths at the onset of glaciation
were moderately deep; and sediment supply was adjusted to
subsidence rates. These preconditions are essential for the
maintenance of significant water depths during glaciation, as
any rapid shallowing would pre-empt the registration of
subsequent glacio-eustatic events.
The end-Ordovician witnessed one of the three largest
Phanerozoic glaciations with the development of
continental-scale ice sheets
5–7. This climatic event was postulated to have
been initiated by massive weathering of fresh volcanic rocks
8,
tectonics and related plate motions
9–11, high cosmic ray flux
impacting cloud albedo
12or by a combination of the above
13. The
glaciation apparently coincided with highly
14or moderately
10,15elevated CO
2levels, with large isotopic excursions (C, S, O, N,
Nd), and with a major double-phased biological extinction
16–22.
Interpretations based on far-field, low palaeolatitude sequences,
resulted in ‘coup-de-the´aˆtre’ scenarios that have tied the two
phases of extinction to the onset and termination of a single
glaciation
16,17,21. Yet the high palaeolatitude near-field sequences
contain up to five glacial cycles that can be tentatively correlated
across the Gondwanan glaciated platforms
5,23. The low
palaeolatitude archives must therefore represent a more
complex scenario
18,22,24–26than that of a single, major glacial
event. If so, a multiorder climate signal with a hierarchy of cycles,
a Cenozoic-type ‘business as usual’ scenario, is a more likely
alternative than a large singular event. Such linkage of eustatic,
biological and isotopic records to the climatically forced
development of an ice sheet can only be contemplated within a
framework
of
high-resolution
sequence
stratigraphy
that
integrates allo-, chemo- or biostratigraphic markers.
Here, we present such a framework, based on the recognition
of genetic stratigraphic sequences (GSSs) and intervening erosion
surfaces (see Methods). This framework, driven by glacio-eustatic
cycles tied to the evolution of polar continental-scale ice sheets
over west Gondwana
5, enables the correlation of eustatic cycles at
a level that is beyond the resolution capability of most absolute
dating methods and of biozones, the latter typically of Myr
duration
4. A Cenozoic-style scenario including three main glacial
cycles and higher-order phenomena necessitates the revision of
the end-Ordovician, glaciation-related sequence of events.
Results
Palaeolatitude sequence stratigraphic frameworks. We
intro-duce sequence stratigraphic correlation frameworks for two
superbly exposed
and exceptionally
well-developed
latest
Ordovician
successions
(Fig.
1),
the
Anti-Atlas
of
Morocco
7,27,28and Anticosti Island in Canada
25,29. Both offer
sections, on a 100-km scale, from the basin edge to the axis of
active sedimentary depocentres (Fig. 2 and Supplementary Figs 1
and 2). Relative to the end-Ordovician ice-sheet centre
(present-day north-central Africa), they provide a near-field (Anti-Atlas,
siliciclastic platform) and a far-field (Anticosti Island, mixed
carbonate and siliciclastic) stratigraphic record. These two
successions, up to 300 and 100 m thick, respectively, were
deposited in basins with notable subsidence rates and significant
(ca. 100 m) initial Katian water depths, enabling the development
of comprehensive archives of the latest Ordovician glaciation
(Supplementary Fig. 3). On the basis of average shelf-depositional
rates within the overall Late Ordovician context
7,27, and on
comparison with analogous late Cenozoic shelf stratigraphies
3,30,
such thick successions are considered to be long-term
4
4100s kyr archives. In both areas, the end-Ordovician
comprises three genetic low-order stratigraphic sequences
(GSSs) of highest significance that, in turn, encompass a
number of higher-order GSSs of intermediate and low
significance (Fig. 2; see the Methods).
The intercontinental correlation of these two successions is
made possible due to the recognition of marker intervals. Earlier
palaeontological studies already bracketed the stratigraphic
interval that contains the well-known end-Ordovician extinction
events (Supplementary Figs 1 and 2). In both sections, the first
extinction event is situated around the conventional Katian–
Hirnantian boundary, which in our record is
penecontempora-neous with the major bounding surface that separates the two
lower low-order GSSs. The related ‘maximum flooding interval’—
rather than the maximum flooding surfaces (MFS) that cannot be
strictly synchronous at the global scale—is our first marker.
It correlates with the brief ‘pre-Hirnantian deepening’ event
identified in western Laurentia
22. The second marker based on
allostratigraphy relies on the signature of the end-Ordovician
glacial climax. In the Anti-Atlas, it demonstrably correlates with
the stratigraphic interval bounded by glacial erosion surfaces and
includes widespread glacial (subglacial, glaciomariney) deposits
in the basinal succession (the glacial interval in Fig. 2). Note that
coeval strata are often absent in basin edge successions (Hajguig
Wadi log in Fig. 2). In the Anticosti Island succession, the
signature of the glacial climax (lowest sea levels) is ascribed to the
prominent erosional unconformity at the base of the Laframboise
Mb. The result is a severe erosional truncation of the studied
interval (Fig. 2 and Supplementary Fig. 2). Regional correlation of
low- and high-order GSSs between these two markers is indeed
intriguing (Fig. 2). Moreover, other subordinate erosional
unconformities at the basin edge of the Anti-Atlas succession
have their counterparts in the Anticosti Island succession. For the
highest-order GSSs, at least partially related to local processes,
such correlations are less reliable.
The end-Ordovician glacial tempos. Within the context of
glaciation, where eustasy is expected to control shallow shelf
sequences
3, our findings strongly suggest that the two
independent regional scale frameworks and their correlation are
robust and that the correspondence of the low- and high-order
GSS records from dissimilar tectonic and environmental settings
arises from glacio-eustatically fluctuating sea levels, the latter a
consequence of waxing and waning of the western Gondwana ice
sheet. We interpret the three low-order GSSs to be the signature
of the three extensive glacial cycles (Latest Ordovician Glacial
Cycles, LOGCs 1–3; Figs 2 and 3 and Supplementary Note). Note
that our provisional numbering refers to the latest Ordovician,
understood to informally include the highest Katian and the
Hirnantian. This is in agreement with the views that ice sheets
were extant already before the latest Katian
7,22,31,32. Our first
glacial cycle spans the upper Katian (LOGC 1), the second
(LOGC 2) includes the uppermost Katian strata and most of the
lower to middle part of Hirnantian and the third (LOGC 3)
commences in the upper Hirnantian and ends in the lowermost
Silurian. In our view, corroborated recently by Nd isotope
studies
22, the end-Ordovician glaciation could not have been
restricted to a single short-lived glacial event, as earlier believed.
The minimum depositional time for the entire LOGC 1–3
succession is in excess of the Hirnantian duration (B1.4±0.2
Myr
33), the latter encompassing about 60–90% of the LOGC 2
and some 40–80% of the LOGC 3. Assuming that all LOGCs
are of about equal durations, a single LOGC corresponds to a
0.7–1.6 Myr
time
span.
The
embedded
higher-frequency
multiorder event stratigraphy is typical of orbitally controlled
climatic oscillations that lead to recurring ice-sheet growth
stages
34, in agreement with the modelling results of Hermann
et al.
35Note however that in contrast to the well-known, strongly
asymmetric and shorter-term, Pleistocene glacial cycles
36, our
LOGCs show no abrupt deglaciations. They have a symmetric
distribution of the high-order GSSs, as evident from the stacking
patterns within the low-order regressive to transgressive system
tracts (TSTs). Long-lasting interglacials are expressed as
condensed, maximum flooding stratigraphic intervals
7that
account for significant portions of the overall duration of the
studied time span (Fig. 3). Despite of some similarities to
Quaternary glaciations
5,7,15,31,37, the durations and internal
organization of LOGCs argue for dissimilar glacial tempos and
forcings. These Ordovician features and tempos more closely
resemble the Oligocene climate patterns that were driven by a
high-amplitude obliquity modulation at 1.2 Myr frequency
34,
resulting in a limited number of short-lived ice-sheet growth
phases, our high-order GSSs, centred around the obliquity
nodes
38,39. Such high-frequency signals may hold some
similarities to the metre-scale cycles described from other
low-latitude areas and attributed to
E200 (ref. 40) or 40–130 kyr
(ref. 32) frequency oscillations.
Assuming the analogy with the Oligocene climate is valid, we
hypothesize that an orbital forcing responding to the amplitude
modulation of the obliquity typifies glacial climate systems at
relatively high CO
2atmlevels. In such a scenario, the ice-sheet
inception, driven by ice-albedo feedbacks, may have resulted from
a dearth of exceptionally warm rather than a ubiquity of
exceptionally cool summers
38.
Discussion
Our sequence stratigraphic framework allows Hirnantian
excur-sion(s) and extinction(s) to be revisited. The large positive carbon
isotope excursions of the Palaeozoic, such as the Hirnantian
Isotopic Carbon Excursion, HICE in LOGC 3 (refs 17,18,41–43),
are often used as chronostratigraphic markers, albeit with no
consensus model for their existence. Yet, the notion that the
LOGC 1 40 m LOGC 2 LOGC 3 30 °N lapetus Rheic 30 °S 60 ° S 1 km LOGC 3 LOGC 2 LO GC 1 Laframboise Mb. Port meunier N 0° Laurentia Baltica Tacon ic Orogen West Gondwana ice sheet N. Gondwan shelf
Figure 1 | Geological settings. (a) Position of the two study areas on a palaeogeographic reconstruction (modified from Achab and Paris56). In the Late
Ordovician, the Anti-Atlas succession was part of the North Gondwana shelf, an epicratonic domain at high palaeolatitudes (green star). It included an actively subsiding depositional trough, which was free of ice until the middle Hirnantian, but glaciated during the glacial maximum in the upper Hirnantian. In contrast, the Anticosti Island succession accumulated in a foreland basin that developed at low palaeolatitudes during closure of the Iapetus Ocean at the onset of the Taconic orogeny (orange star). (b) On Anticosti Island, cliffs and marine platforms provide a superbly exposed latest Ordovician to early Silurian mixed siliciclastic–carbonate shelf succession. At Pointe Laframboise, alternating limestone (inner ramp) and softer shale (outer ramp) intervals across the shoreline platform clearly reflect the sequence stratigraphic correlation scheme inferred from sedimentary facies analysis. (c) Extensive outcrops of the Anti-Atlas
Palaeozoic succession offer a superb record of predominantly shallow-marine Cambrian to Carboniferous sequences27,65. Near Tazzarine, a thick (up to 350 m)
succession of alternating sandstones (storm- to tide-dominated, subordinate glaciation-related deposits) and offshore shales allows a compelling sequence stratigraphic correlation framework to be established for the latest Katian and Hirnantian (see Fig. 2). Coloured triangles represent the three identified Late Ordovician Glacial Cycles (LOGC1–3) that comprise a lower, orange/yellow triangle (regressive system tracts, RSTs) and an upper, purple triangle (transgressive system tracts, TSTs). LOGC are bounded by dotted lines, underlining MFS. Other surfaces: dashed lines, sharp-based surfaces and their correlatives within RSTs; solid lines, maximum regressive surfaces; wavy lines, subaerial erosion (Anticosti) or basal glacial erosion surface (Anti-Atlas).
d
13C
carbsignal of shelf carbonates is a direct reflection of the
d
13C
DICof the globally uniform open ocean is clearly open to
debate
13,26(Supplementary Discussion). Note that the magnitude
and occurrences of such
13C enrichments depends on localized
settings (for example, epeiric versus open ocean aquafacies
22,44)
and is therefore related to depositional facies and not
straightforwardly to a global signal. For example, the d
13C
carbon the modern Bahamas Bank is considerably more positive than
that of the open ocean
45.
In addition, our revised chronology questions the paradigm
of temporal relationships that link the position of the
end-Ordovician glacial cycles, their tempos and biochemical
events
13,16–22,26. The first issue that arises is the identification
and temporal range of the HICE itself. If it is understood as
coeval with the large þ 4% isotopic excursion, it has to be
confined to a restricted time interval of a single high-order GSS
within the end-Ordovician glaciation (Fig. 3), as posited by the
Anticosti case study. If, on the other hand, understood as a
13C
signal that commences in the latest Katian and ends in the latest
Hirnantian, our results (Fig. 3 and Supplementary Table 1) show
13
C enrichments in at least three stratigraphic positions, suggesting
that HICE combines several excursions, thus challenging its validity
as a high-resolution chronostratigraphic marker.
The Anticosti d
13C
carbcurve (Fig. 3) includes two main
isotopic events. First, it is the well-known excursion in the
Laframboise Mb. ( þ 4%) that is disconnected from a rising limb
in the underlying strata by a major unconformity that we relate to
the glacial maximum and to subaerial erosion in LOGC 3.
Second, there is an earlier asymmetric excursion ( þ 2%) with its
descending limb that is spanning the lower and middle parts of
the Ellis Bay Fm. (LOG 2). There is also a lesser enrichment in the
uppermost Vaure´al Fm., associated with LOGC 1, which may
form a third, subordinate excursion. Other putative (o1%)
excursions, while present, are minor and difficult to interpret.
This multi-peak isotope pattern at Anticosti Island questions the
views of strictly synchronous signals, despite observations that a
number of Hirnantian records worldwide—and potentially
similar ‘wiggles’ in the carbon isotope record elsewhere—
contain positive d
13C spikes that appear isochronous
17,24,46within the correlation capabilities of the Palaeozoic bio- and/or
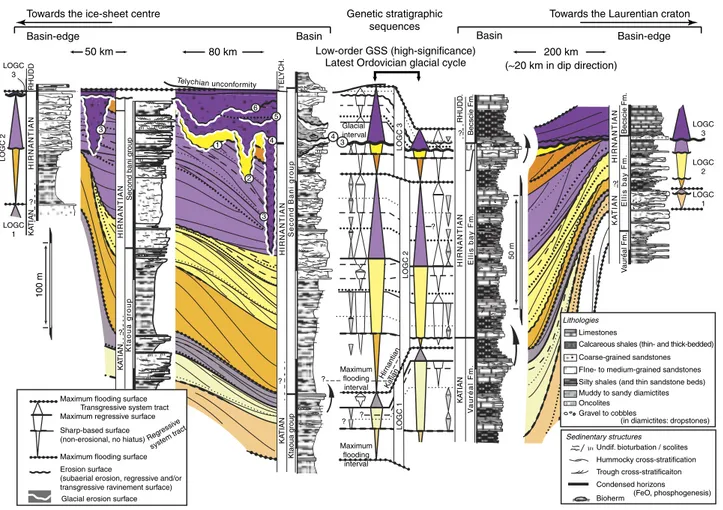
Central Anti-Atlas Anticosti island
Towards the Laurentian craton Towards the ice-sheet centre
Basin-edge LOGC 3 RHUDD RHUDD . Becscie Fm. Becscie Fm. Ellis ba y Fm. 50 m KA TIAN KA TIAN KA TIAN KA TIAN Ellis ba y Fm. V a uréal Fm. V a uréal Fm. KA TIAN Ktaoua g roup Ktaoua g roup HIRNANTIAN HIRNANTIAN HIRNANTIAN HIRNANTIAN
HIRNANTIAN Second Bani g
roup Second bani g roup LOGC 2 Basin-edge 200 km (~20 km in dip direction) 50 km 3 80 km TEL YCH. Basin Basin Low-order GSS (high-significance) Latest Ordovician glacial cycle
Genetic stratigraphic sequences LOGC 1 ? ? ? 100 m ? ? ? LOGC 3 LOGC 2 LOGC 1 Glacial interval LOGC 3 LOGC 2 LOGC 1 4 3 Lf ? ? ? Maximum flooding interval Maximum flooding interval Hir na ntian Katian Lithologies Limestones
Calcareous shales (thin- and thick-bedded)
Maximum flooding surface Maximum regressive surface Sharp-based surface (non-erosional, no hiatus) Reg
ressiv e
system t ract
Erosion surface
(subaerial erosion, regressive and/or transgressive ravinement surface) Glacial erosion surface Maximum flooding surface
Transgressive system tract
Coarse-grained sandstones FIne- to medium-grained sandstones Silty shales (and thin sandstone beds) Muddy to sandy diamictites Oncolites
Gravel to cobbles
Undif. bioturbation / scolites Hummocky cross-stratification Trough cross-stratificaiton Condensed horizons
(FeO, phosphogenesis) Bioherm
(in diamictites: dropstones)
Sedinentary structures 6 5 4 1 2 3 Telychian unconformity
Figure 2 | Sequence stratigraphic correlation frameworks in the Anti-Atlas and Anticosti Island successions. The two frameworks were established separately and later correlated (note the different vertical scales: 50 m and 100 unit bars for the Anti-Atlas and Anticosti Island successions, respectively). Both show three superposed low-order GSSs that comprise alternating RST and TSTs symbolized by coloured, orange/yellow and purple triangles, respectively. These low-order GSSs include higher-order GSSs (high- and highest-order GSSs) of intermediate and low significance, symbolized by smaller triangles (white and grey triangles, respectively). Apparent intercontinental correlation of the two sequence stratigraphic frameworks for
low- and high-order ranks confidently supports the proposition that the low-order GSSs are signatures of three successive LOGCs, which together encompass a 2–4 Myr latest Katian to lowermost Silurian time interval. Because the high- and highest-order GSSs relate to the relative rates of base-level changes (Supplementary Fig. 3), rather than to a priori assumptions about sequence duration, no temporal significance can be attributed at this stage. We retain here lithostratigraphic names because the related boundaries crosscut timelines, for example, the Katian/Hirnantian boundary (see Supplementary Figs 1 and 2). Lf: Laframboise Member. Black arrows point to stratigraphic interval with significant faunal turnovers. Encircled numbers 1–6 refer to the numbering of glacial erosion surfaces (see Supplementary Fig. 1).
chronostratigraphy
26. An apparent single peak may represent
only disjointed parts (Fig. 4) of a hypothetically complete d
13C
carbcurve for just one of several repetitious LOGCs, or a composite
signal from an artificially stacked section.
Whatever the temporal extent of HICE, our sequence
stratigraphic framework warrants reconsideration of the
pub-lished ‘cause-and-effect’ scenarios for its origin. The rising limb of
the
13C excursion at the base of the Ellis Bay Fm. (Fig. 3) is
associated with a highstand that follows the LOGC 1–2 transition,
while its descending limb spans several high-frequency
glacio-eustatic cycles within the late regressive to TSTs of the LOGC 2.
In this case, there is therefore no apparent connection between
eustasy and the d
13C
carbcurve. The simplest explanation is to see
the LOGC 2 isotopic signal as that of regional epeiric water
masses with their distinctive variations in d
13C (ref. 44). In
contrast, the subsequent, exceptionally high-amplitude excursion
is within the TST of LOGC 3, and is associated with a drastic
basin-scale change of facies caused by transition from glacial to
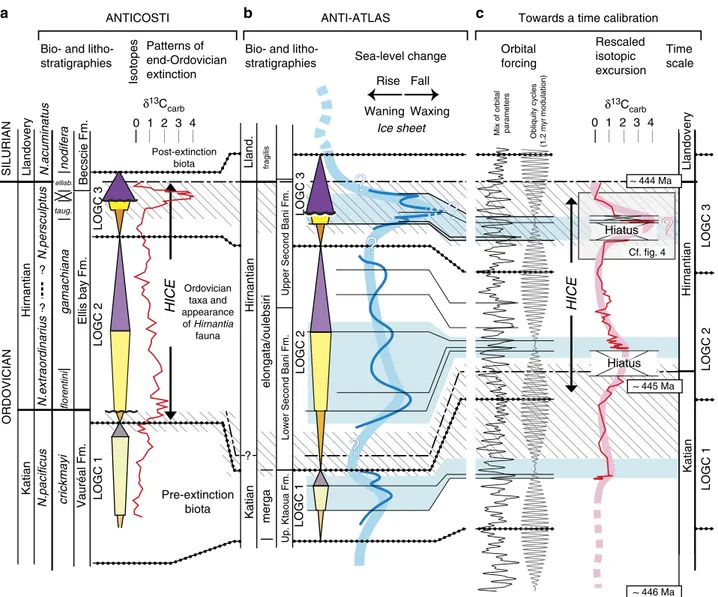
Bio- and litho-stratigraphies
a
Post-extinction biota Ordovician taxa and appearance of Hirnantia fauna ? Pre-extinction biota 0 ? ? ellisb. taug. 1 δ13C carb 2 Lland. Hirnantian KatianHICE
3 4Bio- and
litho-stratigraphies Sea-level change
Rise Fall
Waning Waxing
Mix of orbital parameters
HICE
Obliquity cycles (1.2 myr m odulation) Ice sheet Orbital forcing Rescaled isotopic excursion Time scale Llandovery LOGC 3 LOGC 2 LOGC 1 LOGC 3Upper Second Bani Fm.
fragilis
LOGC 2
LOGC 1
Up. Ktaoua Fm.
Lower Second Bani Fm.
elongata/oulebsiri merga LOGC 3 Becscie Fm. Ellis bay Fm. LOGC 2 LOGC 1 Vauréal Fm. crickmayi N.pacificus N .extraordinarius N .persculptus N.acuminatus florentini gamachiana nodifera Katian Hirnantian Patterns of end-Ordovician extinction
ANTICOSTI ANTI-ATLAS Towards a time calibration
Isotopes SILURIAN Llandovery Hirnantian Katian ORDOVICIAN 0 1 δ13C carb 2 3 4 ~ 444 Ma ~ 445 Ma ~ 446 Ma Hiatus Hiatus Cf. fig. 4
?
?
?
?
?
?
b
c
Figure 3 | Perspective of sequence stratigraphy. Temporal correspondence between documented (chitinozoa54,55,59,60) or essentially inferred
(graptolite) biostratigraphies and (a), the Anticosti Island succession with its related isotopic signal and faunal turnovers and (b), the Anti-Atlas succession with interpreted low-frequency sea-level changes and ice-sheet occurrences. A cycle hierarchy is developed that distinguishes LOGC1–3
(low-order, high-significance Late Ordovician Glacial Cycles represented by both coloured triangles and the thick, pale blue curve) from high-order cycles (thin, dark blue curve). LOGCs are bounded by major MFS (dotted lines). Blue shading highlights time intervals specifically characterized, or thought to be characterized by ice-sheet development stages. The ice-sheet development increased from the late Katian to the late Hirnantian, as suggested by glacioeustatic trends. The dashed blue curve is a representation of the early Silurian eustatic background. Black, dashed lines are the inferred Katian to Hirnantian and Hirnantian to Llandovery boundaries. (c) Representation of a potential time calibration is based on astronomical forcings dominated by
1.2 Myr amplitude modulation of obliquity cycles34(see text for details). By analogy with the Cenozoic, the composite artificial curve was constructed by
mixing high-frequency orbital cycles (‘ETP’ for eccentricity–tilt–climatic precession33) and here it is shown only to illustrate the distortion in the
stratigraphic record. It results in condensed transgressive and overdeveloped lowstand intervals, relative to a linear timescale. The high- and highest-order glacial cycles likely correspond to such orbitally forced, high-frequency climatic oscillations. In contrast, during the long interglacials orbital forcing did not result in ice-sheet development and they have therefore a poorly differentiated record. The end-Ordovician includes short glaciation intervals with cumulative duration of perhaps a few hundred thousand years. The embedded isotopic and biological signals show up to three discrete isotopic events and two faunal turnovers (oblique-line shading), from the highest Katian to uppermost Hirnantian. The Hirnantian isotopic carbon excursion (HICE) is not restricted to the excursion associated with LOGC 3 at the top of the Ellis Bay Fm. The dashed pink curve is a representation of the Katian istopoic background.
warmer climates (reefs of the Laframboise Mb.). At a higher
resolution, the excursion appears to be confined to the highstand
of a high-order GSS (Fig. 4), thus peaking at times of rising sea
levels associated with deglaciation. This coincidence is opposite to
the postulated lowstand conditions that are essential in the
‘weathering’ scenario
11and the model can be discounted as a
potential explanation. The ‘productivity’
47and related ’circulation
pattern’ explanations
48,49could perhaps offer plausible
alter-natives, providing it can be demonstrated that the isotopic
excursion is not facies dependent. Our highstand nadir of isotope
excursion can then be consistent with the scenario that invokes
carbon storage in the deeper parts of the shelf
39, albeit
constrained—because of it high amplitude—to basinal, not
global, scales (see box model in Supplementary Discussion and
Supplementary Tables 2 and 3). In such a context, the particular
highstand conditions favourable for the development of carbon
excursions may arise at distinct locations during any high-order
GSSs. If so, it is the short duration of contiguous high-order
GSSs that give the impression of a synchronous, worldwide
phenomenon during the LOGC 3 transgressive trends. For minor
excursions, such as those in LOGC 1 or in the uppermost (below
the unconformity) Ellis Bay Fm., we contend that our present-day
knowledge of carbon isotope systematics does not permit unique
diagnostics of causative factors and scenarios. We therefore desist
from their interpretation.
In summary, providing our sections represent sufficiently
comprehensive archives of the latest Ordovician development, we
dispute the apparent association of each LOGC with an individual
isotopic excursion. At higher resolution, the relationship with
sea-level history differs from case to case, indicating that it is not a
unique forcing but likely a combination of processes that is
involved in
13C enrichment
21.
Similar reasoning may suggest that ‘pulses’ in patterns of the
end-Ordovician biological extinction result from telescoping of
δ13C
carb Sea-level change
Fall Rise
50–150 m
Prograding ramp
Hardground development and shoreline ravinement
estuarine valley fill
Keep-up reefs oncolitic lag shoreline revinement Onset of second faunal turnover
?
?
?
?
?
?
Post-extinction recovery 0a
reefs ‘Linear’ timescale 1 Stratigraphic succession Laframboise Mb. Lousy Cove Mb. ≈ 1 m Becsie Fm. 2 3 4 δ13C carb 0 1 2 3 4 Suba erial e xposure Suba erial expos ure (Hirn antian glaci al clima x)b
c
Figure 4 | A detailed interpretation of the far-field LOGC 3 stratigraphic and isotopic record. (a) The main lithostratigraphic units on Anticosti Island,
including the Laframboise Member, are shown with their representative depositional facies and related d13C curve. They are separated by shoreline
ravinement unconformities62. The sequence stratigraphic interpretation differentiates low-order/high-significance regressive (orange and yellow triangle)
and transgressive (purple triangle) system tracts. The corresponding first-order unconformity coincides with the base of the Laframboise Member. High-order cycles represented by white triangles are present in the LOGC 3 TST, which commences with the base of the Laframboise Member. (b) The same sequence in the ‘linear’ timescale perspective of this succession of depositional events. It includes relatively long depositional hiatuses (oblique-line shading). At Anticosti, the high-frequency glacio-eustatic sea level changes, similar to those recorded in the near-field glacial record of Morocco, are represented by unconformities coeval with the glacial maxima. One recorded interglacial event (Laframboise Mb.) is interpreted here as a
single high-order GSS within the larger TST of LOGC 3. (c) An alternative view of the isotopic excursion, which includes the stratigraphic hiatuses. The d13C
record captures only disjointed segments of the isotope signal. In particular, the d13C curve does not include values from the time interval that corresponds
to the Hirnantian glacial climax. We suspect that the trend from background levels to the maximum in fact combines an initial rise that predates the glacial climax, the associated hiatus and the subsequent maximum that postdates the glacial climax. This maximum is developed mainly within the reefal limestones constituting the highstand facies of a particular high-order GSS.
segments from the stratigraphic record, as must be the case for
hiatus-dominated successions
20. The two phases of the Late
Ordovician mass extinction that were documented worldwide in
earlier studies
17,21are however confirmed also by our results on
the Anticosti Island (Fig. 3 and Supplementary Fig. 2). Our
correlation framework moreover indicates that these turnovers
are relatively long-lasting time intervals that encompass several
glacio-eustatic fluctuations of the high or highest GSSs in
the Anti-Atlas record. Whether these turnovers originate from
evolution specifically related to LOGC developments, or whether
they only mirror a succession of stacked, quasi-instantaneous,
pulses is beyond resolution of our data set, regardless of their
potential combination within protracted, global events
21,50. The
ensemble of our sections studied represents only a fraction of
affected palaeohabitats and biota, and, as explained, sections that
contain complementary palaeontological data cannot be readily
correlated into our framework; our analyses thus likely
undersamples the full biotic dynamics through this interval.
Yet, our juxtaposition of extinction phases to glacial development
suggests a more nuanced scenario than previously advocated
(Fig. 3).
The older turnover, which has classically been associated
with the onset of the Hirnantian glaciation at the base of the
N. extraordinarius Biozone, spans an interval that includes LOGC
1 deglaciation and the early LOGC 2 highstand. This turnover
corresponds therefore mostly to the first major interglacial period.
The models that are based on processes linked to glacial onset,
such as the shrinkage of biotic ecospace, temperature decline
or development (or the loss) of anoxia during falling sea
level
13,15,20,21, are thus not compatible with this revised
scenario. Instead, processes linked to deglaciation dynamics (for
example, amplification of meltwater fluxes that enhance ocean
stratification), or flooding of the shelves by relatively deep anoxic
waters
13,21,51, appear to be more likely scenarios for this first
turnover, but they are not applicable, as previously envisioned,
for the second turnover. The second turnover that we recognize
in LOGC 3 is an event traditionally assigned to the lower part of
the N. persculptus Biozone. This extinction/recovery pattern
affects mostly macrofauna in the Anticosti Island succession
(Supplementary Fig. 2). The phytoplankton crisis, on the other
hand, commenced beneath the regional unconformity (Fig. 4),
that is before glacial climax of LOGC 3 (refs 42,52), suggesting
that the second end-Ordovician faunal turnover may have been
initiated already during the late Hirnantian ice-sheet waxing, thus
casting doubt on a unique causative linkage that would have been
confined to final deglaciation. Note nevertheless that the
ubiquitous existence of worldwide hiatuses at that time makes
any interpretation tentative.
While we appreciate the merits of a sophisticated model-driven
approach, and welcome the impetus derived from it, the insights
arising here from the application of basic geological methods
underline the need for detailed understanding of the rock record
as well
13. In this contribution, temporal relationships of near-field
and far-field records for the end-Ordovician glaciation are
considered within a high-resolution, multiorder correlation
framework that reflects a Cenozoic-style hierarchy of
glacio-eustatically driven oscillations consisting of three main cycles and
superimposed
higher-order
subcycles.
This
interpretation
questions earlier views that were based on lower resolution data
sets for a simple latest Katian decline in sea level followed by its
rise in the upper Hirnantian. An oversimplified sedimentary
succession likely incorporates significant hiatuses and represents
only a partial record of the entire time interval
18,53. Frequently,
such stratigraphic sections correspond to vertically juxtaposed,
unrelated parts of glacial cycles, resulting in biased timing of
biochemical signals relative to the glacial tempos. On the basis of
our framework, we anticipate that the most easily captured phases
in the worldwide end-Ordovician development should reflect the
initial waxing stage and potentially the immediately ensuing
flooding event (LOGC 1), followed by later reflooding of the
shelves at the end of LOGC 3. In more comprehensive
successions, the maximum flooding interval at the LOGC 2-3
transition (mid-Hirnantian transgression
5) will likely yield a
decipherable signature
22.
The orbitally controlled depositional record of a glacial interval
will mostly be underrepresented in proven or suspected hiatuses.
These may originate from nondeposition, subaerial or subglacial
unconformities, transgressive post-glacial ravinement processes,
mass movements or from erosion by bottom currents, the latter
being particularly effective for the deeper parts of shelf basins.
Due to the lack of Palaeozoic deep-sea records, the absolute
timing and calibration of the Ordovician glaciation may remain
enigmatic
13. We envision therefore that future progress in
understanding the temporal, spatial and causal evolution of the
Late Ordovician environmental record will have to rely on
high-resolution methods that capture multiorder sequence stratigraphy
and related proxies along depositional profiles on a regional scale.
Our advances using these methods include: rejection of the earlier
cause-and-effect scenarios for HICE(s), as these no longer fit with
the revised context of glacial/ glacio-eustatic development; the
suggestion that low-order LOGCs likely represent the 1.2 Myr
long obliquity cycles that modulated ice-sheet dynamics, similar
to scenarios proposed for the Oligocene; and the insight that the
first Hirnantian extinction pulse, contrary to earlier studies, was
linked to an intervening melting phase, not to the initial cooling
phase of the end-Ordovician.
Methods
GSSs
.
Sequence stratigraphic correlation frameworks are based on visualcorre-lations of marker beds along continuous exposures at the 10–30 km scale (Fig. 2) and on refined, regional scale, chitinozoan-based biostratigraphies for northern
Gondwana54–58and eastern Laurentia59,60. This results in correlations that are
noticeably different from lithostratigraphic schemes (Supplementary Figs 1 and 2). MFS and a variety of erosion surfaces have been delineated in the field. The MFS coincide with deeper, usually condensed, depositional conditions and serve as
bounding surfaces for GSSs61, ideally including a lower regressive system tract
(RST) and an upper transgressive system tract (TST). Erosional surfaces correspond to glacial erosion surfaces (Morocco); subaerial unconformities reworked by transgressive ravinement processes (SR-U sensu Embry, 2009 (ref. 62); Anticosti); or sharp-based erosional surfaces punctuating regressive facies trends and ascribed in most cases to regressive surfaces of marine erosion (Anti-Atlas and
Anticosti). We favour GSSs over Trangressive/Regressive62(T–R), or depositional
sequences2because their bounding surfaces (MFS) better approximate late
deglaciation conditions and thus appropriately bracket glacial cycles. In this scheme, a post-glacial highstand of an interglacial is represented by deposits that constitute the lower part of the subjacent sequence.
Sequence hierarchy
.
Stratigraphic surfaces have been assigned to a hierarchy ofGSSs. The significance of facies shifts and/or their penetration into the basin are used as criteria to assess the relative magnitude of base-level falls in successive,
multiorder sequences. It results in a data-driven hierarchy62, different from a
frequency-related scheme based on a priori assumptions about durations of sequences. The highest-order (low significance) GSSs display limited facies shifts, both in the basin and at basin edge. More significant are the high-order genetic sequences, which comprise several highest-order GSSs and/or include abrupt facies shifts associated with coeval, or at least suspected, erosion surfaces at basin edge. The low-order sequences (highest significance) are made up of a suite of high-order sequences, the stacking pattern of which defines long-term RST and TST. They are bounded by the major MFS associated with severe condensation (for example, phosphogenesis in the Anti-Atlas). They include in their most regressive part (late RST or early TST) one or several important erosional surfaces such as shoreline ravinement unconformities, or glacial erosion surfaces in the upper Hirnantian in Morocco, which expand toward basinal areas. This approach is often not appropriate for maximum flooding intervals characterized by relatively deep depositional conditions, where facies shifts are poorly deciphered. Here, an
alternative, frequency-related, hierarchy is frequently applied7.
Base-level falls associated with glacial erosional surfaces are recognized on the
basis of: their basinward extent at regional scale63(Supplementary Fig. 1); the
subglacial/marginal ice fronts64. Maximum erosional depths are not considered to be a measure of the significance of a glacial surface. We are aware that such estimates reflect glacial extents rather than true ice-sheet volumes, but they do have significance when dealing with high- and low-order GSSs.
References
1. Jervey, M. T. in Sea Level Changes—An Integrated Approach Vol. 42 (eds Wilgus, C. K. et al.) 47–69 (Society of Economic Paleontologists and Mineralogists, Special Publication, 1988).
2. Catuneanu, O. et al. Towards the standardization of sequence stratigraphy. Earth-Sci. Rev. 92, 1–33 (2009).
3. Mountain, G. S. et al. in Continental Margin Sedimentation: From Sediment Transport to Sequence Stratigraph Vol. 37 (eds Nittrouer, C. A. et al.) 381–458 (International Association of Sedimentologists, Special Publication, Blackwells, 2007).
4. Sadler, P. M., Cooper, R. A. & Melchin, M. High-resolution, early Paleozoic (Ordovician-Silurian) time scales. GSA Bull. 121, 887–906 (2009).
5. Ghienne, J.-F., Le Heron, D., Moreau, J., Denis, M. & Deynoux, M. in Glacial Sedimentary Processes and Products Vol. 39 (eds Hambrey, M. et al.) 295–319 (International Association of Sedimentologists, Special Publication, Blackwells, 2007).
6. Le Heron, D. P. & Craig, J. First-order reconstructions of a Late Ordovician Saharan ice sheet. J. Geol. Soc. 165, 19–29 (2008).
7. Loi, A. et al. The Late Ordovician glacio-eustatic record from a high latitude storm-dominated shelf succession: the Bou Ingarf section (Anti-Atlas, Southern Morocco). Palaeogeogr. Palaeocl. Palaeoecol. 296, 332–358 (2010).
8. Lefebvre, V., Servais, T., Franc¸ois, L. & Averbuch, O. Did a Katian large igneous province trigger the Late Ordovician glaciation? A hypothesis tested with a carbon cycle model. Palaeogeogr. Palaeocl. Palaeoecol. 296, 309–319 (2010). 9. Herrmann, A. D., Patzkowsky, M. E. & Pollard, D. The impact of
paleogeography, pCO2, poleward ocean heat transport, and sea level change on global cooling during the Late Ordovician. Palaeogeogr. Palaeocl. Palaeoecol.
206,59–74 (2004).
10. Nardin, E. et al. Modeling the early Paleozoic long-term climatic trend. Geol. Soc. Am. Bull. 123, 1181–1192 (2011).
11. Kump, L. R. et al. A weathering hypothesis for glaciation at high atmospheric
pCO2during the Late Ordovician. Palaeogeogr. Palaeocl. Palaeoecol. 152, 173–
187 (1999).
12. Shaviv, N. J. & Veizer, J. Celestial driver of Phanerozoic climate? GSA Today
13/7,4–10 (2003).
13. Melchin, M. J., Mitchell, C. E., Holmden, C. & Sˇtorch, P. Environmental changes in the Late Ordovician–early Silurian: Review and new insights from black shales and nitrogen isotopes. GSA Bull. 125, 1635–1670 (2013).
14. Royer, D. L. CO2-forced climate thresholds during the Phanerozoic. Geochim.
Cosmochim. Acta 70, 5665–5675 (2006).
15. Vandenbroucke, T. R. A. et al. Polar front shift and atmospheric CO2during
the glacial maximum of the Early Paleozoic Ice-house. Proc. Natl Acad. Sci. USA 107, 14983–14986 (2010).
16. Sheehan, P. M. The Late Ordovician mass extinction. Annu. Rev. Earth Planet. Sci. 29, 331–364 (2001).
17. Brenchley, P. J. et al. High-resolution stable isotope stratigraphy of Upper Ordovician sequences: Constraints on the timing of bioevents and environmental changes associated with mass extinction and glaciation. Geol. Soc. Am. Bull. 115, 89–104 (2003).
18. Bergstro¨m, S. M., Saltzman, M. R. & Schmitz, B. First record of the Hirnantian
(Upper Ordovician) d13C excursion in the North American Midcontinent and
its regional implications. Geol. Mag. 143, 657–678 (2006).
19. Finnegan, S. et al. The magnitude and duration of Late Ordovician-Early Silurian glaciation. Science 331, 903–906 (2011).
20. Finnegan, S., Heim, N. A., Peters, S. E. & Fisher, W. W. Climate change and the selective signature of the Late Ordovician mass extinction. Proc. Natl Acad. Sci. USA 109, 6829–6834 (2012).
21. Harper, D. A. T., Hammarlund, E. U. & Rasmussen, C. M. Ø. End Ordovician extinctions: a coincidence of causes. Gondwana Res. 25, 1294–1307 (2013). 22. Holmden, C. et al. Nd isotope records of late Ordovician sea-level change—
Implications for glaciation frequency and global stratigraphic correlation. Palaeogeogr. Palaeocl. Palaeoecol. 386, 131–144 (2013).
23. Sutcliffe, O. E., Dowdeswell, J. A., Whittington, R. J., Theron, J. N. & Craig, J. Calibrating the Late Ordovician glaciation and mass extinction by the eccentricity cycles of the Earth’s orbit. Geology 23, 967–970 (2000). 24. Melchin, M. J. & Holmden, C. Carbon isotope chemostratigraphy in
Arctic Canada: Sea-level forcing of carbonate platform weathering and implications for Hirnantian global correlation. Palaeogeogr. Palaeocl. Palaeoecol. 234, 186–200 (2006).
25. Desrochers, A., Farley, C., Achab, A., Asselin, E. & Riva, J. F. A far-field record of the end Ordovician glaciation: the Ellis Bay Formation, Anticosti Island, Eastern Canada. Palaeogeogr. Palaeocl. Palaeoecol. 296, 248–263 (2010).
26. Delabroye, A. & Vecoli, M. The end-Ordovician glaciation and the Hirnantian Stage: a global review and questions about Late Ordovician event stratigraphy. Earth-Sci. Rev. 98, 269–282 (2010).
27. Destombes, J., Hollard, H. & Willefert, S. in Lower Palaeozoic of North-western and West Central Africa (ed. Holland, C. H.) 91–336 (John Wiley, 1985).
28. Le Heron, D. Late Ordovician glacial record of the Anti-Atlas, Morocco. Sediment. Geol. 201, 93–110 (2007).
29. Long, D. G. F. Tempestite frequency curves: a key to Late Ordovician and Early Silurian subsidence, sea-level change, and orbital forcing in the Anticosti foreland basin, Quebec, Canada. Can. J. Earth Sci. 44, 413–431 (2007).
30. Janszen, A., Spaak, M. & Moscariello, A. Effects of the substratum on the formation of glacial tunnel valleys: an example from the Middle Pleistocene of the southern North Sea Basin. Boreas 41, 629–643 (2012).
31. Vandenbroucke, T. R. A. et al. Ground-truthing Late Ordovician climate models using the paleobiogeography of graptolites. Palaeoceanography 24, PA4202 (2009).
32. Elrick, M. et al. Orbital-scale climate change and glacioeustasy during the early
Late Ordovician (pre-Hirnantian) determined from d18O values in marine
apatite. Geology 41, 775–778 (2013).
33. Gradstein, F. M. et al. The Geologic Time Scale (Elsevier, 2012).
34. Boulila, S. et al. On the origin of Cenozoic and Mesozoic ‘third-order’ eustatic sequences. Earth-Sci. Rev. 109, 94–112 (2011).
35. Hermann, A. D., Patzkowsky, M. E. & Pollard, D. Obliquity forcing with 8–12
times preindustrial levels of atmospheric pCO2during the Late Ordovician
glaciation. Geology 31, 485–488 (2003).
36. Waelbroeck, C. et al. Sea-level and deep water temperature changes derived from benthic foraminifera isotopic records. Quaternary Sci. Rev. 21, 295–305 (2002).
37. Armstrong, H. A. in Deep Time Perspectives on Climate Change (eds Williams, M., Haywood, A., Gregory, F. J. & Schmidt, D. N.) 101–121 (Special Publication of the Geological Society of London, The Micropalaeontological Society and Geological Society of London, London, 2007).
38. Zachos, J. C., Shackleton, N. J., Revenaugh, J. S., Pa¨like, H. & Flower, B. P. Climate response to orbital forcing across the Oligocene-Miocene Boundary. Science 292, 274–278 (2001).
39. Wade, B. S. & Pa¨like, H. Oligocene climate dynamics. Paleoceanography 19, PA4019 (2004).
40. Williams, G. E. Milankovitch-band cyclicity in bedded halite deposits contemporaneous with Late Ordovician-Early Silurian glaciation, Canning Basin, Western Australia. Earth Planet. Sci. Lett. 103, 143–155 (1991). 41. LaPorte, D. F. et al. Local and global perspectives on carbon and nitrogen
cycling during the Hirnantian glaciation. Palaeogeogr. Palaeocl. Palaeoecol. 276, 182–195 (2009).
42. Young, S., Saltzman, M. R., Ausich, W. I., Desrochers, A. & Kaljo, D. Did
changes in atmospheric CO2coincide with latest Ordovician glacial-interglacial
cycles? Palaeogeogr. Palaeocl. Palaeoecol. 296, 376–388 (2010).
43. Munnecke, A., Calner, M., Harper, D. A. T. & Servais, T. Ordovician and Silurian sea–water chemistry, sea level, and climate: a synopsis. Palaeogeogr. Palaeocl. Palaeoecol. 296, 389–413 (2010).
44. Holmden, C., Creaser, R. A., Muehlenbachs, K., Leslie, S. A. & Bergstro¨m, S. M. Isotopic evidence for geochemical decoupling between ancient epeiric seas and bordering oceans: implications for secular curves. Geology 26, 567–570 (1998).
45. Swart, P. & Kennedy, M. J. Does the global stratigraphic reproducibility of d13C
in Neoproterozoic carbonates require a marine origin? A plio-Pleistocene comparison. Geology 40, 87–90 (2012).
46. Fan, J., Peng, P. & Melchin, M. J. Carbon isotopes and event stratigraphy near the Ordovician–Silurian boundary, Yichang, South China. Palaeogeogr. Palaeocl. Palaeoecol. 276, 160–169 (2009).
47. Brenchley, P. J. et al. Bathymetric and isotopic evidence for a shortlived Late Ordovician glaciation in a greenhouse period. Geology 22, 295–298 (1994).
48. Jeppson, L. & Calner, M. The Silurian Mulde Event and a scenario for a secundo-secundo events. T. Roy. Soc. Edin. Earth Sci. 93, 135–154 (2003). 49. Cramer, B. S. & Saltzman, M. R. Fluctuations in epeiric sea carbonate
production during Silurian positive carbon isotope excursions: A review of proposed paleoceanographic models. Palaeogeogr. Palaeocl. Palaeoecol. 245, 37–45 (2007).
50. Rasmussen, C. M. O. & Harper, D. A. T. Did the amalgamation of continents drive the end Ordovician mass extinctions? Palaeogeogr. Palaeocl. Palaeoecol.
311,48–62.
51. Hammarlund, E. U. et al. A sulphidic driver for the end-Ordovician mass extinction. Earth Planet. Sci. Lett. 331, 128–139 (2012).
52. Delabroye, A. et al. Phytoplankton dynamics across the Ordovician/Silurian boundary at low palaeolatitudes: Correlations with carbon isotopic and glacial events. Palaeogeogr. Palaeocl. Palaeoecol. 312, 79–97 (2011).
53. Bergstro¨m, S. M., Lehner, O., Calner, M. & Joachimski, M. A new upper Middle Ordovician-Lower Silurian drillcore standart succession from Borenshult in
O¨ stergo¨tland, southern Sweden: 2. Significance of d13C chemostratigraphy. GFF
134,39–63 (2012).
54. Bourahrouh, A., Paris, F. & Elaouad-Debbaj, Z. Biostratigraphy, bodiversity and palaeoenvironments of the chitinozoans and associated palynomorphs from the Upper Ordovician of the Central Anti-Atlas, Morocco. Rev. Palaeobot. Palyno.
130,17–40 (2004).
55. Webby, B. D., Cooper, R. A., Bergstro¨m, S. M. & Paris, F. in The Great Ordovician Diversification Event (eds Webby, B. D., Paris, F., Droser, M. & Percival, I.) 41–47 (Columbia University Press, 2004).
56. Achab, A. & Paris, F. The Ordovician chitinozoan biodiversification and its leading factors. Palaeogeogr. Palaeocl. Palaeoecol. 245, 5–19 (2007). 57. Paris, F. et al. Palynological and palynofacies analysis of early Silurian shales
from borehole CDEG-2a in Dor el Gussa, eastern Murzuq Basin, Libya. Rev. Palaeobot. Palyno. 174, 1–26 (2012).
58. Paris, F. et al. Late Ordovician-earliest Silurian chitinozoans from the Qusaiba core hole (North Central Saudi Arabia) and relation to the Hirnantian glaciation. Rev. Palaeobot. Palyn. (in the press).
59. Achab, A., Asselin, E., Desrochers, A., Riva, J. F. & Farley, C. Chitinozoan biostratigraphy of a new Upper Ordovician stratigraphic framework for Anticosti Island, Canada. Geol. Soc. Am. Bull. 123, 186–205 (2011). 60. Achab, A., Asselin, E., Desrochers, A. & Riva, J. F. The end-Ordovician
chitinozoan zones of Anticosti Island, Que´bec: definition and stratigraphic position. Rev. Palaeobot. Palyno. 198, 92–109 (2013).
61. Galloway, W. E. Genetic stratigraphic sequences in basin analysis. I. Architecture and genesis of flooding-surface bounded depositional units. Amer. Assoc. Petr. Geol. Bull. 73, 125–142 (1989).
62. Embry, A. F. Practical sequence stratigraphy. Canadian Society of Petroleum Geologists. at www.cspg.org (2009).
63. Le Heron, D., Ghienne, J.-F., El Houicha, M., Khoukhi, Y. & Rubino, J.-L. Maximum extent of ice sheets in Morocco during the Late Ordovician glaciation. Palaeogeogr. Palaeocl. Palaeoecol. 245, 200–226 (2007). 64. Denis, M., Guiraud, M., Konate´, M. & Buoncristiani, J.-F. Subglacial
deformation and water-pressure cycles as a key for understanding ice stream dynamics: evidence from the Late Ordovician succession of the Djado Basin (Niger). Int. J. Earth Sci. 99, 1399–1425 (2010).
65. Burkhard, M., Caritg, S., Helg, U., Robert-Charrue, C. & Soulaimani, S. Tectonics of the Anti-Atlas of Morocco. C. R. Geosci. 338, 11–24 (2006).
Acknowledgements
J.-F.G. and T.R.A.V. acknowledge financial support from the French ‘Agence Nationale de la Recherche’ through grant ANR-12-BS06-0014 ‘SEQSTRAT-ICE’, the CNRS (action SYSTER) and the Regional Council of Nord-Pas de Calais (emergent projects action) in France. This is a contribution to IGCP 591 ‘The Early to Middle Palaeozoic Revolution’. A.D., J.V. and S.W. acknowledge support from NSERC.
Author contributions
J.-F.G., M.-P.D. and A.L. and A.D., C.F., S.W. and J.V. compiled and generated field data, from the Anti-Atlas and the Anticosti Island, respectively. T.R.A.V. and F.P. and A.A. and E.A. generated biostratigraphic data for the Anti-Atlas and the Anticosti Island, respectively. S.W. and J.V. performed isotopic data and ran the C-cycle model. J.-F.G., A.D., T.R.A.V. and J.V. designed the research and wrote the paper.
Additional information
Supplementary Informationaccompanies this paper at http://www.nature.com/
naturecommunications
Competing financial interests:The authors declare no competing financial interests.
Reprints and permissioninformation is available online at http://npg.nature.com/
reprintsandpermissions/
How to cite this article:Ghienne, J.-F. et al. A Cenozoic-style scenario for the
end-Ordovician glaciation. Nat. Commun. 5:4485 doi: 10.1038/ncomms5485 (2014). This work is licensed under a Creative Commons Attribution-NonCommercial-NoDerivs 4.0 International License. The images or other third party material in this article are included in the article’s Creative Commons license, unless indicated otherwise in the credit line; if the material is not included under the Creative Commons license, users will need to obtain permission from the license holder to reproduce the material. To view a copy of this license, visit http:// creativecommons.org/licenses/by-nc-nd/4.0/