HAL Id: hal-01116237
https://hal-brgm.archives-ouvertes.fr/hal-01116237v2
Submitted on 3 Mar 2015
HAL is a multi-disciplinary open access
archive for the deposit and dissemination of sci-entific research documents, whether they are pub-lished or not. The documents may come from teaching and research institutions in France or
L’archive ouverte pluridisciplinaire HAL, est destinée au dépôt et à la diffusion de documents scientifiques de niveau recherche, publiés ou non, émanant des établissements d’enseignement et de recherche français ou étrangers, des laboratoires
Influence of impurities (nitrogen and methane) on the
CO 2 storage capacity as sediment-hosted gas hydrates –
Application in the area of the Celtic Sea and the Bay of
Biscay
André Burnol, Isabelle Thinon, Livio Ruffine, Jean-Michel Herri
To cite this version:
André Burnol, Isabelle Thinon, Livio Ruffine, Jean-Michel Herri. Influence of impurities (nitrogen and methane) on the CO 2 storage capacity as sediment-hosted gas hydrates – Application in the area of the Celtic Sea and the Bay of Biscay. International Journal of Greenhouse Gas Control, Elsevier, 2015, 35, pp.96-109. �10.1016/j.ijggc.2015.01.018�. �hal-01116237v2�
Influence of impurities (nitrogen and methane) on the CO
2storage
capacity as sediment-hosted gas hydrates – Application in the area
of the Celtic Sea and the Bay of Biscay
A. Burnol1,*, I. Thinon1, L. Ruffine2, J-M. Herri3
[1] Bureau de Recherches Géologiques et Minières (BRGM), 3 avenue Claude Guillemin, BP 36009, 45060 Orléans, France.
[2] IFREMER, Centre de Brest, Département de Géosciences Marines, 29280 Plouzané, France
[3] Ecole Nationale Supérieure des Mines de Saint-Etienne, Centre SPIN, 158 Cours Fauriel, 42023 Saint-Etienne
*
Correspondence to: A. Burnol (a.burnol@brgm.fr), Tel.: +33 238 644 647
Abstract
Deep saline aquifers are the most important potential storage reservoirs for CO2 under supercritical conditions. Another option is the trapping of CO2 in deep-sea sediments at low temperature, either in liquid state or as gas hydrates. The Negative Buoyancy Zone (NBZ) and the Gas Hydrate Stability Zone (GHSZ) are used to calculate the theoretical storage volume. It depends essentially on the geothermal gradient and on the quality of the injected CO2. A sensitivity analysis shows that the storage volume in the Celtic Sea and the Bay of Biscay area is one order of magnitude lower if the injected fluid contains impurities like nitrogen or methane. Overall, the storage capacity in the French Exclusive Economic Zone (EEZ) exceeds 100 years of storage of the current French CO2 emissions from large point sources. The conservative estimate of the EEZ storage capacity is found to be higher than in the deep saline aquifers of the Paris Basin. Moreover, the CO2 storage capacity in this area is doubled when considering the zone beyond 200 miles from the shores. The implications of these results are potentially important for the long-term deployment strategy for CO2 storage in France and in Western Europe.
Keywords: CO2 storage capacity, Impurities, Gas hydrates, Deep offshore, Marine sediments, French EEZ
NOMENCLATURE
Cc Capacity coefficient
CO2-N Multi-component mixture (N=96, 97, 100)
DOTPX Multi-component mixture density (GERG-2008) [kg m-3] E Storage efficiency factor [-]
HF Heat Flux [W m-2] 2
CO
M Onshore storage capacity [kg]
N -CO2
M Deep offshore storage capacity (N=96 ,97, 100) [kg] N Type of mixture (N=96, 97, 100) [-]
p Seawater pressure (Saunder's formula) [dbar]
PCO2-N Equilibrium Pressure of CO2-N hydrate (N=96, 97, 100) [MPa] RHO80 Seawater density (EOS-80) [kg m-3]
S Sea salinity (fixed to 34.92) [-] H
S Gas hydrate saturation level [-] L
CO
S
2 Pure liquid CO2 saturation level [-] T Sediment Temperature [°C]
dT/dz Geothermal gradient [°C m-1] TC Thermal Conductivity [W m-1 K-1] V Onshore theoretical porous volume [m3]
VN Theoretical storage volume (N=96, 97, 100) [m3]
XN Mixture composition in mole fractions (N=96, 97, 100) [-] z Depth below seafloor (z>0) [mbsf]
N Density difference with seawater (N=96, 97, 100) [kg m-3]
N Equilibrium pressure difference of CO2-N hydrate (N=96, 97, 100) [MPa]
SC CO2
Density of supercritical CO2 [kg m-3]
L CO 2
Density of pure liquid CO2 [kg m-3]
N CO 2
Density of CO2 in CO2-N hydrate (N=96, 97) [kg m-3]
1. Introduction
The capture of CO2 emissions from large point sources followed by its storage in deep geological reservoirs (CCS) is considered as an option in the portfolio of actions to mitigate the current global warming (Metz et al., 2005). In the first injection tests (e.g. Lacq since 2010, Sleipner, North Sea since 1996 and Snøhvit, Sea of Barents since 2009), CO2 is injected under supercritical conditions (high pressure and high temperature). Because the density of supercritical CO2 is lower than that of pore water, the storage safety depends on the impermeability of the cap rock. Conversely, there is no need of such a cap rock when considering the case of a deep offshore CO2 storage in deep-sea sediments as the storage integrity is indeed insured by the difference of density: beyond a certain depth, the injected
fluid is denser than the seawater and is gravitationally trapped in the deep-sea sediments (House et al., 2006; Levine et al., 2007; Goldberg et al., 2008; Goldberg and Slagle, 2009; Slagle and Goldberg, 2011; Eccles and Pratson, 2012). The thickness of this Negative Buoyancy Zone (NBZ) depends on the local geothermal gradient. In addition, the CO2 can be trapped in gas hydrates, which can further reduce the permeability by clogging the porous volume (House et al., 2006; Tohidi et al., 2010). Due to the presence of both gravitational and gas hydrate barriers (“self-sealing process”), the long-term safety of the storage option at low temperature is a priori higher than that of the storage option at high temperature.
Submarine venting of natural liquid CO2 has been previously observed only at a few submarine volcanoes (Lupton et al., 2006; de Beer et al., 2013). The study in laboratory of the dynamics of the gas hydrates in sedimentary medium (namely formation, accumulation and destabilization processes) is still at its beginnings. Thus, the technology for a CO2 storage at low-temperature is not mature yet and there is a need for a precise description of the physico-chemical behavior of the injected fluid with respect to the geological matrix, particularly in the Gas Hydrate Stability Zone (GHSZ). However, the technological issues could be overcome in the medium-long term owing to the development of the hydrocarbon industry: (1) oil and gas companies are targeting very deep-offshore drilling for hydrocarbon extraction in the near future (beyond 3000 m water depth); (2) the injection of CO2 in its liquid form is under investigations and would reduce the costs of conditioning in a hostile marine environment (Vilarrasa et al., 2013); (3) the potential formation of CO2 hydrate in the injection well or in the vicinity of the borehole may be avoided by implementing a heating jacket on flexible risers similar to that used for the deep-offshore gas transport.
From an economic point of view, such a deep offshore storage would increase the costs of both transport (due to longer distances, see Figure 1) and injection (due to the hostile marine environment). For instance, the maritime transport would be preferred because it is cheaper than offshore pipelines for distance longer than 500 km (Decarre et al., 2010). These higher costs have been recently estimated by (Eccles and Pratson, 2013): the comparison in the specific case of the United States shows that deep offshore storage may be three times more expensive than onshore storage. However, a comprehensive comparative study should consider all the associated costs due to potential usage conflicts (e.g. with geothermal exploitations), the applicable regulations related to social acceptability and finally the
case, CO2 trapping at low temperature could be economically viable in hydrate-bearing sediments if it is coupled with the production of natural gas as an energy resource. On May 2012, the US DOE (Department of Energy) and COP oil company (ConocoPhillips) completed the first methane-hydrate production test coupled with sequestration of CO2 on a pilot site in Alaska. The primary objective was to demonstrate the feasibility of a CO2 injection into methane hydrate-bearing sediments and to assess the CO2-CH4 exchange, together with the storage integrity. The principle relies on the difference between the hydrate stability fields of the two hydrate formers methane and carbon dioxide in the low pressure range (Kvamme et al., 2009). One of the main advantages of this method consists on avoiding the geomechanical destabilization of the sedimentary layer as it may happen for the alternative methods (e.g. depressurization or thermal stimulation).
The purity of the injected fluid will depend on the emission source and the capture process (Table 1). The density of the injected fluid decreases when the percentage of common impurities in the injected fluid (e.g. N2, CH4, CO, H2S) increases. Moreover, the equilibrium temperature of a mixed gas hydrate, an ice-like solid phase which traps CO2 and associated impurities deviates from the equilibrium temperature of pure CO2 hydrate (Sloan and Koh, 2007; Chapoy et al., 2015). This work describes the influence of the CO2 quality on the storage capacity of a deep offshore site.
2. Geological setting in the studied area and in the Paris Basin
2.1. Geological setting in the studied area
The sediments in the Biscay Abyssal Plain are composed of sediments with a variable origin (continental, marine), variable composition and grain size (carbonate, clastic, organic or mixed) and variable distribution (lenticular or stratified). These parameters depend on the distance from source of supply, the morphology of the deposits area, the geodynamic and climatic events. The post-rift sedimentary cover of Biscay Abyssal Plain (Upper Cretaceous-today), are located below 4000 m water depth. Its thickness can reach more than 7 km. It covers a thinned continental crust with the pre-rift and syn-rift sediments, directly a transitional crust or an oceanic crust (Thinon, 1999; Thinon et al., 2003). The superficial part of the post-rift sedimentary cover, the most recent sediment, consists mainly of detrital deposits in deep-sea fans whose construction and spatiotemporal evolution are related to
changes in sea level during the last climatic cycles. The deep-sea fans were deposited at the foot of the continental slope from the Early Miocene, and progressively extended toward the middle of the Bay of Biscay during the Plio-Quaternary (Droz et al., 1999; Auffret et al., 2000). Several deep fans like the Celtic and Armorican turbiditic systems are produced during the last glacial maximum and influenced by the melting of Britain and Ireland glaciers and dumps from the „Fleuve Manche‟ (Zaragosi et al., 2001; Bourillet et al., 2003). The distribution of the latest 30 ky sediments have been affected by the glacial oscillations of Britain and Ireland glaciers and climate changes (Toucanne et al., 2008; Toucanne et al., 2012). These fans consist of sedimentary lobes (lenticular deposits), channels, coarse and heterogeneous fills within the channels.
The Celtic Deep-Sea Fan located in the northwestern part of the Bay of Biscay has a surface area of more than 30,000 km2 and is a mature mud/sand-rich submarine fan (Zaragosi et al., 2000). The knowledge of the heterogeneities in the Bay of Biscay is mainly supplied by the reflection-seismic data which show the architecture of sedimentary systems in depth and by geological sampling which reveal the sediment composition. If the existing seismic network can today offer a low resolution image of the sedimentary architecture, the existing geological data are insufficient to determine with a good accuracy the composition for each sedimentary layer in the Biscay Abyssal Plain. In the northern part of the abyssal plain, some samplings by sediment corer give the lithological composition of first 40 m deep below seabed (Zaragosi et al., 2000; Toucanne et al., 2008; Toucanne et al., 2010; Toucanne et al., 2012). The lithological knowledge of the entire post-rift sedimentary cover is based only on the Deep Sea Drilling Project (DSDP) boreholes. However, this information must be taken cautiously: DSDP boreholes, located on high reliefs, do not sample the first seventies meters of sediments and have several important hiatus. Between 70 and 300 m, there are calcareous muds and chalks with nano-fossils and in depth there are some limestones or calcareous mudstones (Montadert et al., 1979) (see clay fraction in Supporting Information, Figure 3SI).
Two adjacent zones in the studied area are investigated in this work: the French Exclusive Economic Zone (called EEZ) using the DSDP Leg 48 site 400 and a zone beyond 200 miles from the shores (called 200M) using the DSDP Leg 80 site 550 (Figure 1). The latter was adopted by the UN Commission on the Limits of the Continental Shelf (CLCS) on 24 March 2009 in regard to the joint submission made by France, Ireland, Spain and the United
2.2. Onshore CO2 storage capacity estimate in the Paris Basin
The Paris Basin is the largest onshore sedimentary basin in France: it is a large, nearly circular sedimentary basin which occupies a vast part of Northern France (110 000 km2) and extends northward below the English Channel (Lopez et al., 2010). The central part of the Basin, where the subsidence was the greatest, is filled with about 3000 m of sediments. The geothermal potential of the reservoirs of the Paris Basin has been exploited for 40 years. This exploitation history, along with the data from various oil exploration wells, provided a better geological characterization of the lithostratigraphic units exhibiting aquifer properties. Among the four main aquifers in the Basin, the mid-Jurassic (Dogger) carbonate rocks and the underlying Triassic aquifers were identified as two promising storage targets in the Paris area where the major industrial CO2 sources are located (Figure 1). The Dogger aquifer is recharged along the eastern border of the Basin where the formation outcrops and the major flow is directed toward the discharge area on the seafloor of the English Channel, in the north-western part of the Basin. Some of CO2 storage potential targets correspond to the target layers for geothermal exploitation.
In the deep saline aquifers of the Paris Basin, the effective CO2 storage capacity called
2 CO M is the product of the theoretical porous volume (V), the average density of supercritical CO2 in each layer ( SC
CO2
) and the storage efficiency factor (E):
E V MCO COSC 2 2 with c SC CO C S E 2 (1) where SC CO S
2 is the supercritical CO2 saturation level, CC the capacity coefficient. Cc is a site-specific scaling factor and is determined by various methods including expert advice and analogy with oil exploration data (Bachu et al., 2007). A CO2 average density of 0.48 g/cm3 and 0.7 g/cm3 has been proposed by the French Geological Survey (BRGM) in the Dogger layer and in the Trias layer, respectively. Supposing a high value of the storage efficiency factor of 6%, the total CO2 storage capacity in deep saline aquifers of the Paris Basin has been estimated to 27.1 Gt in the European FP6 EU GeoCapacity project (Vangkilde-Pedersen et al., 2009). Monte Carlo simulations of the USDOE Capacity and Fairways Subgroup give a value of E between 1 and 4% of the bulk volume of a deep saline aquifer for a 15 to 85% confidence range, with an average of 2.4% for 50% confidence (Bachu, , 2008). Using this storage efficiency factor of 2.4%, the Paris Basin storage capacity has been estimated to 29.1 Gt in the METSOR II project of BRGM (Leynet and Ha-Duong, 2010). A more conservative
estimate of 7.9 Gt has been proposed in the GeoCapacity project using a storage efficiency factor of 2% for open aquifers, 1% for semi-open aquifer and 0.1% for closed aquifers (Vangkilde-Pedersen et al., 2009). This estimate probably gives the most realistic picture of the onshore storage capacity in the Paris Basin. The purpose is to compare this value to a conservative estimate of the deep offshore storage capacity in the French EEZ.
3. Input data and modeling tools
3.1. CO2 stream composition (CO2-96, CO2-97, CO2-100)
The nature and the quantity of the impurities in the CO2 stream depend on the emission source (e.g. gas/coal-fired power plant) and also on the capture process (e.g. pre/post/oxy-fuel-combustion). A high quantity of non-condensable gases (N2, CH4, H2, O2, Ar, CO) may decrease the capture cost but may also increase the compression and transport costs. On the other hand, the presence of H2S may lead to the corrosion of the pipeline and increase the environmental risk. The Dynamis project (integrated FP6 European project) recommended therefore technical limits for the impurities in the CO2 stream: the total volume fraction for all non-condensable gases together should be set to a maximum of 4% and H2S volume fraction to a maximum of 0.02% (de Visser et al., 2008).
It is assumed in this work that the three-phase equilibrium will not be significantly affected by very low concentrations of potential traces (such as SOx, NOx). Other impurities like H2 and H2S are often associated in the CO2 streams coming from coal-fired plants but they are not studied in this work because of the lack of data on H2S hydrates (Ward et al., 2014). Only two simplified stream compositions have been considered here and compared to the pure CO2 case (called CO2-100): the first stream (called CO2-96) is simulated as a binary system CO2-N2 and the second stream (called CO2-97) as a ternary system CO2-CH4-N2 (Table 1).
CO2-96 is representative of a medium purification level using the oxyfuel capture process in gas-fired plants and contains 4% (mole fraction) impurities with less than 0.5% of O2 (Yan et al., 2009) (Table 1). All the oxygen should be consumed quickly after the injection due the anoxic conditions in deep-sea sediments and its relative high solubility: the CO2-96 case is therefore simplified and simulated only as a binary mixture CO2-N2. The second stream
CO2-capture process and contains 3% of impurities with about 1% of N2 and less than 2% of CH4 (Table 1) (Metz et al., 2005). Submarine venting of natural liquid CO2 has been recently observed and it has been shown that CO2-saturated seawater should inhibit sulfate reduction and anaerobic methane oxidation (AOM) in deep-sea sediments (de Beer et al., 2013). Therefore, it is supposed here that methane is not oxidized in the CO2-97 case.
3.2. Sediment temperature using a constant Heat Flux
The calculation of the vertical sediment temperature is based on the application of a simplified form of Fourier‟s first law for the vertical heat transport:
dz d z T TC HF (2)
Where HF is the Heat Flux (W m-2), TC the thermal conductivity (W m-1 K-1), dT/dz the geothermal gradient (K m-1) and z is the depth below seafloor in m (z > 0). The complete physical description can be found in the recent review article of Fisher and Harris (2010). It is assumed here that the heat flux through the marine sediment in the studied area is purely conductive and occurs at steady state, i.e. the heat flux is constant along a vertical profile (Pribnow et al., 2000). Assuming a linear change of thermal conductivity TC with the depth z, the integration of Eq. (2) leads to the sediment temperature T (°C):
1000 TC z α β z (3) α ) TC( ln β HF 1000 BWT T z z (4)
Where is the surface thermal conductivity (W/m/K), the variation of TC with depth (mW/m2/K) and BWT the bottom water temperature (°C). () is equal to (1.175 W/m/K, 1.36 mW/m2/K) in EEZ and (1.1 W/m/K, 1.81 mW/m2/K) in 200M, respectively. BWT along the continental rise and the abyssal plain is almost constant in the studied area and the mean value is about 2.6 °C (Foucher and Sibuet, 1980; Foucher et al., 1985) (Table 2). As given in the Global Heat Flow Database (http://www.heatflow.und.edu), the heat flux (HF) varies in the studied area between 33 mW/m2 (“low HF case”) and 60 mW/m2 (“high HF case”), with a medium value fixed to 46.5 mW/m2 (“medium HF case”) (Table 2). The thermal conductivity (TC) at Leg 80 Site 550 increases linearly with depth (Figure 2). The linear relation between
the porosity and the thermal conductivity at site 550 is used to calculate TC from the porosity at site 440.
3.3. Thickness of the Negative Buoyancy Zone (NBZ) using GERG-2008
The Negative Buoyancy Zone (NBZ) is determined by calculating the density difference between the seawater and the CO2-rich mixture (CO2-N with N=96, 97, 100):
, ( ), ( ) DOTPX(T(z) 273.15 ( ( ) 10.1325)/1 00 X ) 80 RHO ) ( N N z S T z p z , p z , (5)
Where RHO80 and DOTPX are the seawater and CO2-N stream density (kg/m3), S the salinity, T the sediment temperature (°C), p the pressure relative to a standard atmosphere (10.1325 dbar), XN the total composition of the liquid mixture in mole fraction (Table 1). The seawater density is calculated by the 1980 International Equation of State (EOS-80) (Millero et al., 1981; Fofonoff and Millard, 1983). The salinity is supposed almost constant along the vertical profile and fixed to S=34.92 in the studied zone. The relative pressure p is estimated from the depth z and the latitude using Saunder's formula (Saunders, 1981).
The density DOTPX of the liquid mixture is calculated with the GERG-2008 equation of state (EoS) and depends on the temperature in Kelvin, the absolute pressure in MPa and the mole fractions XN in the liquid mixture. The standard mixing rules implemented in GERG EoS correspond to Lorentz–Berthelot mixing rules that have been modified with focus on natural gases and other mixtures (Kunz et al., 2007).
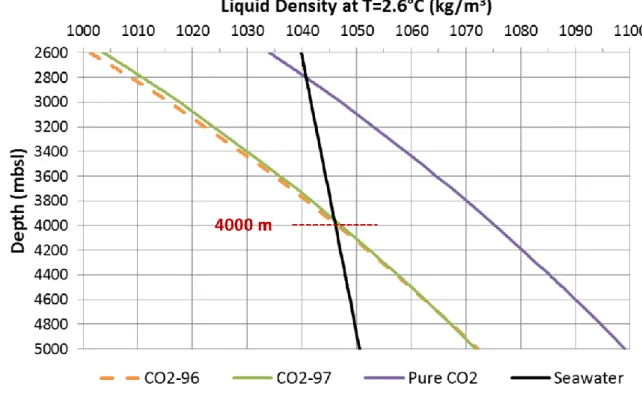
The bisection method is used to calculate the critical depth z of Eq. (5) for which (z) kg/m3 (Figure 3). The NBZ lies between the seabed and this critical depth. As shown in Figure 4, if the seafloor depth is higher than 4000 m, both liquid mixtures (CO2-96 and CO2-97) are gravitationally trapped in deep-sea sediments.
3.4. Thickness of the Gas Hydrate Stability Zone (GHSZ) using CSMGem
The Gas Hydrate Stability Zone (GHSZ) is determined by calculating the difference between the gas hydrate equilibrium pressure PCO2-N depending on the sediment temperature T (see section 3.2) and the porewater pressure p given by the Saunder's formula (Saunders, 1981):
( 10.1325)/1 00
N
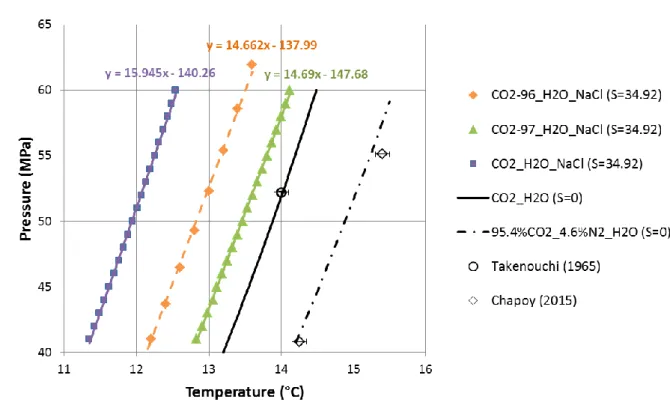
For each type of mixture (N=96, 97, 100), the equilibrium points (T, PCO2-N) in NaCl water (S=34.92) calculated by the CSMGem code Version 1.10 (January 1, 2007) (Ballard and Sloan Jr, 2002; Sloan and Koh, 2007) are fitted by a linear approximation in the high pressure range (40-60 MPa): ) ( b a ) ( N N N -CO2 z T z P (7)
Where aN is a pressure (MPa) and bN is a variation of pressure with temperature (MPa K-1). The parameters (aN, bN) are (-137.99, 14.662), (-147.68, 14.69) and (-140.26, 15.945) for N=96, N=97 and N=100, respectively (Figure 5).
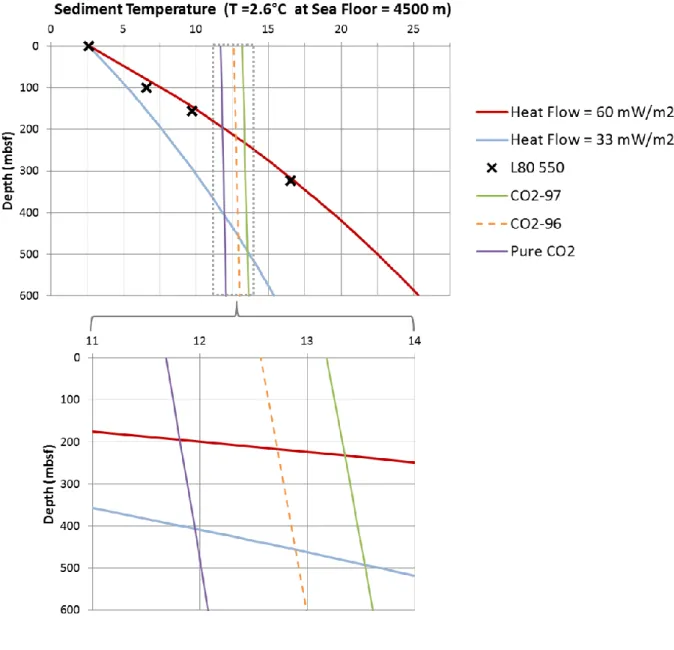
The bisection method is then used to calculate the critical depth z of Eq. (6) for which (z) MPa (Figure 3). The GHSZ lies between the seabed and this critical depth. An example of GHSZ below a seafloor of 4500 m is given for the high and low Heat Flow in Figure 6. It is assumed in this work that the host-sediment physical properties do not affect significantly the equilibrium state of the bulk phase (see discussion in section 5.3).
3.5. Storage surfaces using three safety criteria and GMT
As the seafloor depth is less than 5000 m in the studied area, the bottom of the GHSZ is less than 600 mbsf for both cases N=96, 97 (Figure 7). In order to avoid the risk of formation of gas hydrate at the outlet of the injection pipe, the total sediment thickness should be larger than 600 m in the CO2 storage zone. Three different safety criteria are therefore used to define the surface of the CO2 storage in the studied area: (1) a seafloor depth higher than 4000 m to insure that the density of the injected fluid is higher than the seawater density (Figure 4); (2) a seafloor depth gradient lower than 0.01 to avoid the risk of slumps coming from the continental slope; (3) a sediment thickness higher than 600 m. GMT, the Generic Mapping Tool (Wessel and Smith, 1998), has been used to apply these three criteria and to calculate the storage surfaces in both zones (EEZ and 200M). Further details about the method can be found in Appendix A.
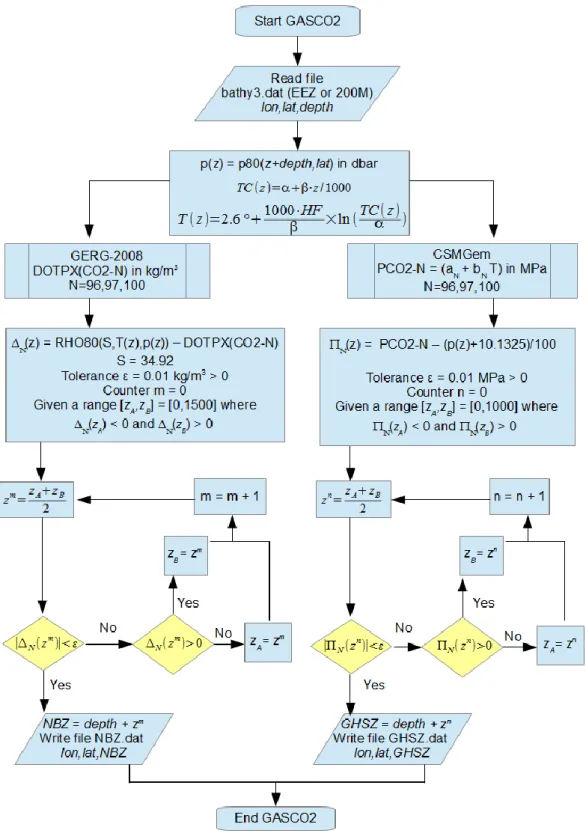
3.6. Theoretical storage volumes using GASCO2 and GMT
A new fortran tool (called GASCO2) has been developed to calculate for each case the thickness of NBZ and GHSZ using GERG-2008 and CSMGem, respectively (Figure 3). If the thickness of NBZ is larger than the thickness of the GHSZ, the injected CO2(l) is expected to percolate downwards to the bottom of the NBZ and will accumulate on either side of the
neutral buoyancy level, with the depth of CO2 above the level matching the depth below it (Levine et al., 2007). As shown in Figure 7, it is indeed the case for pure CO2 but generally not the case for CO2-96 or CO2-97.
In the pure CO2 case (N=100), we supposed here that the CO2 accumulation cannot exceed twice the depth difference between the neutral buoyancy level and the hydrate formation level as supported by modeling calculations of (Qanbari et al., 2012). This volume which may host only liquid CO2 is a conservative estimate of the total available volume (GHSZ is not taken into account in our calculation).
In the case with impurities (N=96, 97), the injected stream will generally flow upwards into the GHSZ and will form mixed gas hydrates, except in the low HF case with the highest seafloor depth (Figure 7). The gas hydrate formation results in the decrease in porosity and permeability, hence in the limitation of the upward migration of residual flow (supposing no overpressure or fracturing). The result on the long time scale (e.g. 1000 years) will depend on the balance between two major processes: the hydrate formation kinetics and the decrease of permeability. The hydrate formation kinetics will tend to resist the buoyancy-driven migration. As this migration is much lower just below the neutral buoyancy level than at the hydrate formation level, the volume above the neutral buoyancy level is very difficult to access (only by diffusion in the very long term), as supported by modeling calculations of (Qanbari et al., 2012). We supposed here that the theoretical storage volume is the porous volume in the sub-domain where NBZ is included in GHSZ and lies between the GHSZ‟s lower limit (bottom boundary) and the NBZ‟s lower limit (top boundary) (Figure 7). This volume which may host mainly gas hydrates is also a conservative estimate of the total available volume (NBZ and residual liquid along migration pathway beneath GHSZ are not taken into account in our calculation).
Both theoretical storage volumes that may host gas hydrates for N=96/97 or pure liquid CO2 for N=100 are calculated by GMT. Further details about the method can be found in Appendix A.
4. Modeling results
4.1. Limits of the storage zones in the studied area
Three safety criteria described in the section 3.5 are applied to define the limits of the CO2 storage potential in the French Exclusive Economic Zone (called EEZ-CO2) and in the zone beyond 200 miles from the shores (called 200M-CO2). In the French EEZ abyssal plain, the sediment thickness is always higher than 600 m (between ~3000 m and ~8000 m as shown in Figure 8). The inner limit of both storage zones lies within the continental rise between the 4000-mbsl and the 4500-mbsl isobaths (Figure 9). Due to a seafloor depth below 4000-mbsl, the Armoricain Seamount and the Trevelyan Escarpment are both excluded from the storage zone (Figure 9). Due to a seabed slope above 0.01, the Gascogne Knoll is also excluded. Both surfaces calculated by GMT are of the same order, 42 120 km2 and 41 083 km2 for EEZ-CO2 and 200M-CO2, respectively.
4.2. Theoretical storage volumes for CO2 in the liquid state or as gas
hydrates
By definition, the theoretical storage volume is the total physical porous volume that may host gas hydrates in both cases CO2-N (N=96, 97) or liquid CO2 in the pure CO2 case (section 3.6). It assumes that the entire volume is accessible and utilized to its full capacity to store gas hydrate in the pore space. It represents therefore a maximum upper limit to a storage volume estimate (and therefore unrealistic to calculate the storage capacity, see section 5.4).
In the case with impurities (N=96, 97), the storage surface is lower in the low HF case than in the high HF case because only the sub-domain where NBZ is included in GHSZ is taken into account (section 3.6 and Figure 7). Conversely, the mean thickness (i.e. the ratio of the calculated volume and the surface) is higher in the low HF case than in the high HF. As the sediment porosity is inversely proportional to the sediment depth (Figure 2), the mean porosity is lower in the low HF case than in the high HF case. The theoretical storage volume which is the product of the three parameters (surface, thickness and porosity) is therefore not a monotonic function of the heat flux and needs to be determined through calculations in both zones (EEZ and 200M). In the French EEZ, the estimate of the theoretical storage volume can vary as much as 50% (between 1600 km3 and 2400 km3) and the maximum is obtained with a
medium HF (46.5 mW/m2) (Table 3). In 200M, the theoretical storage volumes are almost identical to those calculated in EEZ in all sensitivity cases (Table 4).
In the pure CO2 case (N=100), the theoretical storage volume that may host liquid CO2 is one order of magnitude higher than the storage volume as gas hydrates in the case with impurities (22°627 km3 instead of 1982-2400 km3) (Table 3).
5. Discussion
5.1. Influence of heat flux and impurities on the theoretical storage volume
Using the heat flow (HF) of 60 mW m-2, the model temperature from Eq. (3) fits quite well with the in situ measurements at site L80 550 (Figure 6). On the global scale of the Earth‟s surface, there is a global trend in the data of decreasing mean heat flow with increasing age (Davies and Davies, 2010). The recently published Structural map of the Atlantic Ocean (Miles et al., 2012) in this area highlights that the mean age is higher in EEZ than in 200M, the mean HF is therefore likely lower in EEZ than in 200M. A large uncertainty still remains on the local HF variations in the studied area: the observed values vary by a factor of two (between 33 and 60 mW m-2) (see Table 2). In the case with impurities (N=96, 97), the maximum storage volume found with a medium HF is still one order of magnitude lower than the storage volume in the pure CO2 case (Table 3). This high volume difference is explained by the storage thickness difference (1343 m instead of ~100m) (section 3.6).
A comparison with the pure CO2 case in NaCl water (Figure 5) shows that nitrogen and methane act as promoters in the high pressure range (between 40 MPa and 60 MPa), although both impurities act as inhibitors at lower pressure (below 5 MPa) as observed recently by Chapoy et al. (2015). This comparison shows also that the mole fraction of CH4 has a higher impact than the same mole fraction of N2 on the mixed gas hydrate dissociation temperature, therefore on the storage volume (Table 3). The comparison between both cases (N=96, 97) highlights that the influence of impurities like nitrogen and methane on the theoretical storage volume is of the same order than that of local heat flux variation (ca. 20%, Table 3).
Although the French EEZ storage surface (42 120 km2) is two times lower than the storage surface in Paris Basin (92 568 km2, Figure 1) (Vangkilde-Pedersen et al., 2009), the French
storage volume estimate (722 km3) (Table 4). This result is mainly explained by a porosity of sediments four times higher in the deep offshore case than in the onshore case (40-60% instead of 10-15%).
5.2. About the uncertainty on the NBZ thickness
The seawater density is calculated with the EOS-80 formulation (Millero et al., 1981). The EOS-80 formulation is easy to use because it does not depend on the concentrations of individual ions unlike the recent TEOS-10 formulation (IOC et al., 2010), while providing fairly accurate results: the uncertainty on seawater amounts to 0.05 kg/m3 over the oceanic pressure range (Fofonoff, 1985). The uncertainty of this first term of Eq. (4) is anyway lower than the uncertainty of the liquid mixture density DOTPX.
The GERG-2008 equation of state uncertainty amounts to (0.2 − 0.5)% inside of the extended range of validity (P ≤ 70 MPa) for many multi-component mixtures (Kunz and Wagner, 2012). A higher quality between (0.1 − 0.3)% can be achieved for some binary mixtures, such as CO2-N2 and CO2-CH4, thanks to an additional departure function using extensive sets of available experimental data (Kunz and Wagner, 2012). The difference between the experimental density and the predicted density with GERG-2008 is indeed lower than 0.1% for the binary mixture CO2-N2 at a pressure up to 48 MPa (Brugge et al., 1997) and for CO2 -CH4 at a pressure up to 42 MPa (Hwang et al., 1997) (Supporting Information, Figure 1SI). In order to cross-validate the GERG-2008 density function, multi-component CO2-rich mixtures issued from the different capture processes should be further experimentally investigated at deep-offshore pressure conditions (40-60 MPa).
5.3. About the uncertainty on the GHSZ thickness
The accuracy of CSMGem code has been first verified for pure CO2, N2 and CH4 hydrates three-phase equilibrium in the deep offshore high pressure range (40-60 MPa). Pure CO2 and N2 models in pure water fit well the experimental data with an average deviation in temperature of 0.18 K and 0.1 K, respectively (Supporting Information, Figure 2SI). The gas hydrate equilibrium is at first order controlled by the dominating CO2 component and secondly affected by both impurities, N2 and CH4. The CO2-rich mixture model with 4.6 mol% N2 in pure water fits also well recent experimental data of Chapoy et al. (2015) with an average deviation in temperature of 0.1 K (Figure 5 and Figure 2SI). NaCl water (S=34.92)
has been chosen as a simplified seawater model (Figure 5). The pure CH4 model with CSMGem in different NaCl water fits relatively well the experimental data with an average deviation in temperature of 0.28 K (Figure 2SI). All the equilibrium points of CO2-N hydrates are calculated by CSMGem with a solid structure of type I (SI) and without a gas phase for methane and nitrogen.
However, the CSMGem results are a priori only valid for the “bulk” equilibrium, i.e. without a solid matrix. The sediment properties can strongly affect key parameters like the hydrate saturation level, the distribution pattern, and possibly the hydrate stability field (Waite et al., 2009; Santamarina and Ruppel, 2010). The effect of pore size and shape on the equilibrium temperature has been investigated in the literature, either experimentally (Anderson et al., 2003; Uchida et al., 2004; Dai et al., 2012) or theoretically (Clennell et al., 1999; Henry et al., 1999; Klauda and Sandler, 2001; Mohammadi et al., 2012). The capillary forces are significant only for very small pore diameters (i.e. below 30 nm) with a shift of the hydrate stability field to higher pressure with decreasing pore diameters (Anderson et al., 2003). Therefore, the pore size distribution of the sediment has to be estimated in order to fairly predict the hydrate stability field. Besides the pore diameter, the size and nature of the particles constituting the geologic matrix play also an important role in both the hydrate saturation level and the hydrate habit (Lu et al., 2011; Prasad et al., 2012). High hydrate saturation level (up to 100%) is found in coarse-grain sediment like sandy sediment. Those are the main type of reservoirs targeted for a hydrate accumulation. Lower hydrate saturation levels were obtained with particles smaller than 50 μm (Lu et al., 2011). In rich-clay sediment, the hydrate saturation level is even lower, e.g. 10% in a nannofossil-rich claystone (Lu and Matsumoto, 2002). The hydrate formation involves the creation of cracks and faults within the matrix where they can accumulate as vein-filling hydrate or nodules. Therefore, large uncertainties remain with regard to the effective storage capacity due to the lack of knowledge on deep-sea sediment composition and heterogeneities in the studied zone.
The phase diagram of multi-component CO2-rich mixtures issued from the different capture processes should be further experimentally investigated with different types of marine sediments and at deep-offshore pressure and temperature conditions (40-60 MPa, 2-20 °C).
5.4. Conservative estimates of the CO2 storage capacity in the studied area
and comparison to the onshore case (Paris Basin)
In the deep offshore case, most of the CO2 can be stored either as a liquid in the pure CO2 case or as gas hydrates in the case with impurities (N=96, 97) (section 3.6). In a similar way to the Eq. (1) for the onshore case, the effective CO2 storage capacity MCO2-Nis the product of
the theoretical storage volume (V), the CO2 density and the storage efficiency factor (E):
E V MCO COL 2 100 100 2 with c L CO C S E 2 (8) E V MCO2-N N CON 2 with E SH Cc (9) Where L CO2
is the liquid CO2 density,
N CO2
the CO2 density in CO2-N hydrate (N=96, 97),
L CO
S
2and SH the liquid CO2 and hydrate saturation level, CC the capacity coefficient.
Cc is a site-specific fraction of deep-sea sediments that have suitable permeability for CO2 injection and storage. The major influent parameter on the permeability in those marine sediments is the clay content and the available storage volume is likely to contain a low fraction of clay. As described in Levine et al. (2007), only a limited number of offshore sites may contain deep sediments with sufficient permeability for injection without hydraulic fracturing. Using the permeability-porosity relationship as a function of clay content for marine mudstones (Yang and Aplin, 2010), we found that 10% and 2% are conservative estimates in the studied area of Cc and E, respectively (Supporting Information, Figure 3SI). In the pure CO2 case, the liquid CO2 density at the neutral buoyancy level is equal by definition to the seawater density which is almost constant (~1.045 g cm-3). As the liquid CO2 will accumulate on either side of the neutral buoyancy level, this value is supposed to be the mean value in the available storage volume. The CO2 storage capacity in the liquid state is calculated using the Eq. (8) and is about 473 Gt in the French EEZ, more than one order of magnitude higher than the results in the case with impurities (Table 4).
In the case with impurities (N=96, 97), the density of CO2-97 hydrate (1.096 g cm-3) and the density of CO2-96 hydrate (1.108 g cm-3) are very closed and lower than the pure CO2 hydrate density (1.15 g cm-3) (Takenouchi and Kennedy, 1965). Using the cage occupancy for each component given by CSMGem, we found that the CO2 density is 0.3 g/cm3 and 0.29 g/cm3 in CO2-96 and CO2-97 hydrate, respectively (Supporting Information, Eq. 1SI). The CO2 storage capacity as gas hydrates is calculated using the Eq. (9) and lies between 10 Gt
and 14 Gt in the French EEZ (Table 4). Our most conservative estimate of the storage capacity in the French EEZ (10 Gt) is therefore higher than the conservative estimate (8 Gt) of the Paris Basin storage capacity. Moreover, the storage capacity beyond 200 miles from the shores is of the same order of magnitude than in French EEZ (Table 4).
6. Conclusions
This work has provided evidences in support of the innovative concept of a deep offshore CO2 storage in deep-sea sediments. Based on available data from DSDP boreholes and from cruises on the R/V Le Suroît and Jean Charcot, the CO2 storage volume has been estimated in the area of the Celtic Sea and the Bay of Biscay. The storage volume depends essentially on the geothermal gradient and on the quality of the injected CO2.
The available volume is one order of magnitude lower if the injected CO2 contains some impurities like N2 or CH4. A sensitivity analysis has been carried out and has showed that the influence of the variation of the impurities (N2 or CH4) on the storage volume is of the same order than that of local heat flux variations. Using the amount of French CO2 emissions from large point sources emitting more than 0.1 Mt/year (116 Mt in 2012 from
http://www.pollutionsindustrielles.ecologie.gouv.fr), we found that the mean estimate of the storage capacity in French EEZ (12 Gt) exceeds 100 years of storage of the current French CO2 emissions from large point sources. Moreover, the most conservative estimate in the French EEZ is higher than the conservative estimate of the storage capacity in the deep saline aquifers in the Paris Basin. Furthermore, this storage capacity is doubled when considering the zone beyond 200 miles adopted on 24 March 2009 by the UN Commission on the Limits of the Continental Shelf (CLCS) in the studied area.
The implications are therefore potentially important for the long-term deployment of the CO2 storage as well in France as in Western Europe. However, large uncertainties remain with regard to the effective storage capacity due to the lack of knowledge of the influence of the sediment composition on CO2 hydrate formation and saturation level. Those preliminary results need therefore further refinements. This will mainly imply permeability measurements of deep-sea sediments samplings and building up a consistent database from experiments performed at in situ conditions, i.e. in the high pressure range (40-60 MPa) and with different
Acknowledgements
This work is a part of a Development Project funded by the Research Division of the Bureau de Recherches Géologiques et Minières (BRGM, i.e. the French Geological Survey).One of the authors (AB) thanks Aurélien Leynet and Delphine Allier for the assistance brought in the retrieval of the Paris Basin data. Dr. J. Levine and two anonymous reviewers are thanked for their helpful comments to the manuscript and their constructive suggestions.
Appendix A. Computing method using GMT and GASCO2 to calculate the CO2
storage volume in the French EEZ and in 200M
In the French EEZ, the bathymetric data at a 1 km grid spacing have been extracted from the file bathy_1000m.grd (source: IFREMER, http://sextant.ifremer.fr/record/7462a470-b290-11de-b102-000086f6a603/) (LOUBRIEU et al., 2010). This file has been transformed using GMT V4.5.9. The public domain computational package GMT is a collection of public-domain Unix tools that allows to manipulate geographic and Cartesian x,y,z data sets and produce geo-referenced illustrations (Wessel and Smith, 1998).
The xyz2grd tool is used to convert the ascii ESRI format to the binary GMT netCDF format: xyz2grd bathy_1000m.grd –Gbathy_1000m.nc -E
The grdproject tool is used to transform the gridded data set from a rectangular coordinate system (extended Lambert II conic projection) onto a geographical system:
grdproject bathy_1000m.nc –Gbathy_0.01d.grd –I Jl2.33723/46.8/45.89891/47.69601/1:1 -R-10/-3/44.8/47.5 -C600000/2200000 -D0.01/0.01
The gmtselect tool is then used to select only nodes inside one of the studied polygon areas (e.g. French EEZ polygon called poly_EEZ) and outside the zone where the sediment thickness is lower than 600 m (called poly_600m):
grd2xyz bathy_0.01d.grd –S > bathy_0.01d.dat
gmtselect bathy_0.01d.dat –Fpoly_EEZ > bathy_EEZ.dat gmtselect bathy_EEZ.dat –Fpoly_600m -If > bathy_EEZ.dat
xyz2grd bathy_EEZ.dat -R-10.005/-3.505/44.855/47.455 -I0.01/0.01 –Gbathy_EEZ.grd The grdclip tool is used to set z values higher than -4000 m to NaN (Not a Number): grdclip bathy_EEZ.grd –Gbathy2.grd –Sa-4000/NaN
The grdmath tool is used to set z values with a gradient higher than 0.01 to NaN:
grdmath -M bathy2.grd DDX SQR bathy2.grd DDY SQR ADD SQRT 0.01 LT bathy2.grd MUL 0 NAN = bathy3.grd
The grd2xyz tool is used to write the ascii file bathy3.data: grd2xyz bathy3.grd -S > bathy3.dat
The ascii file bathy3.dat is read as input file by the code GASCO2 to calculate both output files nbz.dat and ghsz.dat which contains the NBZ‟s thickness (in mbsl) and the GHSZ‟s thickness (in mbsl), respectively (Figure 3).
In both CO2-N cases (N=96, 97), the volume which may host gas hydrates lies between the GHSZ and NBZ‟s lower limits, but only in the sub-domain where NBZ is included in GHSZ (see section 3.6). The grdmath tool is used to extract this sub-domain:
grdmath nbz.grd ghsz.grd LT nbz.grd MUL 0 NAN = nbz2.grd
grdmath nbz.grd ghsz.grd LT ghsz.grd MUL 0 NAN = ghsz2.grd
The thickness.grd grid contains the total thickness of the storage zone (in m): grdmath ghsz2.grd nbz2.grd SUB = thickness.grd
A mean vertical porosity is calculated using the linear approximation from site 400 in EEZ and site 550 in 200M:
1000 / )
porosity( z ab z (A1)
Where a is the porosity at seafloor and b the variation of porosity with depth (in km). The parameters (a,b) are (0.6366,-0.45) and (0.6605,-0.596) in EEZ and 200M, respectively (Figure 2). This linear relation is used to calculate the mean vertical porosity at each node: grdmath nbz2.grd ghsz2.grd ADD 2 DIV bathy3.grd SUB b MUL a ADD = porosity.grd The storage potential as gas hydrates is calculated using the thickness multiplied by the mean porosity in each domain (EEZ or 200M):
grdmath ghsz2.grd nbz2.grd SUB porosity.grd MUL = storage.grd
The grdvolume tool is used to calculate the sediment volume and the theoretical porous volume (m3) that may host gas hydrate:
grdvolume –S thickness.grd > volume.txt grdvolume -S storage.grd > porous_volume.txt
In the pure CO2 case, the volume which may host liquid CO2 cannot exceed twice the depth difference between the neutral buoyancy level and the hydrate formation level (section 3.6):
grdmath nbz.grd ghsz.grd SUB 2 MUL = thickness2.grd
As the thickness of NBZ is between 500m and 1200 m (Figure 7), the linear relation for the porosity given in Figure 2 is no more valid. Therefore, 40% has been chosen as a conservative estimate of the porosity:
grdmath nbz.grd ghsz.grd SUB 2 MUL 0.4 MUL = storage2.grd
The grdvolume tool is used to calculate the sediment volume and the theoretical porous volume (m3) that may host pure CO2 as a liquid:
grdvolume –S thickness2.grd > volume2.txt grdvolume -S storage2.grd > porous_volume2.txt
In the 200M zone, a bathymetry has been extracted from the 1 arc-minute global grid ETOPO1 (http://maps.ngdc.noaa.gov/viewers/wcs-client) directly in the GMT NetCDF format (Amante and Eakins, 2009).
References
Amante, C., Eakins, B. W., 2009. ETOPO1 1 arc-minute global relief model: procedures, data sources and analysis. Technical Memorandum NESDIS NGDC-24 19 pp.
Anderson, R., Llamedo, M., Tohidi, B., Burgass, R. W., 2003. Experimental Measurement of Methane and Carbon Dioxide Clathrate Hydrate Equilibria in Mesoporous Silica. The Journal of Physical Chemistry B 107 (15) 3507-3514.
Auffret, G., et al., 2000. Premières observations sur la morphologie et les processus sédimentaires récents de l‟Éventail celtique. Oceanologica Acta 23 (1) 109-116.
Bachu, S., 2008. Comparison between Methodologies Recommended for Estimation of CO2 Storage Capacity in Geological Media. CSLF (Carbon Sequestration Leadership Forum) CSLF-T-2008-04 17p.
Bachu, S., Bonijoly, D., Bradshaw, J., Burress, R., Christensen, N. P., Holloway, S., Mathiassen, O., 2007. Estimation of CO2 Storage Capacity in Geological Media. CSLF (Carbon Sequestration Leadership Forum) CSLF-T-2007-04 42p.
Ballard, A. L., Sloan Jr, E. D., 2002. The next generation of hydrate prediction: I. Hydrate standard states and incorporation of spectroscopy. Fluid Phase Equilibria 194–197 (0) 371-383.
Bourillet, J., Reynaud, J., Baltzer, A., Zaragosi, S., 2003. The 'Fleuve Manche': the submarine sedimentary features from the outer shelf to the deep-sea fans. Journal of Quaternary Science 18 (3-4) 261-282.
Brugge, H. B., Holste, J. C., Hall, K. R., Gammon, B. E., Marsh, K. N., 1997. Densities of Carbon Dioxide + Nitrogen from 225 K to 450 K at Pressures up to 70 MPa. Journal of Chemical & Engineering Data 42 (5) 903-907.
Bullard, E. C., Day, A., 1961. The Flow of Heat through the Floor of the Atlantic Ocean. Geophysical Journal International 4 (Supplement 1) 282-292.
Chapoy, A., Burgass, R., Tohidi, B., Alsiyabi, I., 2015. Hydrate and Phase Behavior Modeling in CO2-Rich Pipelines. Journal of Chemical & Engineering Data. 10.1021/je500834t.
Clennell, M. B., Hovland, M., Booth, J. S., Henry, P., Winters, W. J., 1999. Formation of natural gas hydrates in marine sediments: 1. Conceptual model of gas hydrate growth conditioned by host sediment properties. Journal of Geophysical Research: Solid Earth 104 (B10) 22985-23003.
Dai, S., Santamarina, J. C., Waite, W. F., Kneafsey, T. J., 2012. Hydrate morphology: Physical properties of sands with patchy hydrate saturation. Journal of Geophysical Research: Solid Earth 117 (B11) - B11205.
Davies, J. H., Davies, D. R., 2010. Earth's surface heat flux. Solid Earth 1 (1) 5-24.
de Beer, D., Haeckel, M., Neumann, J., Wegener, G., Inagaki, F., Boetius, A., 2013. Saturated CO2 inhibits microbial processes in CO2-vented deep-sea sediments. Biogeosciences 10 (8) 5639-5649.
de Visser, E., Hendriks, C., Barrio, M., Mølnvik, M. J., de Koeijer, G., Liljemark, S., Le Gallo, Y., 2008. Dynamis CO2 quality recommendations. International Journal of Greenhouse Gas Control 2 (4) 478-484.
Decarre, S., Berthiaud, J., Butin, N., Guillaume-Combecave, J., 2010. CO2 maritime transportation. International Journal of Greenhouse Gas Control 4 (5) 857-864.
Droz, L., Auffret, G. A., Savoye, B., Bourillet, J., 1999. L'éventail profond de la marge celtique: stratigraphie et évolution sédimentaire. Comptes Rendus de l'Académie des Sciences - Series IIA - Earth and Planetary Science 328 (3) 173-180.
Eccles, J. K., Pratson, L., 2013. Economic evaluation of offshore storage potential in the US Exclusive Economic Zone. Greenhouse Gases: Science and Technology 3 (1) 84-95.
Eccles, J. K., Pratson, L., 2012. Global CO2 storage potential of self-sealing marine sedimentary strata. Geophysical Research Letters 39 (19) L19604.
Fisher, A. T., Harris, R. N., 2010. Using seafloor heat flow as a tracer to map subseafloor fluid flow in the ocean crust. Geofluids 10 (1-2) 142-160.
Fofonoff, P., Millard, R. C., 1983. Algorithms for computation of fundamental properties of seawater. Unesco Technical Papers in Marine Science 44 1-53.
Fofonoff, N. P., 1985. Physical properties of seawater: A new salinity scale and equation of state for seawater. Journal of Geophysical Research: Oceans 90 (C2) 3332-3342.
Foucher, J. P., Chenet, P. Y., Montadert, L., Roux, J. M., 1985. Geothermal Measurements during Deep-Sea Drilling Project Leg-80. Initial Reports of the Deep Sea Drilling Project 80 (Mar) 423-436.
Foucher, J. P., Sibuet, J. C., 1980. Thermal Regime of the Northern Bay of Biscay Continental Margin in the Vicinity of the D.S.D.P. Sites 400-402. Philosophical Transactions of the Royal Society of London.Series A, Mathematical and Physical Sciences 294 (1409) 157-167.
Goldberg, D. S., Takahashi, T., Slagle, A. L., 2008. Carbon dioxide sequestration in deep-sea basalt. Proceedings of the National Academy of Sciences 105 (29) 9920-9925.
Goldberg, D., Slagle, A. L., 2009. A global assessment of deep-sea basalt sites for carbon sequestration. Energy Procedia 1 (1) 3675-3682.
Henry, P., Thomas, M., Clennell, M. B., 1999. Formation of natural gas hydrates in marine sediments: 2. Thermodynamic calculations of stability conditions in porous sediments. Journal of Geophysical Research: Solid Earth 104 (B10) 23005-23022.
House, K. Z., Schrag, D. P., Harvey, C. F., Lackner, K. S., 2006. Permanent carbon dioxide storage in deep-sea sediments. Proceedings of the National Academy of Sciences 103 (33) 12291-12295.
Hwang, C., Iglesias-Silva, G., Holste, J. C., Hall, K. R., Gammon, B. E., Marsh, K. N., 1997. Densities of Carbon Dioxide + Methane Mixtures from 225 K to 350 K at Pressures up to 35 MPa. Journal of Chemical & Engineering Data 42 (5) 897-899.
IOC, SCOR, IAPSO, 2010. The international thermodynamic equation of seawater – 2010: Calculation and use of thermodynamic properties. Intergovernmental Oceanographic Commission, Manuals and Guides 56 196.
Klauda, J. B., Sandler, S. I., 2001. Modeling Gas Hydrate Phase Equilibria in Laboratory and Natural Porous Media. Industrial & Engineering Chemistry Research 40 (20) 4197-4208. Kunz, O., Klimeck, R., Wagner, W., Jaeschke, M., 2007. The GERG-2004 wide-range
Kunz, O., Wagner, W., 2012. The GERG-2008 Wide-Range Equation of State for Natural Gases and Other Mixtures: An Expansion of GERG-2004. Journal of Chemical & Engineering Data 57 (11) 3032-3091.
Kvamme, B., Graue, A., Buanes, T., Kuznetsova, T., Ersland, G., 2009. Effects of solid surfaces on hydrate kinetics and stability. Geological Society, London, Special Publications 319 (1) 131-144.
Levine, J. S., Matter, J. M., Goldberg, D., Cook, A., Lackner, K. S., 2007. Gravitational trapping of carbon dioxide in deep sea sediments: Permeability, buoyancy, and geomechanical analysis. Geophysical Research Letters 34 (24) L24703.
Leynet, A., Ha-Duong, M., 2010. Metstor-2 - Évolution technique de l'outil de sélection des sites de stockage de CO2. BRGM/RP-59003-FR 149.
Lopez, S., Hamm, V., Le Brun, M., Schaper, L., Boissier, F., Cotiche, C., Giuglaris, E., 2010. 40 years of Dogger aquifer management in Ile-de-France, Paris Basin, France. Geothermics 39 (4) 339-356.
LOUBRIEU, B., BOURILLET, J. F., MOUSSAT, E., 2010. Bathy-morphologie régionale du Golfe de Gascogne et de la Manche (édition 2008, résolution 1000m). Rapport interne Ifremer DCD/GM/CTDI/08-01.
Louden, K. E., Sibuet, J. C., Foucher, J. P., 1991. Variations in heat flow across the Goban Spur and Galicia Bank continental margins. Journal of Geophysical Research: Solid Earth 96 (B10) 16131-16150.
Lu, H., Kawasaki, T., Ukita, T., Moudrakovski, I., Fujii, T., Noguchi, S., Shimada, T., Nakamizu, M., Ripmeester, J., Ratcliffe, C., 2011. Particle size effect on the saturation of methane hydrate in sediments – Constrained from experimental results. Marine and Petroleum Geology 28 (10) 1801-1805.
Lu, H., Matsumoto, R., 2002. Preliminary experimental results of the stable P-T conditions of methane hydrate in a nannofossil-rich claystone column. Geochemical Journal 36 (1) 21-30. Lupton, J., et al., 2006. Submarine venting of liquid carbon dioxide on a Mariana Arc volcano. Geochemistry, Geophysics, Geosystems 7 (8) Q08007.
Metz, B., Davidson, 0., de Coninck, H. C., Loos, M., & Meyer, L. A. (2005). IPCC Special Report on Carbon Dioxide Capture and Storage. Prepared by Working Group III of the Intergovernmental Panel on Climate Change. Cambridge University Press: Cambridge, United Kingdom and New York, NY, USA.
Miles, P., Bouysse, P., de Souza, K. G., 2012. Structural Map of the Atlantic Ocean, First edition (1:20M). CCGM/CGMW.
Millero, F. J., Poisson, A., Chen, C. T., Bradshaw, A. L., Schleicher, K., 1981. Background papers and supporting data on the International Equation of State of Seawater, 1980. Unesco technical papers in marine science 38 1-192.
Mohammadi, A. H., Eslamimanesh, A., Richon, D., Gharagheizi, F., Yazdizadeh, M., Javanmardi, J., Hashemi, H., Zarifi, M., Babaee, S., 2012. Gas Hydrate Phase Equilibrium in Porous Media: Mathematical Modeling and Correlation. Industrial & Engineering Chemistry Research 51 (2) 1062-1072.
Montadert, L., Roberts, D. G., Auffret, G. A., Bock, W. D., Dupeuble, P. A., Hailwood, E. A., Harrison, W. E., Kagami, H., Lumsden, D. N., Muller, C. M., Schnitker, D., Thompson, R.
W., Thompson, T. L., Timofeev, P. P., Usher, J. L., 1979. Sites 399, 400, and Hole 440A. Initial Reports of the Deep Sea Drilling Project 48.
Prasad, P. S. R., Chari, V. D., Sharma, D. V. S. G. K., Murthy, S. R., 2012. Effect of silica particles on the stability of methane hydrates. Fluid Phase Equilibria 318 (0) 110-114.
Pribnow, D. F. C., Kinoshita, M., Stein, C. A., 2000. Thermal data collection and heat flow recalculations for ODP Legs 101-180. 0120432.
Qanbari, F., Pooladi-Darvish, M., Tabatabaie, S. H., Gerami, S., 2012. CO2 disposal as hydrate in ocean sediments. Journal of Natural Gas Science and Engineering 8 (0) 139-149. Santamarina, J. C., Ruppel, C., 2010. The impact of hydrate saturation on the mechanical, electrical, and thermal properties of hydrate-bearing sand, silts, and clay. Geophysical Characterization of Gas Hydrates, Geophys.Dev.Ser 14 373-384.
Saunders, P. M., 1981. Practical Conversion of Pressure to Depth. Journal of Physical Oceanography 11 (4) 573-574.
Slagle, A. L., Goldberg, D. S., 2011. Evaluation of ocean crustal Sites 1256 and 504 for long-term CO2 sequestration. Geophysical Research Letters 38 (16) L16307.
Sloan, E., & Koh, C. (2007). Clathrate Hydrates of Natural Gases, Third Edition. CRC Press. Takenouchi, S., Kennedy, G. C., 1965. Dissociation Pressures of the Phase CO2.5.75 H2O. The Journal of geology 73 (2) 383-390.
Thinon, I., 1999. Structure profonde de la Marge Nord Gascogne et du Bassin Armoricain. Université de Bretagne occidentale, 326p.
Thinon, I., Matias, L., Réhault, J. P., Hirn, A., Fidalgo-Gonzàlez, L., Avedik, F., 2003. Deep structure of the Armorican Basin (Bay of Biscay): a review of Norgasis seismic reflection and refraction data. Journal of the Geological Society 160 (1) 99-116.
Tohidi, B., Yang, J., Salehabadi, M., Anderson, R., Chapoy, A., 2010. CO2 Hydrates Could Provide Secondary Safety Factor in Subsurface Sequestration of CO2. Environmental science & technology 44 (4) 1509-1514.
Toucanne, S., Zaragosi, S., Bourillet, J. F., Naughton, F., Cremer, M., Eynaud, F., Dennielou, B., 2008. Activity of the turbidite levees of the Celtic–Armorican margin (Bay of Biscay) during the last 30,000 years: Imprints of the last European deglaciation and Heinrich events. Marine Geology 247 (1–2) 84-103.
Toucanne, S., Zaragosi, S., Bourillet, J., Dennielou, B., Jorry, S. J., Jouet, G., Cremer, M., 2012. External controls on turbidite sedimentation on the glacially-influenced Armorican margin (Bay of Biscay, western European margin). Marine Geology 303–306 (0) 137-153. Toucanne, S., Zaragosi, S., Bourillet, J., Marieu, V., Cremer, M., Kageyama, M., Van Vliet-Lanoë, B., Eynaud, F., Turon, J., Gibbard, P. L., 2010. The first estimation of Fleuve Manche palaeoriver discharge during the last deglaciation: Evidence for Fennoscandian ice sheet meltwater flow in the English Channel ca 20–18 ka ago. Earth and Planetary Science Letters 290 (3–4) 459-473.
Uchida, T., Takeya, S., Chuvilin, E. M., Ohmura, R., Nagao, J., Yakushev, V. S., Istomin, V. A., Minagawa, H., Ebinuma, T., Narita, H., 2004. Decomposition of methane hydrates in sand, sandstone, clays, and glass beads. Journal of Geophysical Research: Solid Earth 109
Vangkilde-Pedersen, T., et al., 2009. D16 WP2 Report – Storage capacity. EU GeoCapacity project – Assessing European Capacity for Geological Storage of Carbon Dioxide. Available from www.geology.cz/geocapacity.
Vilarrasa, V., Silva, O., Carrera, J., Olivella, S., 2013. Liquid CO2 injection for geological storage in deep saline aquifers. International Journal of Greenhouse Gas Control 14 84-96. Waite, W. F., et al., 2009. Physical properties of hydrate-bearing sediments. Reviews of Geophysics 47 (4) - RG4003.
Ward, Z. T., Deering, C. E., Marriott, R. A., Sum, A. K., Sloan, E. D., Koh, C. A., 2014. Phase Equilibrium Data and Model Comparisons for H2S Hydrates. Journal of Chemical & Engineering Data. 10.1021/je500657f.
Wessel, P., Smith, W. H. F., 1998. New, improved version of generic mapping tools released. Eos, Transactions American Geophysical Union 79 (47) 579-579.
Yan, J., Anheden, M., Bernstone, C., Liljemark, S. S., Pettersson, H., Li, H., Yan, J.Impacts of non-condensable components on CO2 processing, pipeline transport and geological storage. 1st IEA GHGT International Oxyfuel Combustion Conference September 8–11Cottbus, Germany, 2009.
Yang, Y., Aplin, A. C., 2010. A permeability–porosity relationship for mudstones. Marine and Petroleum Geology 27 (8) 1692-1697.
Zaragosi, S., Auffret, G. A., Faugères, J. -., Garlan, T., Pujol, C., Cortijo, E., 2000. Physiography and recent sediment distribution of the Celtic Deep-Sea Fan, Bay of Biscay. Marine Geology 169 (1–2) 207-237.
Zaragosi, S., Eynaud, F., Pujol, C., Auffret, G. A., Turon, J. -., Garlan, T., 2001. Initiation of the European deglaciation as recorded in the northwestern Bay of Biscay slope environments (Meriadzek Terrace and Trevelyan Escarpment): a multi-proxy approach. Earth and Planetary Science Letters 188 (3–4) 493-507.
Table 1. CO2-96, CO2-97 and CO2-100 stream compositions Concentrations in dried CO2 (mole fraction %) CO2-96 Oxy-fuel combustion in gas-fired plants CO2-97 Pre-combustion in gas-fired plants CO2-100 Pure CO2 CO2 96.0 97.13 100 N2 a 3.54 1.1 0 CH4 a 0 1.77 0 O2 a 0.46b 0 0 a
Total volume for all non-condensable gases together (N2, Ar, H2, CH4, CO, O2) is recommended to be less than 4% (volume fraction) (de Visser et al., 2008)
b
It is here supposed in the CO2-96 case that all oxygen is quickly consumed after the injection in deep-sea sediments due to an anoxic environment
Table 2. Bottom Water Temperature, Surface Thermal Conductivity and Heat Flux in the studied zone (see locations in Figure 1)
Global Heat Flow Database GHFD09 http://www.hea tflow.und.edu Leg 80 550 a CH5 CH9 CH13 CH15 SU2 b BD17 BD9 c BD10 c BU5 Depth (m) 4420 4732 4081 4378 4052 4485 4844 4592 4413 4710 Bottom Water Temperature (°C) 2.65 2.54 2.53 2.52 2.52 2.69 - - - - Surface Thermal Conductivity (W m-1 K-1) 1.48 (1.1) 1.17 1.05 1.06 1.14 0.86 0.91 0.95 0.91 1.11 Heat Flux (mW m-2) 59 (60) 33 40 50 46 44.9 58.2 31.4 (33) 45.6 (50) 50.2 a
Data from DSDP Leg 80 site 550 have been recalculated (values in brackets) from the original values (Foucher et al., 1985) using a linearly increasing conductivity with depth b
The SU2 observation acquired during the cruise on Le Suroit in 1984 is reported in (Louden et al., 1991))
c
Data of BD9, BD10 within shallow sediments (<10 m) have been recalculated (values in brackets) from the original values (Bullard and Day, 1961) using only the short junction in the lower part of the tube in order to avoid the heat transport by water in the superficial part of the sedimentary cover
Table 3. Influence of the impurities (N=96, 97) on the theoretical storage volume as gas hydrates in the French EEZ and comparison with the storage
volume as a liquid in the pure CO2 case (N=100)
French EEZ Surface
a (km2) Sediment Volume b (km3) Mean Thickness b (m) Mean Porosity Theoretical Storage Volume c (km3) CO2-96 low HF case 28 162 3375 120 0.47 1602 medium HF case 42 120 3754 89 0.53 1982 high HF case 42 120 3244 77 0.56 1805 CO2-97 low HF case 33 834 4415 130 0.46 2030 medium HF case 42 120 4610 109 0.52 2400 high HF case 42 120 3846 91 0.55 2121 CO2-100 medium HF case 42 120 56 567 1343 0.4 22 627 a
Surface is by definition the EEZ-CO2 area in the pure CO2 case (N=100) and the sub-domain where NBZ is included in GHSZ in the case with impurities (N=96, 97). b
Sediment Volume is defined as the product of the surface and the thickness. In the pure CO2 case (N=100), the thickness is twice the depth difference between the neutral buoyancy level and the hydrate formation level. In the case with impurities (N=96, 97), the thickness is the difference between the hydrate formation level and the neutral buoyancy level.
c
Theoretical Storage Volume is the porous volume that may host liquid CO2 in the pure CO2 case (N=100) and gas hydrates in the case with impurities (N=96, 97) (section 3.6).
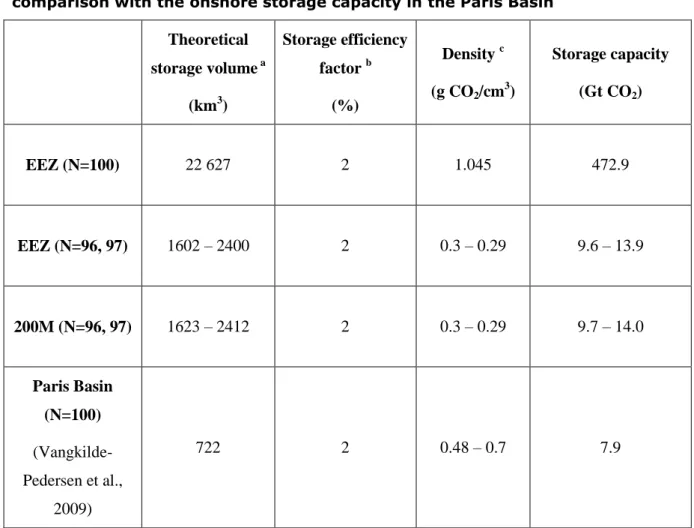
Table 4. Conservative estimates of the storage capacity in the studied area and comparison with the onshore storage capacity in the Paris Basin
Theoretical storage volume a (km3) Storage efficiency factor b (%) Density c (g CO2/cm 3 ) Storage capacity (Gt CO2) EEZ (N=100) 22 627 2 1.045 472.9 EEZ (N=96, 97) 1602 – 2400 2 0.3 – 0.29 9.6 – 13.9 200M (N=96, 97) 1623 – 2412 2 0.3 – 0.29 9.7 – 14.0 Paris Basin (N=100) (Vangkilde-Pedersen et al., 2009) 722 2 0.48 – 0.7 7.9 a
In the pure CO2 case (N=100), the theoretical storage volume is calculated in the medium HF case. In the other cases (N=96, 97), the minimum volume is the low HF CO2-96 case and the maximum volume is the medium HF CO2-97 case (see Table 3)
b
2% has been considered as a conservative estimate of the storage efficiency factor in the studied area (see Supporting Information). The same value has been used in the conservative estimate of the storage capacity in Paris Basin (Vangkilde-Pedersen et al., 2009)
c
In the pure CO2 case, a mean liquid CO2 density of 1.045 g/cm3 has been used. In the cases with impurities (N=96, 97), a CO2 density of 0.3 g/cm3 in CO2-96 hydrate and 0.29 g/cm3 in CO2-97 hydrate has been calculated (see Supporting Information).
Figure 1. Location map in the area of the Celtic Sea and the Bay of Biscay
showing surface heat flux observations by circles and DSDP boreholes by white triangles (L48 400 in French EEZ and L80 550 in 200M zone). Also shown are
the Paris Basin potential CO2 storage zone in pink color and the main onshore
CO2 sources in 2010 by white squares (Source: EC-JRC/PBL. EDGAR version 4.0.
Figure 2. Porosity and Thermal Conductivity (TC) vertical profiles at DSDP Leg 80 Site 550 and Leg 48 Site 440. TC profile from Site 440 is deduced from the porosity profile using the linear relation given by the Site 550.
0 100 200 300 400 500 600 700 0 0.5 1 1.5 2 De pt h (mb sf ) DSDP Leg 48 Site 400
Porosity Thermal Conductivity
porosity TC 3.13.0285 0 100 200 300 400 500 600 700 0 0.5 1 1.5 2 2.5 D ept h (mb sf ) DSDP Leg 80 Site 550
Figure 3. Flowchart of the program called GASCO2 which calculates the thickness of NBZ and GHSZ using GERG-2008 and CSMGem via the bisection method for each liquid mixture CO2-N (N=96, 97, 100) and Heat Flow (HF).