Faculte de genie
Departem ent de genie civil
Evaluation de la vulnerability sismique des
ponts routiers au Quebec a l’aide des courbes
de fragility
Seismic Risk Assessment of Bridges in Quebec using Fragility
Curves
These de doctorat
Speciality : genie civil
Danusa Haick TAVARES
Jury: Patrick PAULTRE (directeur)
Jamie E. PADGETT (co-directrice)
Daniel BOUCHARD
Jacky MAZARS
Denis MITCHEL
Jean PROULX (rapporteur)
Sherbrooke (Quebec) Canada
Date: March 23, 2012
1+1
Library and Archives Canada Published Heritage Branch Bibliotheque et Archives Canada Direction du Patrimoine de I'edition 395 Wellington Street Ottawa ON K 1A0N 4 Canada 395, rue Wellington Ottawa ON K1A 0N4 CanadaYour file Votre reference ISBN: 978-0-494-93260-5
Our file Notre reference ISBN: 978-0-494-93260-5
NOTICE:
The author has granted a non
exclusive license allowing Library and Archives Canada to reproduce, publish, archive, preserve, conserve, communicate to the public by
telecomm unication or on the Internet, loan, distrbute and sell theses
worldwide, for commercial or non commercial purposes, in microform, paper, electronic and/or any other formats.
AVIS:
L'auteur a accorde une licence non exclusive permettant a la Bibliotheque et Archives Canada de reproduire, publier, archiver, sauvegarder, conserver, transmettre au public par telecomm unication ou par I'lnternet, preter, distribuer et vendre des theses partout dans le monde, a des fins com merciales ou autres, sur support microforme, papier, electronique et/ou autres formats.
The author retains copyright ownership and moral rights in this thesis. Neither the thesis nor substantial extracts from it may be printed or otherwise reproduced without the author's permission.
L'auteur conserve la propriete du droit d'auteur et des droits moraux qui protege cette these. Ni la these ni des extraits substantiels de celle-ci ne doivent etre imprimes ou autrement
reproduits sans son autorisation.
In compliance with the Canadian Privacy A ct some supporting forms may have been removed from this thesis.
W hile these forms may be included in the document page count, their removal does not represent any loss of content from the thesis.
Conform em ent a la loi canadienne sur la protection de la vie privee, quelques
form ulaires secondaires ont ete enleves de cette these.
Bien que ces form ulaires aient inclus dans la pagination, il n'y aura aucun contenu manquant.
Sonia, ma soeur Danielle et mon frere Jose Danilo.
RESUME
Les courbes de fragilite sont utilisees pour evaluer la vulnerability sismique des ponts a travees multiples dans la province du Quebec. Les courbes de fragilite sont un outil probabiliste pour evaluer la vulnerability d ’une structure. Elies expriment la probability qu’un pont puisse atteindre un etat d ’endommagement specifique produit par un evene- ment sismique. En raison de leur aspect probabiliste, les courbes de fragilite perm ettent de tenir compte des incertitudes sur certaines proprietes des ponts ou sur l’excitation sis mique. L’histoire de l’activite sismique dans la province du Quebec demontre la necessity de tenir compte des effets sismiques dans revaluation et la renovation des ponts existants. Les dommages causes par les tremblements de terre au cours des dernieres decennies ont montre que la vulnerability sismique d ’un reseau de transport est principalement liee aux ponts. Le reseau de ponts au Quebec est age de plus de 30 ans. Au moment ou il a ete congu et construit, la technologie et les connaissances dans le domaine sismique etaient loin de leur etat actuel.
La methode devaluation des risques sismiques utilisant les courbes de fragilite est d ’abord utilisee pour estimer la vulnerability sismique d ’un pont routier specifique. Le pont etu- die est le pont Chemin des Dalles situe a Trois Rivieres au Quebec sur l’autoroute 55. Les donnees des essais dynamiques sur place sont utilisees pour calibrer un modele tri- dimensionnel non lineaire par elements finis avec le logiciel OpenSees. Une serie de 180 accelerogrammes artificiels compatibles avec l’est du Canada est utilisee pour representer les incertitudes liees a l’alea sismique. Des analyses temporelles sont effectuees avec ces accelerogrammes et leurs resultats ont ete utilises pour effectuer une regression lineaire dans l’espace log-normal afin de definir les modeles probabilistes de demande sismique des composantes du pont. Les etats limites des composantes du pont, par exemple les culees, les appareils d ’appui ou les poteaux sont choisis en fonction des types d ’endommagements observes sur les ponts qui ont subi des tremblements de terre passes. Des informations ont egalement ete trouvees dans la litterature pour definir les etats limites pour les culees et les appuis elastomeriques. En plus de ces donnees, des analyses de mecanique d ’endomma gement ont permis de definir les etats limites pour les poteaux. Finalement, un ensemble de courbes de fragility pour le pont tel que construit est developpe par combinaison de la demande et des modeles de capacity en utilisant la methode d ’echantillonnage de Monte Carlo.
Meme si revaluation d ’un pont specifique est une source precieuse d ’information, celle-ci est limitee a la singularity de la structure. Pour perm ettre revaluation de l’ensemble du reseau routier au Quebec, pas uniquement un mais l’ensemble des ponts doit etre pris en compte. Les ponts au Quebec ont ete construits pendant 300 ans. En utilisant la base de donnees de Transports Quebec, 2672 ponts a travees multiples ont ete identifies. La population des ponts a travees multiples du reseau est presentee, et un pont moyen de reference est defini. Ensuite, avec quatre accelerogrammes differents de la serie, des ana lyses deterministes temporelles sont effectuees sur ce pont, illustrant la variability de l’alea sismique. En utilisant le pont de reference moyen et l’accelerogramme qui a le plus d ’effets,
la reponse du pont. Deux types de culee seat-type sont egalement examines, un type avec des fondations superficielles et l’autre avec des fondations profondes avec pieux. Deux types de fondation des piliers sont examines : une fondation superficielle avec semelles et une fondation profonde avec pieux. Conformement a la classification des sols dans le CAN/CSA-S6-06, relative a la classification figurant dans le CNBC 2005, quatre types de sols sont utilises pour evaluer leur influence sur le comportement du pont de reference. La description de la totalite des ponts du reseau se poursuit avec leur classement et la determination des parametres importants pour une analyse sismique. Pour classer les ponts dans des classes ou portefeuilles, les ponts a travees multiples sont separes selon le type de systeme structural et le type de materiau. D’autres param etres lies a la geometrie, au materiau et a certaines de leurs variantes sont evalues afin de mieux decrire chaque classe de pont. Une analyse de variance, ANOVA, est realisee pour determiner les parametres importants definissant les incertitudes pour chaque classe de pont typique. Un modele numerique tridimensionnel non lineaire par elements finis est developpe pour chaque classe de ponts, et ces modeles sont ensuite soumis a une serie d ’accelerogrammes. Les reponses de certains elements du pont sont analysees et une regression lineaire est effectuee afin de developper les modeles probabilistes de demande sismique (PSDM). L’ensemble des PSDM est compare aux etats limites predefinis des composantes du pont, qui definissent les modeles probabilistes de capacite sismiques (PSCM), afin de developper les courbes de fragilite de la totalite du pont.
M ots-cles : courbefi de fragilite; vulnerability sismique; ponts routiers; evaluation du
ABSTRACT
Fragility curves are used to evaluate the seismic vulnerability of the multi span bridges in the Province of Quebec. Fragility curves are a probabilistic tool to evaluate the vulnera bility of a structure. They express the probability of a bridge reaching a certain damage state for a given seismic event. Due to their probabilistic aspect, fragility curves enable to account for uncertainties in some properties of the bridges or in the seismic excitation. The seismic historical activity in the Province of Quebec demonstrates the need to consider seismic effects in the evaluation and retrofit of existing bridges. Earthquake damages in recent decades have revealed th at the seismic vulnerability of a transportation system is mostly due to bridges. The bridge network in Quebec dates back more than 30 years. At the time it was designed and built, the technology and knowledge in this domain were far from their current state.
The seismic risk assessment method using fragility curves is first used to evaluate the seismic vulnerability of a specific highway bridge. The bridge studied is the Chemin des dalles bridge over Highway 55 located in Trois-Rivieres in Quebec. The data from in-situ dynamic tests are used to calibrate a three dimensional nonlinear finite element model in OpenSees. A series of 180 synthetic ground motions time histories (GMTH) compat ible with eastern Canada are used to capture the uncertainties related to the hazard. Time-histories analysis are performed with these GMTH and the results are used in a log-space linear regression to define the bridge components probabilistic seismic demand model (PSDM). The bridge components monitored, e.g. abutments, bearings and columns are chosen based on the types of bridge failures observed in past earthquakes. The ob servational data in the literature is also used to defined the limit states for abutments and bearings and for columns in addition to damage mechanics analysis. Finally, a set of fragility curves for the as-built bridge is developed combining the demand and capacity models using a Monte Carlo method.
Even though the evaluation of a specific bridge is a valuable source of information it is limited to the singularity of the structure. To enable the assessment of the entire road network in Quebec, not one but all bridge shall be considered. Bridges in Quebec have been built for 300 years. Using the Transports Quebec bridges database, a total of 2672 multi-span bridges are identified. The multi-span bridge network population is presented and an average bridge is defined. Then, deterministic analysis with ground motion time histories are performed in this bridge illustrating the seismic hazard variability. Using the same average bridge and the GMTH th at have the most impact in this bridge three types of bridge bents are tested to verify the significance of the bridge bent type. Two types of abutments are also evaluated, the seat type with shallow foundation and the other with piles. Two bent foundation types: shallow foundation with footings and deep foundation with piles are also evaluated. Following the classification of soils in the CAN/CSA-S6-06 and relating with the classification found in the NBCC 2010 four types of soil are used to evaluate their influence in the behavior of the average bridge.
The bridge network population description continues with their classification and their significant parameters for a seismic analysis are determined. To classify the bridges into bridge classes or portfolios the multi span bridges are separated according to the type of bridge system and material. Moreover, other parameters related to geometry, material and other variations are evaluated to better describe each bridge class. An analysis of variance, ANOVA, is performed through a factorial design to enable the determination of the significant parameters th at define the uncertainties for each typical bridge portfolio. A three dimensional nonlinear finite element numerical model is developed for each class and these models are submitted to a series of events. The responses of some bridge components are analyzed and a linear regression is performed to develop probabilistic seismic demand models (PSDM). The ensemble of these PSDM is compared to predefined limit states th at define de probabilistic seismic capacity models (PSCM) to develop the bridge system fragility curves.
A C K N O W L E D G E M E N T S
The author recognizes the opportunity given by Professor Patrick Paultre in accepting her as part of his research group and is very thankful for it. This project would not be possible without the help from the researchers from Georgia Tech, specially Professor Jamie E. Padgett, now at Rice University. Many thanks to all these professors for their patience, time, interest, faith and overall for sharing their knowledge. Special thanks to a former colleague Nathalie Roy, post-doctoral researcher at CRGP, now a professor at Universite de Sherbrooke who helped this author from her first day in Quebec. Special thanks, also, to Gustavo Siqueira and Juliana Suescun who are part of the vulnerability assessment team for their friendship and collaboration on various aspects of the project. It is well known th at one cannot overcome the power of a group in reaching a common objective.
The author would like to acknowledge the financial support of the Natural Sciences and Engineering Research Council of Canada (NSERC) for the Canadian Seismic Research Network (CSRN), the Quebec Fonds pour la recherche sur la nature et les technologies (FQRNT) for the Centre d ’etudes interuniversitaires des structures sous charges extremes (CEISCE) and Transports Quebec (TQ). Specially to Marc Savard from TQ who played an important role in providing all necessary information. Computational resources for this work were provided by Calcul Canada through the Reseau quebecois de calcul de haute performance (RQCHP).
The help from colleagues who are not directly involved in the project is also acknowl edged. To name a few, thanks to Olivier Gauron, Yannick Boivin, Rami Eid, Luis Ignacio Cardona, Laura Osorio, Jesus Emilio Rivera, Eric Lapointe, Milaine Cote, Veronique Faucher and Mathieu Boucher-Trudeau. Special thanks to the Maison Bleue Family, meaning all my more than 20 house-mates throughout these years. And finally, my friends and family support will not be forgotten.
TABLE OF C O N T E N T S
1 In trod uction 1 1.1 O b jectifs... 2 1.2 Importance de la recherche... 2 1.3 Structure du d o c u m e n t... 3 1.4 O b je ctiv e s... 6 1.5 Research significance... 6 1.6 Document Structure ... 72 Seism ic R isk P rocedures and R ecom m end ation s 9 2.1 Canadian Code for Highway Bridges ... 10
2.2 USA Codes for Highway B rid g es... 12
2.2.1 MCEER-06-SP10, 2006 ... 12 2.2.2 A A S H T O ... 15 2.2.3 C a ltr a n s ... 18 2.3 International C o d e s ... 24 2.3.1 C h i n a ... 26 2.3.2 I n d i a ... 26 2.3.3 I r a n ... 27 2.3.4 J a p a n ... 28 2.3.5 New Zealand ... 29 2.3.6 T u rk e y ... 30
2.3.7 FIB CEB-FIP Bulletin 39, 2007 ... 31
2.4 Performance Based Procedures and Recommendations Comparison . . . . 38
3 R isk A ssessm ent 43 3.1 Quebec’s Seismic H a z a rd ... 43
3.2 Screening Process in Q u e b e c ... 48
3.3 Fragility C u rv e s... 52
3.3.1 Expert Based Fragility C u rv e s... 53
3.3.2 Empirical Fragility C u r v e s ... 53
3.3.3 Analytical Fragility C u rv es... 54
4 Seism ic Fragility o f a Highway B ridge in Q uebec 71 4.1 In tro d u ctio n ... 75
4.2 Ground-Motion Time-History S eries... 76
4.3 Bridge Model S im u latio n ... 78
4.4 Deterministic Bridge-Response A ssessm en t... 84
4.5 Capacity E s tim a te s ... 86
4.6 Analytical Fragility C u rv e s... 87
4.7 Conclusion... 91
4.8 A cknow ledgem ents... 92
5 P aram eters U n certain ties D efin ition 93
5.1 In tro d u ctio n ... 93
5.2 Bridges D escrip tio n ... 93
5.3 The Average B rid g e ... 103
5.4 Seismic Parameters sig n ific an c e ... 109
5.4.1 The nature of the GMTH ... 109
5.4.2 The types of b e n t ... 112
5.4.3 The types of abutments ...115
5.4.4 The types of fo u n d atio n s... 116
5.4.5 The soil p ro files... 116
5.5 Typical Bridges Classes D efinition... 118
5.6 Typical Bridges Classes Variability Definition ...120
5.7 Sensitivity Analysis of the Bridge C lasses...: ... 123
6 Fragility C urves o f B rid ges in Q uebec 133 6.1 In tro d u ctio n ... 137
6.2 Ground-Motion S u i t e ... 138
6.3 Typical Bridges in Q u e b e c ...139
6.4 Analytical Model of the Typical B r i d g e s ...144
6.5 Uncertainty in Modeling Parameters ... 145
6.6 Damage Estimates ...148
6.7 Capacity E s tim a te s ...150
6.8 Fragility Curve D evelopm ent...153
6.9 C o n c lu sio n s... 160
7 C onclusion et recom m andations futures 163 7.1 C onclusion... 163
7.2 Recommandations pour les travaux futurs ... 166
7.3 Conclusion... 167
7.4 Recommendations for Future W o r k ... 169.
LIST OF FIGURES
1.1 Evaluation d ’un reseau de ponts (Werner, 2004)... 3
1.2 Screening of a bridge network (Werner, 2004) 7
2.1 SRC Process d e fin itio n ... 17
2.2 Global demand displacement estimate for co lu m n s... 20
2.3 Global demand displacement estimate for fram es... 20
2.4 Global displacement capacity e s t i m a t e ... 22
2.5 Performance Curves... 25
3.1 Global Seismic H a z a r d ... 44
3.2 Eastern Canada last 5 years e a rth q u a k e s ... 44
3.3 Canada Seismic Hazard Map in P G A ... 45
3.4 Canada Seismic Hazard Map in Spectral A cceleratio n ... 46
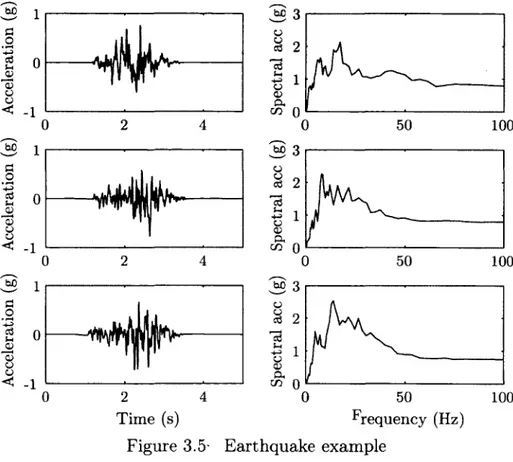
3.5 Earthquake e x a m p l e ... 50
3.6 Transport Quebec Inventory IFS, IES, IVS... 52
3.7 Fragility curve example... 54
3.8 Typical California Bridge... 61
3.9 Capacity Spectrum Method... 63
3.10 Bridge and Component Fragility Curves for slight and moderate damage . 67 3.11 Fragility Curves using bounds and Monte Carlo sim ulations... 67
3.12 Bridge as-built and Retrofitted Fragility C u r v e s ... 70
4.1 Spectral acceleration mean and standard deviation ... 77
4.2 Chemin des Dalles Bridge and OpenSees finite element model... 77
4.3 Bridge elevation and model d e sc rip tio n ... 79
4.4 Preliminary study of a bridge’s concrete column b e h a v io r... 80
4.5 Column-fiber cross section... 81
4.6 Foundation, abutment, and bearing model behavior... 82
4.7 Bridge experimental and model periods and mode shapes... 83
4.8 Column response... . 85
4.9 Elastomeric-bearing response... 86
4.10 Abutment response... 86
4.11 Component fragility curves... 90
4.12 Bridge-system fragility c u r v e s ... 91
5.1 Bridges Localization in Quebec... 94
5.2 Histograms of general p a ra m e te r s ... 96
5.3 Bridge importance parameters... 97
5.4 Geometric P a r a m e te r s ... 98
5.5 Maximum Span L e n g th ... 99
5.6 Significant Bent T y p e s ... 101
5.7 Transports Quebec bridge evaluation index... 102
5.8 Multi spans average bridge in Quebec... 105
5.9 Bridge 3D Model and Beam-column elements ... 106
5.10 Bridge Zero Length Models ...107
5.11 Average Bridge Vibration M odes... 108
5.12 Chosen GMTH... 109
5.13 Deck D isplacem ents... 110
5.14 Column R esp o n se...I l l 5.15 Bearing response... 112
5.16 Abutment wing wall and foundation response... 113
5.17 Shallow Foundations response... 113
5.18 Columns Fiber sections...114
5.19 Most recurrent bridges superstructures types in Quebec... . 118
5.20 Bridge Portfolios Division ...120
5.21 Damping distribution... 123
5.22 MSSSConcreteGirder geometry block distributions... 124
5.23 Latin Hypercube Sampling...126
6.1 Spectral accelerations for each set of GMTH...139
6.2 PGA distribution for the series of ground motion time histories...140
6.3 Most recurrent types of bridge superstructures in Quebec...140
6.4 Bridge 3D model and beam-column elements... 142
6.5 Concrete and steel behavior... 143
6.6 Zero-length elements for elastomeric bearings or gap with im pact... 143
6.7 PSDM for the MSC slab bridge class... 150
6.8 Bridge classes and their components fragility c u r v e s ...157
6.9 Mean fragility using PGA as an I M ... 158
LIST OF TABLES
2.1 Performance objectives m atrix... 11
2.2 Damage Levels... 11
2.3 Seismic performance zones... 12
2.4 Analysis methods for new structures... 12
2.5 Analysis methods for existing structures... 13
2.6 Minimum performance levels for retrofitted bridges... 14
2.7 Seismic Hazard Level... 15
2.8 Performance-based SRC... 15
2.9 Minimum performance requirements... 16
2.10 Target displacement ductility demand values... 19
2.11 Damage Level Definition... 24
2.12 Field Observation Damage Definition... 25
2.13 Performance Matrix... 25
2.14 Prioritization Methods... 32
2.15 Definition of the observational damage states... 35
2.16 Functionality Limit States... 37
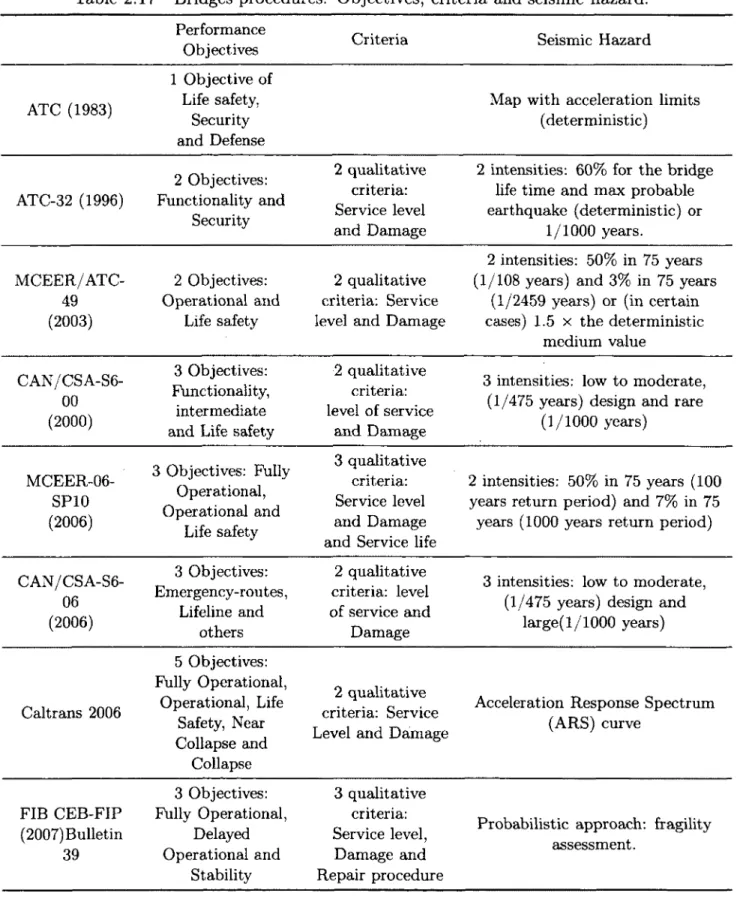
2.17 Bridges procedures: Objectives, criteria and seismic hazard... 39
2.18 Bridges procedures: non-linear analysis and screening process... 41
3.1 Parameters used to generate the GMTH s e r ie s ... 49
3.2 Seismic influence coefficients... 51
3.3 Seismic Level Identification... 51
3.4 Seismic influence coefficients... 52
3.5 Seismic hazard intensity measure ( I M ) ... 59
3.6 Engineering Demand Parameters ( E D P ) ... 60
3.7 Intensity Measures ev alu ated ... 68
4.1 Superstructure properties... 78
4.2 Damage states (adapted from HAZUS 2003). 88 4.3 Quantitative limit-state capacities... 88
4.4 Component fragility. ... 90
4.5 Bridge-system fragility. . . . ' ... 90
5.1 Bridges localization within the Province... 95
5.2 Abutment T y p e s ... 100
5.3 Bent T y p e s ... 100
5.4 Foundation Types ...100
5.5 Seismic Level Identification... 103
5.6 Seismic influence coefficients... 103
5.7 Inventory param eters...104
5.8 GMTH samples... 109
5.9 Pile foundations stiffness and damping constants...116
5.10 Parameters significance comparaison... 117
5.11 Multi Span bridge portfolios in Quebec... 119
5.12 Significant bridge classes in Quebec...119
5.13 Main geometric parameters distributions...121
5.14 Parameters considered in the analysis... 122
5.15 Bridge geometry samples... 125
5.16 ANOVA generic table...128
5.17 ANOVA for the M SSSSteelG irder... 129
5.18 ANOVA sumary...130
5.19 Significant parameter for the defined significant bridge classes...131
6.1 Significant bridge classes in Quebec...141
6.2 Bridge geometry samples... 147
6.3 Significant parameter for the defined significant bridge classes ... 148
6.4 Parameters considered in the analysis...149
6.5 PSDM for the typical bridge classes in Quebec... 151
6.6 Components correlation m atrix for the MSC slab bridge class... 152
6.7 Damage states. Adapted from HAZUS 2003... 153
6.8 Quantitative limit state capacities... 153
6.9 Components fragility curves for the bridge classes in Quebec...156
LIST O F S Y M B O LS
Sym bol D efin ition
( - ) lower level
(+) upper level
a linear regrassion coefficient
A cross section area
A root mean square acceleration
A g gross area
A t median or expected value spectral acceleration
a weight factor
A R L axial load ratio
b linear regrassion coefficient
B block
bww wing wall width
(3 weight factor
Pc log-normal capacity model standard deviation
P c standard deviation of the capacity model
Pd log-normal demand model standard deviation (3d standard deviation of the demand model
c b cost of failure
Ci damping constant of an individual pile
Cr rotational damping constant
C t translational damping constant
c v Vertical damping constant
C A D cumulative absolute displacment
C A V cumulative absolute velocity
C Ig n s global non-structural coefficient of influence
C Ig s global structural coefficient of influence
D duration, Damage and Displacement
Dc column diameter
D i vulnerability of the i l h bridge
Ds superstructure width
8 log-normal of the displacement
A column drift ratio
A ^ i Displacement at the top of a column when the first vertical reinforcing bar at the bottom yields
a6 bent caps flexibility
A c global displacement capacity
Sym bol D efinition
Acol column displacements
Ad global displacement demand
A / foundation flexibility
AP inelastic flexibility
A y elastic flexibility
Ay (i) yield displacement of the subsystem from its initial position to the formation of plastic hinge i
dsi damage state i
E elastic modulus, Young modulus, Error
Ep elastic modulus, Young modulus of a pile
E s elastic modulus, Young modulus
Ey yield energy
€c,max maximum concrete strain
tcu concrete ultimate strain
€s,max maximum steel strain
R
su reduced confinement steel ultimate strain
ec concrete strain
steel strain
E S secondary elements and accessories
F foundation Elements , Force
/ stress
Fb seismic hazard forces
Fc(a) combined fragilities
f'c concrete stress at 28 days
f d importance of the detour
Fi fragility at a period i and component i fragility
Fi{a) specific Bridge i fragility
Fk factor
Fr importance of the road
Fs strategic factor
Fiys system fragility
Fy yielding force
FV
F A age factor
F dll component—i bridge component i exceeding a limit state
F Ctilsystem bridge system exceeding a limit state
Fdist closest distance to fault
F F foundation factor
F R i frequency ratio 1
LIST OF SYMBOLS
Sym bol D efinition
G shear modulus
Gp torsional stiffness of the pile
H height Ht total Height H E hysteretic energy I moment of inertia Ia arias intensity Ic characteristic intensity l v velocity intensity
ly moment of inertia at the y direction h moment of inertia at the z direction
oo infinity
J torsion moment of inertia
K equivalent stiffness
k variables
K d elastomeric bearing plastic stiffness
K e embankment stiffness
hr initial pile inertia
ki stiffness constant of an individual pile
Ki impact stiffness
K r rotational stiffness K t translational stiffness
K u elastomeric bearing elastic stiffness K v vertical stiffness
E\t-t i : wing wall stiffness
L distance from the point of maximum moment to the point of inflexion.
Emr mean span total span ratio
Lp plastic hinge length
L t total Length
X log-normal mean
M moment of magnitude, moment
m mass
Mrnax maximum moment
M ne expected nominal moment
M c0ol over-strength moment
Mu magnitude
M f column design moment based in its plastic capacity M - <j> moment curvature relation
M S mean Square
Sym bol D efin ition
He member ductility capacity and log-normal capacity model median
Hd displacement ductility demand
Hd log-normal demand model median
Ha displacement ductility
H<t> curvature ductility
N equiprobable intervals
n number of replicates
n b number of blocks
flbb number of trials per block
Ni bridge i
n s number of samples
n r number of total runs
N H E normalized hysteretic energy
P deck, Probability and Axial load
P fractional reduction
Pb prioritization value
Pi probability th at the bridge I will be chosen from the bridge combined population
P D F probability density function
P G A peak ground acceleration
P G D peak ground displacement
P G V peak ground velocity
3>
probability function4*max maximum curvature
4*p plastic curvature
<t>u curvature capacity assumed at failure
4>Y system yield curvature
4>y yield curvature
n
upper and lower boundsQ — value quality factor value
R radius of a pile
R 2 determination coefficient
R b — b geometric spreading
Rb bridge fragility based on its resistance
R D I residual displacement Index
R S seismic risk factor
S structural system
Sa—gm spectral acceleration, geometric mean of the fundamental period at the
longitudinal and transverse directions
d,dmg, inelastic damaged inelastic spectral displacement ^ d ,in e la stic inelastic spectral displacement
LIST OF SYMBOLS xvii
Sym bol D efinition
SaT ! spectral acceleration at the fundamental period of vibration
Sc mean of the capacity model
s D mean of the demand model
SdT;3 spectral displacement at the fundamental period of vibration
s vt2 spectral velocity at the fundamental period of vibration
Sa spectral acceleration
a mean of the regression model
&c,Tnax maximum concrete stress
& s,m ax maximum steel stress
Oc concrete stress
steel stress
S S sum of squares
t time
T period, Total
T i d m g post-earthquake vibration periods
Tx fundamental period of vibration
t d strong motion duration
T g m fundamental period of vibration, geometric mean of the longitudinal and
transverse directions
Ti period of vibration i
9 rotation
9m ax capacity distribution
Oi demand distribution
$p plastic rotation capacity
9pi plastic rotation
U union
u(y) demand probabilistic model
^ r e s i d residual displacement
Uq capacity probabilistic model
U g ground displacement
U g ground velocity
U g ground acceleration
Umax maximum displacement
U y yield displacement
V0col overstrength shear
v s soil velocity
V poisson coefficient
X functionality parameter, intensity measure level
z log-normal standard deviation
Sym bol D efin ition
y bridge response
LIST O F A C R O N Y M S
Acronym D efin ition
3D three dimensions
AADT Annual average daily traffic
AASHTO American Association of State Highway and Transportation Officials
ACI American Concrete Institute
ANOVA Analysis of variance
ARL Axial load ratio
ARS Acceleration Response Spectrum
ASCE American society of civil engineers
ASL Antecipated Service Life
ATC Applied Technology Council
CAD cumulative absolute displacment
Caltrans California Department of Transportation
CAN Canadian
CAV Cumulative absolute velocity
CDF Cumulative Diatribution Function
CEISCE Centre d ’etudes interuniversitaires des structures sous charges extremes
CQC Complete quadratic combination
CRGP Centre de recherche en genie parasismique et dynamique
CSA Canadian Standards Association
CSRN Canadian Seismic Research Network
csus
Central and Southeastern United StatesDBE Design Basic Earthquake
DM Demage measures
DOF Degree of freedom
DV Decision variables
EDP Engineering demand parameters
ERE Earthquake Resisting Elements
ERS Earthquake Resisting Systems
FEMA Federal Emergency Management Agency
FHWA Federal Highway Administration
FIB CEP-FIP Federation Internacional du Beton
FORM First order based reliability methods
FQRNT Fonds quebecois pour la recherche sur la nature et les technologies
GC Clayey gravels, gravel-sand-clay mixtures
GIS Geographic information Systems
GM Silty gravels, gravel-sand-silt mixtures
GMTH Ground motion time history
GP Poor graded gravels and gravel sand mixtures
Acronym D efin ition
GS Geotechinical Services
GSC Geological Survey of Canada
GW Well graded gravels and gravel sand mixtures
HE Hysteretic energy
ICS Indice de la capacite structurale
IDA Incremental Dynamic Analysis
IES Indice d ’etat d ’une structure IFS Indice fonctionnel d ’une structure
USEE International Institute of Seismology and Earthquake Engineering
IM Intensity Measure
IVS Indice de la vulnerability sismique
JPSDM Joint probabilistic seismic demand model
JRA Japan Road Association
LHS Latin Hypercube Sampling
LRFD Load and Resistance Factor Design
LS Limit State
LSH logarithmic spiral failure coupled with modified hyperbolic abutment-backfill stress-strain behavior
MCE Maximum Considered Earthquake
MCEER Multidisciplinary Center for Earthquake Engineering Research
MDOF Multiple degrees of freedom
MSC Multi-span Continuous
MSSS Multi span simply supported
NBCC National Building Canadian Code
NBI National Bridge Inventory
NBIP National Bridge Inventory Program
NCHRP National Cooperative Highway Research Program
NHE normalized hysteretic energy
NSERC Natural Sciences and Engineering Research Council of Canada
PDF Probability density function
PEER Pacific Earthquake Engineering Research Center
PGA Peak Ground Acceleration
PGR Preliminary Geology Recommendations
PGV Peak Ground Velocity
PL Performance Level
PS Pre stressed
PSCM Probabilistic seismic capacity model PSDA Probabilistic seismic demand analysis PSDM Probabilistic seismic demand model
LIST OF ACRONYMS xxi
Acronym D efin ition
RQCHP Reseau quebecois de calcul de haute performance
SC Sand-clay mixture
SDC Seismic Design Criteria
SDOF Single degree of freedom
SHL Seismic Hazard Level
SM Sand-silt mixture
SORM Second order based reliability methods
SP Poorly graded sands and gravelly sands
SPL Seismic Performance Level
SRC Seismic Retrofit Category
SRSS Square root of the sum of the squares
SS Single span
sw
Well-graded sands and gravelly sandsTH Time history
THA Time history analysis
TQ Transports Quebec
UCSD University of California in San Diego
UHS Uniform Hazard Spectra
USA United States of America
uses
Unified Soil Classification System USGS United States Geological SurveyWSDOT Washington State Department of Transportation
CHAPTER 1
Introduction
Les dommages causes par les tremblements de terre au cours des dernieres decennies ont montre que la vulnerabilite sismique d ’un systeme de transport est principalement liee aux ponts. Les consequences des dommages causes a ces composants entrainent d ’importantes perturbations sur le reseau de transport. Elies constituent une menace pour les inter ventions d ’urgence et les travaux. II en resulte egalement de graves pertes economiques pour la region. II y a eu une amelioration significative dans la conception des ponts et surtout dans la conception et l’analyse des ponts soumis aux tremblements de terre au cours des dernieres annees. La technologie liee au tremblement de terre s’est amelioree, les cartes d ’alea sismiques ont change, et des nouveaux codes et procedures de conception ont ete developpes. De plus, selon Transports Quebec (TQ) [TQ, 1995], 75% des ponts au Quebec ont plus de quarante ans. Ils ont ete congus avec des codes et des procedures sans les informations actuellement disponibles en matiere de securite sismique. Ainsi, une procedure devaluation de la capacite structurelle et une procedure d ’attenuation des risques sont necessaires pour assurer la securite de toutes les structures. Egalement, pour etre en mesure d ’identifier les ponts les plus critiques apres un seisme, un processus liable d ’evaluation du risque sismique doit etre mis au point specifiquement pour le reseau des ponts du Quebec.
Les processus devaluation du risque sismique sont utilises pour faire des choix rationnels dans la definition des priorites d ’intervention dans un reseau de ponts. Certaines normes de conception de ponts recommandent l’utilisation d ’un processus de selection fonde sur les dommages attendus (ou la vulnerabilite) [MCEER, 2006] et [fib, 2007]. II existe plusieurs methodes d ’analyse pour evaluer les structures. Elies peuvent etre deterministes ou proba- bilistes. En raison de l’incertitude dans les seismes et du caractere aleatoire des proprietes du sol et de la structure, la methode choisie dans cette etude est une methode probabiliste appelee courbes de fragilite. Les fonctions de fragilite sont des outils statistiques servant a estimer la probability d ’une structure d ’atteindre un etat d ’endommagement specifie (etats limites) apres un evenement donne.
Ce projet s’inscrit dans le cadre d ’une recherche sur le comportement, revaluation et l’attenuation des risques sismiques des ponts en beton arme soumis aux charges sismiques, effectuee par le CRGP (Centre de recherche en genie parasismique et en dynamique des
structures) au departement de genie civil de l’universite de Sherbrooke. L’un des pro grammes de recherche du CRGP consiste a evaluer la vulnerabilite sismique des structures. Ce projet fait partie de l’effort realise pour developper un processus devaluation pour les ponts du reseau routier au Quebec. Ce processus de priorisation perm ettra un diagnostic rapide et fiable de l’etat du reseau des ponts au Quebec avant ou apres un evenement sis mique. Une partie cruciale de la mise au point des courbes de fragilite est la definition des etats limites. Une recherche a ete lancee par le CRGP afin de mieux correler les etats lim- ites decrivant l’endommagement observe des poteaux de ponts [FEMA, 2003] aux valeurs a utiliser dans la construction de courbes de fragilite. Plusieurs projets anterieurs du CRGP ont etudie le pont Chemin des Dalles sur l’autoroute 55. C’est pourquoi les poteaux de ce pont sont utilises pour elaborer des etats limites de ce projet. Dans cette etude, les courbes de fragilite sont developpees pour ce pont specifique. Toutefois, revaluation de vulnerabilite est plus interessante quand elle est definie pour l’ensemble du reseau de ponts. Dans cette recherche le reseau de ponts du Quebec est etudie afin d ’identifier les ponts typiques de la region, et des courbes de fragilite sont developpees pour cinq classes de ponts typiques au Quebec.
1.1
Objectifs
L’objectif general de cette recherche est de developper un processus fiable devaluation du risque sismique pour le reseau de ponts au Quebec. Plus precisement, ce projet poursuit les objectifs suivants:
1. Generer des courbes de fragilite pour un pont specifique, le pont Chemin des Dalles sur l’autoroute 55.
2. Identifier et decrire statistiquement les ponts typiques au Quebec. Ces classes iden tifie s doivent representer la majorite du reseau de ponts au Quebec.
3. Generer des courbes de fragilite pour les classes de ponts selectionnees.
1.2
Importance de la recherche
Au Quebec, les processus devaluation des ponts sont limites a des methodes basees sur les indices. La methode ICS de TQ, indice combine d ’une structure, en est un exemple [Roy, 2003]. II manque une methode fondee sur l’estimation des dommages attendus. La reponse d ’une structure varie en fonction de la nature du mouvement du sol, et les methodes basees sur les indices ne tiennent pas compte d ’un evenement specifique. Ce
1.3. STRUCTURE DU DOCUMENT 3
projet fait partie de l’effort du CRGP en vue de developper un processus devaluation fonde sur l’estimation des dommages attendus pour les ponts du reseau routier du Quebec. Werner et al. ont developpe une procedure pour une region specifique des Etats-Unis. La figure 1.1 montre la simulation d ’une evaluation effectuee apres un tremblement de terre en Californie [Werner et al., 2003]. Nielson [Nielson, 2005] montre que les courbes de fragilite peuvent etre utilisees comme des outils probabilistes pour developper un processus de priorisation similaire.
1.3
Structure du docum ent
Le premier chapitre decrit les procedures et les recommandations a suivre concernant le risque sismique des ponts. II commence par une description du code de ponts canadien [CSA/CAN S6, 2006], suivi de la description de trois codes americains, et une revue de l’ensemble des codes internationaux trouves, en particulier le bulletin FIB CEB-FIP 39, 2007. Le deuxieme chapitre presente egalement des informations trouvees dans la littera- ture. II commence tout d ’abord par une description de Palea sismique au Quebec. Ensuite, PICS est presente ainsi que les methodes de developpement des courbes de fragilite.
Le troisieme chapitre est consacre a l’elaboration des courbes de fragilite pour le pont Chemin des Dalles sur Pautoroute 55. Dans ce chapitre, la methode developpee par Nielson [Nielson, 2005] est simplifiee et appliquee a un pont specifique. Puisque la nature du modele en elements finis du pont est deterministe, la representation numerique est plus detaillee.
Les quatrieme et cinquieme chapitres definissent le reseau de ponts du Quebec. Ils decrivent les parametres des ponts utilises pour definir les incertitudes structurelles dans le modele probabiliste en elements finis developpe pour les ponts typiques du Quebec. Le
chapitre six traite du developpement des courbes de fragilite pour les classes de ponts typiques du Quebec. Enfin, le dernier chapitre est une conclusion du pro jet de recherche et donne des recommandations d ’etudes complementaires qui pourraient etres realisees.
Introduction
Earthquake damages in recent decades have revealed that the seismic vulnerability of a transportation system is mostly due to bridges. The consequences of damage to these components include significant disruption on the transportation network, posing a threat to emergency response and recovery as well as resulting in severe economic losses for the region. There has been significant improvements in bridges design and mostly in earth quake bridge design and analysis in the past few years. The earthquake technology has improved, the maps of Seismic Hazard have changed and new codes and design proce dures have been developed. On the other hand, according to Transports Quebec - TQ, [TQ, 1995], 75% of Quebec’s bridges have more than forty years. They were designed with codes and guidelines without the information now available in seismic safety. Thus, a structural capacity evaluation and risk mitigation procedure is needed to assure the safety of all structures. Moreover, to be able to identify the most critical bridges after a seismic event, a reliable prioritization screening process need to be developed specifically for the Quebec bridge network.
Screening process are used to allow rational choices in assessing a priority of interven tion in a bridge network. Some bridges design codes recommend the use of a screening process based on the expected damage (or vulnerability) estimation [MCEER-06 - S P 10, 2006] and [fib, 2007]. There are several analytical methods to assess structures. They can be deterministic or probabilistic. Due to uncertainty in earthquake ground motions, and randomness of soil and structure properties the method chosen in this study is a proba bilistic method called fragility curves. Fragility functions are statistical tools to estimate the probability of a structure being in one or more specified damage states (limit states) after a given event.
This project is part of a research about the behavior, the seismic evaluation and risk mit igation of reinforced concrete bridges under earthquake loads developed in the Universite de Sherbrooke’s civil engineering department by the CRGP (Centre de recherche en genie parasismique et dynamique - Earthquake engineering and dynamics research group). One of the CRGP research programs involves the structural seismic vulnerability evaluation. This project is part of an effort to develop a screening process for the bridge network in Quebec. This prioritization process will allow a fast and reliable diagnostic of Quebec’s bridge network condition before or after a seismic event. A crucial part of the development of the fragility curves is the definition of the limit states. W ithin the CRGP, a research
has been started to better correlate the description of the observational bridge c o lu m n s limit states [FEMA, 2003] and the values to be used in the construction of fragility curves. Since previous projects in CRGP were developed using the Chemin des Dalles bridge over highway 55, these columns are used to develop the limit states used in this project. In this study, fragility curves are developed for this specific bridge. However, the vulnerability assessment is more interesting when it is defined for a entire network of bridges. In this research the bridge network in Quebec is studied to identify the typical bridges in the region. And, fragility curves are developed for five typical bridges portfolios in Quebec.
1.4
Objectives
This research general objective is to develop a reliable screening process for the bridge network of Quebec. More specifically, this project has the following objectives:
1. To generate fragility curves for a specific bridge, the Chemin des Dalles bridge over highway 55.
2. To identify and statistically describe the typical bridges in Quebec. These identified classes should represent the majority of the bridge network in Quebec.
3. To generate fragility curves for the selected bridge classes.
1.5
Research significance
In Quebec, the screening process is restricted to indices based methods, the TQ method: combined index (ICS - Indice combine d ’une structure) is an example [Roy, 2003]. There is a lack of a method based on the expected damage estimation. The response of a structure changes according to the nature of the ground motion, but indices methods do not consider a specific event. This project is part of an effort from the CRGP to develop a screening process based on expected damage estimation for Quebec’s bridge network. [Werner et al., 2004] developed screening process for a specific region in the United States. Figure 1.2 shows the simulation of a screening after the occurrence of a earthquake in California [Werner et al., 2003]. Nielson [Nielson, 2005] show th at fragility curves can be used as probabilistic tools to develop similar prioritization process.
1.6. DOCUMENT STRUCTURE 7
Figure 1.2 Screening of a bridge network (Werner, 2004)
1.6
D ocu m ent Structure
The first chapter describes the procedure and recommendations for the seismic risk of bridges. It starts with a description of the Canadian Code for Highway Bridges [CSA/CAN S6, 2006], followed by the description of three American codes, and a overview of the codes found internationally with emphasis in the FIB CEB-FIP Bulletin 39, [fib, 2007]. The second chapter also presents information found in the literature. It starts with a description of the seismic hazard in Quebec. Then, the TQ ICS is presented followed by the fragility curves methods.
The third chapter consists in the development of fragility curves for the Chemin des Dalles bridge over highway 55. In this chapter the method developed by [Nielson, 2005] is simplified to be applied for a specific bridge. Since the nature of the bridge finite element model is deterministic the numerical representation is more detailed.
The fouth and fith chapters define the bridge network in Quebec. They describe the bridge parameters used to define the structural uncertainties in the probabilistic finite element model developed for the typical bridges in Quebec. Chapter six is the development of the fragility curves for the typical bridge classes in Quebec. And the last is a conclusion of this study and the recommendation of further studies to be developed within this research project.
CHAPTER 2
Seismic Risk Procedures and Recommenda
tions
Following the 1989 Loma Prieta Earthquake, bridge engineers have faced three essential challenges: (i) to ensure that earthquake risks to new bridge construction are acceptable; (ii) to identify and correct unacceptable details which may make existing bridges vulner able to seismic events; and (iii) to develop and implement rapid, effective, and economic response mechanisms for recovering structural integrity after damaging earthquakes. Per formance based design have been developed for the design and retrofit of im portant bridges mostly in California, USA. In this Chapter, bridge codes and procedures will be at first described and compared. Emphasis will be applied to the most recent, the ones including performance based design and mainly to the bridge assessment methods presented.
Performance-based criteria included guidelines for development of site-specific ground mo tion estimates, ductile design details to avoid brittle failure modes, rational procedures for concrete joint shear design, and the definition of limit states for various performance objectives. The performance-based criteria usually require a two or more level design approach. The first level of design is to ensure the performance (service) of a bridge in small-magnitude earthquake events th at may occur several times during the life of the bridge. The second level of design is to achieve the performance (no collapse) of a bridge under severe earthquakes that have only a small probability of occurrence during the useful life of the bridge. Intermediary levels can also be included.
In this chapter, design codes and recommendations for seismic design of bridges will be discussed. First, the Canadian bridge design codes, some of the USA Bridge codes will also be presented. Then, a brief description of some seismic design codes from around the world with emphasis to the FIB CEB-FIP Bulletin 39, 2007 [fib, 2007]. The points com pared for each reference are: (i) performance objectives, damage levels and displacements limits when applied; (ii) seismic hazard; (iii) non-linear suggested methods; (iv) structures models recommendations when applied and (v) prioritization screening process.
2.1
Canadian Code for Highway Bridges
The Canadian Code for Highway Bridges applies to the design, evaluation and struc tural rehabilitation design of fixed and movable highways bridges. Section 4 is specifically dedicated to the seismic design of highway bridges. Bridges designed and detailed in ac cordance to this chapter may suffer damage, but should have low probability of collapse due to seismically induced ground motion. Two main principles are used in Chapter 4: (a) small to moderate earthquakes should be resisted with structural components remain ing essentially elastic; and (b) exposure to shaking from large earthquakes should not cause bridge collapse. Moreover, the damage th at occurs should be detectable and ac cessible for inspection and repair. The seismic evaluation of existing bridges is located in section 4.11 of the CAN/CSA-S6-06, 2006 [CAN/CSA-S6-06, 2006]. It provides provi sions for emergency-route bridges and other bridges, with lifeline bridges requiring special studies. Such provisions include minimum analysis requirements, load factors and combi nations, and appropriate procedures to evaluate capacities of existing structural elements taking into account as-built details. The CAN/CSA-S6-06, 2006 [CAN/CSA-S6-06, 2006] recognizes the important role th at the regulatory authority plays in setting appropriate analysis and design requirements for evaluating existing bridges. Therefore, adjustm ents to the evaluation procedure are permitted if approved by the regulatory authority. Such adjustments include changes to the required analysis method, accounting for the remaining service life of the bridge, and load cases to be considered. Moreover, the CAN/CSA-S6-06, 2006 [CAN/CSA-S6-06, 2006] provides general guidance on various seismic rehabilitation techniques for existing bridges. The CAN/CSA-S6-06, 2006 [CAN/CSA-S6-06, 2006] also requires th at some key design aspects be investigated when assessing seismic rehabilitation measures.
The bridges shall be classified into three importance categories: Lifeline bridges, Emer gency route bridges and Other bridges. The procedures are based on a single seismic level: the design earthquake (475-years return period), but the performance objectives include the behavior for low to moderate earthquakes and for large earthquake (1000-year return period). Table 2.1 shows the requirements for each performance level. Lifeline bridges require special studies to evaluate their seismic performance. Two damage levels are de fined: moderate and significant damage. Table 2.2 defines each level in accordance with the functionality and repair procedure of the bridge.
The seismic performance zones showed in Table 2.3 reflects the variation in seismic risk across the country (based on the zonal acceleration ratio) and are used to specify require ments for analysis methods, minimum support lengths, design procedures and detail. The
2.1. CANADIAN CODE FOR HIGHWAY BRIDGES 11
Table 2.1 Performance objectives m atrix [CAN/CSA-S6-06, 2006]. Return period Lifeline Em ergency-route Others Low to M oderate
seismic intensity
Imm ediate Use traffic for all
vehicles
Im m ediate Use traffic for all
vehicles
Im m ediate Use traffic for all
vehicles Design Earthquake
return period of 475 years
Imm ediate Use traffic for all
vehicles Im m ediate Use traffic for urgency vehicles Reparable dam age Large Earthquake return period of 1000 years Im m ediate Use traffic for urgency vehicles Reparable dam age No collapse
Table 2.2 Damage Levels [CAN/CSA-S6-06, 2006].
Damage Level Functionality Repair
M oderate
Open im m ediately for emergency vehicles and lim ited access within a few days for normal traffic
No collapse.
Repair to full strength w ithout full closure
Significant
Limited access to emergency and light traffic after a few days Normal traffic not available until full repair is completed.
N o collapse. Repair can take several weeks or months
analysis of the structures are distinct for new structures and for existing structures. The seismic zones are based on a statistical analysis of historical earthquake records according to the National Building Code of Canada NBCC 1995 [NRC, 1995]. Table 2.4 shows the required methods for new structures and Table 2.5 for existing structures.
Table 2.3 Seismic performance zones
[CAN/CSA-S6-06, 2006]. PH A for 10% in 50 years Zonal acceleration ratio A Lifeline bridges Emergency route and others 0.00 < P H A < 0.04 0.00 2 1 0.04 < P H A < 0.08 0.05 2 1 0.08 < P H A < 0.11 0.10 3 2 0.11 < P H A < 0.16 0.15 3 2 0.16 < P H A < 0.23 0.20 3 3 0.23 < P H A < 0.32 0.30 4 4 0.32 or greater 0.40 4 4
Table 2.4 Analysis methods for new structures [CAN/CSA-S6-06, 2006],
Security Bridges Urgency bridges Others ZPZ Regular Irregular Regular Irregular Regular Irregular
1 s /o s /o None None N one None
2 MM MM UL MM UL SM
3 MM TH MM MM UL MM
4 MM TH MM MM SM MM
N otes : None = N o seism ic analysis required. UL = Uniform load m ethod.
SM = Elastic analysis of the single-m ode spectral m ethod. MM = Elastic analysis of the m ulti-m ode spectral response. TH = Tim e-H istory m ethod. M ethod application needs ap proval. T he m ulti-m ode m ethod can be applied in certain cases.
2.2
USA Codes for Highway Bridges
2.2.1
M CEER-06-SP10, 2006
The MCEER-06-SP10, 2006 [MCEER- 06-SP10, 2006] is a manual containing procedures to evaluate and upgrade the seismic resistance of existing highway bridges. It contains a screening process to identify and prioritize bridges in a seismic evaluation for retrofitting, a methodology to evaluate bridges seismic capacity and the appropriate retrofit method. It
2.2. USA CODES FOR HIGHWAY BRIDGES 13
Table 2.5 Analysis methods for existing structures
[CAN/CSA-S6-06, 2006].
ZRS
Independent frames M ultiple frames
Emergency-route
Others Em ergency-route Others Regular Irregular Regular Irregular
1 None None None None None None
2 None None LE LE None None
3 LE None SM MM LE LE
4 LE LE MM MM SM MM
N otes : None = No seismic analysis required. LE = Limited seism ic evaluation required.
SM = Elastic analysis of th e single-m ode spectral m ethod. MM = Elastic analysis of th e m ulti-m ode spectral m ethod.
describes retrofitting approaches and corresponding techniques for increasing the seismic resistance of bridges.
The seismic assessment evaluation is divided in two different seismic levels: Low and Upper Level Earthquake. The seismic rating methods can be divided in seismic rating methods using indices and seismic rating methods using expected damage. Both methods are quantitative and qualitative. The qualitative part modifies the rank in a subjective way accounting for bridge importance, network redundancy, non-seismic deficiencies, an ticipated service life and similar factors. For the indices based method the quantitative part produces a seismic rating (called bridge rank, R ) based on structural vulnerability and seismic hazard. Expected damage based rating methods compares the severity of expected damage for each bridge in the network inventory, for the same earthquake and ranks each bridge accordingly. The quantitative part is based on expected damage and repair costs. The methods lead to a priority index as indicated in equation (2.1).
P = f ( R , importance, non-seismic, and other factors) (2.1)
Although both methods equation have the same form they are calculated in different ways. The estimation of expected damage is a critical step in this method and it is a probabilistic one. Fragility functions are used to estimate the probability of a bridge being in one or more specified damage states, after a given earthquake. In another words it evaluates for different performance levels the probability of the bridge, when subjected to seismic events, trespassing a given limit state. The seismic capacity evaluation begins with the definition of the performance level. In the MCEER-06-SP10 [MCEER-06-SP10, 2006], there are 4
performance levels. No Damage: minimum level of performance; Life safety: significant damage is sustained and service is disrupted, but life safety is preserved; Operational: damage is minimal (reparable with or without restrictions in the traffic) and service for emergency vehicles should be available after inspection and; Fully Operational: damage is negligible (reparable without restrictions in the traffic) and full services are available for all vehicles. The Fully Operational level of performance is one of the improvements in the MCEER-06-SP10 [MCEER-06-SP10, 2006]. Table 2.6 shows the classification procedure presented. The bridge is classified for its importance and anticipated life time. The importance classification divides bridges into essential (those th a t have to function after an earthquake) and standard (all the others). The classification based on the bridge service life time is another improvement in the MCEER-06-SP10 [MCEER 06-SP10, 2006]. There are three different anticipated life time periods: 0-15 years, .16-50 years and more than 50 years.
Table 2.6 Minimum performance levels for retrofitted bridges [MCEER 06-SP10, 2006].
Bridge Im portance
Earthquake Ground Standard Essential
M otion Service Life Category
ASL 1 ASL 2 ASL 3 ASL 1 ASL 2 ASL 3 Lower Level 50% in 75
years, return period about 100 years
Upper Level 7% in 75 years, return period about 1000 years
PL0 PL3 PL3 PL0 PL3 PL3
PL0 PL1 PL1 PL0 PL1 PL2
Notes: 1. Service Life categories: ASL 1: 0-15 years ASL 2: 16-50 years ASL 3: > 50 years 2. Performance Levels: PL0: No minimum level
PL1: Life Safety PL2: Operational PL3: Fully Operational
The expected performance level pertains to two different levels of ground motion. The Lower Level - 50% probability of exceedance in 75 years, with a return period of about 100 years and the Upper Level - 7% probability of exceedance in 75 years, with a return period of about 1000 years. The seismic hazard level (SHL) is determined by the intensity of ground shaking below the surface and the amplification of this in the surface motion by the overlaying soils. Table 2.7 combines these two factors in order to define the SHL at a bridge site. The SHL is defined by the site factors Fa and Fs combined with the
![Table 2.2 Damage Levels [CAN/CSA-S6-06, 2006].](https://thumb-eu.123doks.com/thumbv2/123doknet/3327580.95920/36.922.198.766.771.965/table-damage-levels-can-csa-s.webp)
![Table 2.3 Seismic performance zones [CAN/CSA-S6-06, 2006]. PH A for 10% in 50 years Zonal acceleration ratio A Lifelinebridges Emergency route and others 0.00 < P H A < 0.04 0.00 2 1 0.04 < P H A < 0.08 0.05 2 1 0.](https://thumb-eu.123doks.com/thumbv2/123doknet/3327580.95920/37.921.232.705.229.502/table-seismic-performance-years-zonal-acceleration-lifelinebridges-emergency.webp)
![Table 2.9 Minimum performance requirements [MCEER-06-SP10, 2006].](https://thumb-eu.123doks.com/thumbv2/123doknet/3327580.95920/41.1188.206.966.165.608/table-minimum-performance-requirements-mceer-sp.webp)
![Figure 2.3 Global demand displacement estimate for frames [Caltrans, 2006].](https://thumb-eu.123doks.com/thumbv2/123doknet/3327580.95920/45.920.125.795.726.961/figure-global-demand-displacement-estimate-for-frames-caltrans.webp)
![Figure 2.4 Global displacement capacity estimate [Caltrans, 2006].](https://thumb-eu.123doks.com/thumbv2/123doknet/3327580.95920/47.918.225.691.250.899/figure-global-displacement-capacity-estimate-caltrans.webp)
![Table 2.12 Field Observation Damage Definition [Caltrans, 2006].](https://thumb-eu.123doks.com/thumbv2/123doknet/3327580.95920/50.924.135.809.112.1076/table-field-observation-damage-definition-caltrans.webp)
![Table 2.15 Definition of the observational damage states, [fib, 2007].](https://thumb-eu.123doks.com/thumbv2/123doknet/3327580.95920/60.922.129.826.139.1022/table-definition-observational-damage-states-fib.webp)
![Table 3.2 Seismic influence coefficients [Filiatrault et al., 1994].](https://thumb-eu.123doks.com/thumbv2/123doknet/3327580.95920/76.924.184.760.117.497/table-seismic-influence-coefficients-filiatrault-al.webp)
