Other uses, including reproduction and distribution, or selling or
licensing copies, or posting to personal, institutional or third party
websites are prohibited.
In most cases authors are permitted to post their version of the
article (e.g. in Word or Tex form) to their personal website or
institutional repository. Authors requiring further information
regarding Elsevier’s archiving and manuscript policies are
encouraged to visit:
Effects of presenting forest simulation results on the forest values and attitudes of
forestry professionals and other forest users in Central Labrador
Kati Berninger
⁎
, Daniel Kneeshaw, Christian Messier
Centre d'Étude de la Forêt (CEF), C.P. 8888, succursale Centre-ville, Montréal, QC, Canada H3C 3P8a b s t r a c t
a r t i c l e i n f o
Article history: Received 11 March 2008
Received in revised form 4 November 2008 Accepted 21 November 2008 Keywords: Attitude change Attitude formation Forest simulation SELES Scale SFM
This research tested whether demonstration of the long term effect of different forest management scenarios in a large forested area changes people's forest values and attitudes. Forestry professionals and other forest users in Central Labrador were shown simulation results of three alternative forest management scenarios illustrating possible long term effects on various indicators. Forest values and attitudes towards forestry were measured before and after the presentation. Our conception of values and attitudes is based on the cognitive hierarchy model of human behaviour which states that values are more enduring and more difficult to change than attitudes. It was thus hypothesized that attitudes would change but not values and that change in forestry professionals would be less than in other forest users since foresters are trained to think about long-term effects and large-scale processes of forest management scenarios. We also hypothesized that a greater number of people would have an opinion on forest management after the presentation. All three hypotheses were partially supported by the results. The results indicated that some attitude change occurred, but that values also changed somewhat. Most of the significant changes occurred when persons with no clear opinion on several forest-related questions formed an opinion. Long-term, landscape simulation results provide valuable information and enhance understanding of both forestry professionals and other forest users. However, being provided the same information, the two groups learned different things. While forest users gained more confidence in the current forest management plan and were motivated to further participate, professionals learned more specific things. This reflects differences between technical and local knowledge.
© 2008 Elsevier B.V. All rights reserved.
1. Introduction
In order to move toward sustainable forest management (SFM), we need to ensure intergenerational equity which means that future generations should have a forest environment and resources that offer the same opportunities as those that we have today (Adamowicz and Burton, 2003). Forest management planning therefore needs to consider the long-term effects of different scenarios on multiple attributes, not just wood fibre, at time-scales up to or exceeding several human generations. Research in forest ecology has also shown a need to better understand processes at large spatial scales (over 100,000 ha, Hunter, 1990; Levin, 2000; Turner et al., 2001). It is difficult for forest managers to understand all the changes and possible interactions that occur over large temporal and spatial scales that exceed our first-hand perceptions (Daniels and Walker, 1996; Messier and Kneeshaw, 1999). This is even more difficult for local people who are taking part in participatory planning processes; now a normal procedure in SFM planning. Modern technology in the form of
modeling tools can be used to demonstrate the effect of different management options over the long term and for large scale processes (Messier et al., 2003; Sturtevant et al., 2007).
The quality of the interaction between forest managers and local people is an important factor affecting the success of participatory planning processes (Buchy and Hoverman, 2000; Thompson et al., 2005). Interactions include communicating potential management alternatives of the plan at hand. Simulations produced with modeling tools that illustrate how forest conditions described by various key indicators are likely to change in the future allow us to compare and contrast the effects of different scenarios over long term and large spatial scales, which should improve the comprehension of the potential consequences of each forest management alternative (Fall et al., 2001). Recently, increasing efforts have been made to present simulation results to the public in an easily understandable form using appropriate graphic formats (Sheppard and Meitner, 2005). The approach is laborious and time-consuming, and its efficiency in communicating forestry issues with different forest user groups has yet to be evaluated.
One way to assess the quality of communication is to examine if it changes the attitudes of the participants (Bright and Manfredo, 1997). Therefore, this study tests whether the presentation of the long term
⁎ Corresponding author. Tel.: +1 514 987 3000x4819; fax: +1 514 987 4647. E-mail address:[email protected](K. Berninger).
1389-9341/$– see front matter © 2008 Elsevier B.V. All rights reserved. doi:10.1016/j.forpol.2008.11.002
Contents lists available atScienceDirect
Forest Policy and Economics
effects of different forest management strategies in a large area change people's forest values and attitudes.
2. Theoretical framework and hypotheses
Many theories in social psychology assume that attitudes are formed and modified through a process of cognitive learning when people gain information about attitude objects, in this case forests (Eagly and Chaiken, 1993, p. 257). Previous studies indicate that a high level of prior knowledge on an issue leads to more resistance to change (Petty and Carcioppo, 1986). On the other hand, familiarity creates mental structures that enable quicker development of solutions to similar problems; one knows what to pay attention to and this also facilitates the prediction of the consequences of planned management actions (Kaplan and Kaplan, 1982, pp. 164–166). This means that experts like forestry professionals should be able to more clearly understand and interpret information related to their technical knowledge compared to lay people. The readily available cognitive structures also involve increased risk of not seeing new things: experts have been shown to be highly selective of the new information they are willing to consider (Kaplan and Kaplan, 1982, p. 169). Thus we predict that the attitudes of forestry professionals should change less than those of other forest users.
In contrast to much of earlier work on attitude change like that of Eagly and Chaiken (1993), we differentiate between values and attitudes. Our study was thus based on the cognitive hierarchy model of human behaviour that consists of values, value orientations, attitudes, behavioural intentions and behaviours that hierarchically build upon each other (Rokeach, 1973; Rokeach 1979; Fulton et al., 1996; Vaske and Donnelly, 1999). According to this theory, values are more enduring and more difficult to change than attitudes that are less fundamental in the cognitive hierarchy (Vaske and Donnelly, 1999). This theoretical basis leads us to assume that there would be no or little change in the responses for questions measuring values, whereas change would occur in questions measuring attitudes.
Earlier work on attitude change on forest-related issues shows that providing more information on issues often results in more people forming an opinion or, in other words, changing away from neutral or uncertain positions (Bright and Manfredo, 1997; Seekamp et al., 2006). We expect that providing more information would thus enhance opinion forming and that the greatest information effects would occur with undecided participants.
Following the theoretical and empirical basis presented above, we hypothesize that:
1. People will modify their attitudes, but not their values, following a presentation of simulation results.
2. Changes will be towards forming an opinion, and greatest changes will occur among undecided participants.
3. There will be less change among the forestry professionals than among the other forest users since forestry professionals are trained to think about long-term effects and large-scale processes. 3. Methods
3.1. Study area, modeling and simulations
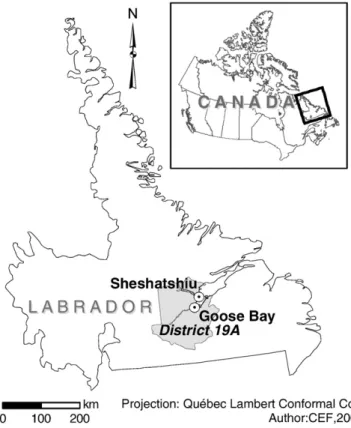
The study was conducted on people living in or near Happy Valley— Goose Bay and based on modeling of forest management scenarios for the forest management District 19A in Central Labrador. Although District 19A has a forest cover of 1.2 million ha, the total land area extends to 2.1 million ha (Fig. 1). The town of Happy Valley— Goose Bay has a population of about 8000 while the Innu community of Sheshatshiu has about 1200 inhabitants.
The forest management plan for District 19A has been elaborated and is being implemented in collaboration between the government
of Newfoundland and Labrador and the Innu Nation. The plan was developed based on an approach where the maintenance of cultural and ecological values is a first priority that is addressed by an extensive network of conservation areas covering approximately 50% of the territory. The remaining areas, about half of the forest area, are available for logging (Forsyth et al., 2003). This is why we did not feel it was necessary to test a scenario with a greater proportion of conservation.
In order to provide a comprehensive tool for local planning needs, a forest management simulation model at the landscape scale for District 19A was developed as a joint venture involving various experts and local people (Sturtevant et al., 2007). Simulations were run using the SELES (Spatially Explicit Landscape Event Simulator) modeling tool (Fall and Fall, 2001). Three main forest management scenarios were simulated:
1) a no conservation scenario without protected areas to represent the previous status quo, with a harvest level of 581,900 m3/year
2) a scenario based on the current 20 year management plan which was established in 2003 reflecting indigenous and other local values; harvest level 222,500 m3/year, and
3) an alternative plan scenario established to reduce fragmentation and that includes large protected areas, but not the small habitats and special features that are protected in the current plan; harvest level 312,300 m3/year.
We also evaluated two variations of scenario two (the current plan) based on different harvesting patterns within the management area. These variations include large (5–40 ha) and small (1–10 ha) cut blocks. The simulations were run from 200 to 400 years. All scenarios were designed for sustainable timber supply which means that no reduction in the volume of wood was permitted over the long term (400 years).
The long term effects of each scenario on area cut, volume of growing stock, stand age, road building and the area of old forest in
Fig. 1. The study area constitutes the forest management District 19A in Central Labrador, Canada.
each forest type was evaluated in order to present the results to the participants. The number of indicators used was limited since we wanted to reduce the cognitive load to the participants. The goal was to select indicators that reflect the important factors and preferred indicators suggested by the local people as described in Berninger et al. (2009). The amount of roads is both used as an economic indicator of logging costs and an ecological indicator of habitat fragmentation. Currently there are only few roads in the area and new roads will have to be built in order to access new logging areas. Road construction can be perceived as an advantage in terms of access or a disadvantage in terms of fragmentation and increase of human influence in areas previously inaccessible. The area of old-growth forest in each forest type is used as a coarsefilter indicator of the maintenance of the ecological integrity of the forest. A significant decline in old-growth forest of any forest type is interpreted as a risk for some species to disappear from the area.
Our goal was to develop illustrations of the long term effects of each scenario on the above described indicators over the whole wide ranging planning area to be shown to the participants. Photorealistic visualization has been suggested as an effective method for making forestry planning information more understandable for lay people, including indigenous communities (Sheppard et al., 2004; Sheppard and Meitner, 2005). However, photorealistic visualization techniques are not necessarily the best solution in a large and heterogeneous area or when time series are required (Wilson and McGaughey, 2000). Photorealistic visualization may be appropriate at the stand level or when visual effects of logging are demonstrated at a landscape level. It has, however, certain limitations when it comes to illustrating time series at a landscape level, and its use is time intensive. In this study, we decided to use a combination of illustration techniques: simple maps as output from SELES at different time periods (20, 50, 100, 200 and for roads 400 years, an example is shown inFig. 3) showing the whole planning area as well as graphs and tables made using numerical data output from SELES (examples are presented inTable 1,Figs. 2 and 3). It can be argued that graphs, as the one shown inFig. 2, are the most effective in showing time series.
3.2. Recruitment, meetings and participants
The target group for this research project included residents of the Happy Valley— Goose Bay region in Central Labrador that are either forestry professionals or other forest users. This second group includes environmentalists, hunters, berry and mushroom pickers, recreational users of the forest, the Metis and the Innu. The forestry professionals group includes representatives from both the government forest resource management division and the forest industry. The aim of comparing forestry and non-forestry groups was to contrast the forestry professionals' expert view with that of local knowledge (Failing et al., 2007). Some of the participants had previously been active in the planning process, but they were assumed to have a different level of technical knowledge than forestry professionals. The Innu could have formed their own group, but their self-reported
learning and opinion change was close to the average of other forest users (Sturtevant et al., 2007) and we chose to form one group of non-fibre forest users to enhance clarity and statistical power.
We organized five meetings on September 19th–22nd and November 30th, 2006 in Goose Bay and Sheshatsiu. The participants were invited by email, by telephone and using a newspaper advertisement. In Sheshatsiu, participants were invited by posters that were distributed in the community. We invited the participants to come to a central facility, since we wanted to present the simulation results in order to test their effect on forest values, attitudes and preferences. We also wanted to give the participants an opportunity to reflect thoroughly on the issue and questions at hand as well as to get their feedback immediately after presenting the simulation results. Our approach with meetings and discussions of the message content is similar to that ofSeekamp et al. (2006). In the seminar for the Innu in Sheshatsiu, questions were interpreted by an Innu translator when needed. Assistance was also provided infilling in the questionnaires.
Table 1
An example of simulation results shown to the participants: the annual level of harvesting and area harvested, mean harvest age and roads built in each of the three main scenarios
Harvest level/year
Mean annual area harvested in 400 years Mean harvest age in 400 years Roads built in 400 years 1. No conservation scenario 581,900 m3 5140 ha 133 years 2060 km 2. 20 year plan scenario 222,500 m3 2010 ha 39% of scenario 1 121 years 1040 km 3. Alternative plan scenario 312,300 m3 2840 ha 55% of scenario 1 119 years 990 km
Fig. 2. Example of simulation results presented in the meetings: development of the area of a rare forest type over 100 years and over 120 years in the three main scenarios. In the no conservation scenario (a) there would be no forest over 120 years old left in this forest type for a long time period and very little forest over 100 years old around year 140 of simulation. In the 20 year plan scenario and the alternative plan scenario that includes the large protected areas, but not small habitats and special features (b), the area of old forest in this forest type is reduced but stabilizes over time.
In the meetings, participants were explained the objectives of the study and the contents of the questionnaire and they were given time tofill in the first questionnaire. After that, simulation results were presented using PowerPoint slides including maps, tables and graphs
of the effect of the three main scenarios and the effects of variations in the current plan as described above. After the presentation each group had an opportunity for discussion and for commenting on the results. Comments were used for further development of the model
Fig. 3. An example of simulation results shown to the participants: development of stand age under the no conservation and the 20 year plan scenarios from year 20 to year 200.
Table 2
Questions used in the study and the ones included in the anthropocentric value score (Berninger and Kneeshaw, in review) Included in the anthropocentric value score Low before n = 28 after Neutral before n = 19 after High before n = 26 after Questions measuring forest values
Forests give me a sense of peace and well-being 4.82 4.89 4.53 4.47 4.46 4.42
Forests should be left to grow, develop, and succumb to natural forces without being managed by humans 3.15 3.19 3.05 3.53 3.50 3.27
Forests should be managed to meet as many human needs as possible 2.54 2.25 3.26 2.84 4.15 4.23
Forests let me feel close to nature 4.89 4.89 4.77 4.58 4.68 4.44
Wildlife, plants, and humans should have equal rights to live and develop 3.75 3.75 4.00 4.05 4.38 4.04
It is important to maintain the forests for future generations 4.96 4.93 4.74 4.79 4.76 4.56
Forests should exist mainly to serve human needs x 1.57 1.29 2.79 2.47 4.24 3.88
Forests should have the right to exist for their own sake, regardless of human concerns and uses 3.43 3.21 2.16 3.32 3.85 3.58 The primary function of forests should be for the products and services that are useful to humans x 1.67 1.57 2.84 2.74 4.36 3.80⁎
Humans should have more respect and admiration for the forests 4.64 4.64 3.37 4.84⁎ 4.73 4.58
It is a waste of our natural resources if forests are not used for human benefit x 2.04 2.25 3.32 3.11 4.16 4.20
Questions measuring attitudes towards forest management
Logging spoils the landscape 3.52 3.63 3.61 3.78 3.50 3.69
A managed forest is beautiful 3.04 3.55⁎⁎ 3.32 3.16 4.46 3.92⁎
Forests are currently being managed for a wide range of uses and values, not just timber 3.29 3.54 3.89 4.11 3.92 3.88
Current forest management does a good job in including environmental concerns 3.18 3.18 3.79 3.84 3.84 4.04
Central Labrador has enough protected areas 2.11 2.26 2.63 2.95 3.13 3.52
There will be sufficient wood in Central Labrador to meet our future needs 3.00 3.19 2.47 3.21⁎ 3.76 3.52
The present rate of logging is too great to sustain our forests in the future 2.89 2.93 3.16 2.63 3.38 3.21
Forests are being managed successfully for the benefit of future generations 2.81 3.07 3.37 3.32 3.54 3.58
The economic benefits from forestry usually outweigh any negative consequences 2.07 2.07 2.53 2.53 3.76 3.76
Economic stability of communities is more important than setting aside forests from logging 1.71 1.85 3.33 2.33⁎ 3.73 3.92 When making forest decisions, the concerns of communities close to the forest should be given higher priority
than other distant communities
4.11 3.52⁎ 3.50 3.56 4.38 3.88⁎ Forests in the region are currently managed in such a way that they are well suited for recreation use 3.29 3.25 3.11 3.68⁎ 4.04 3.81 Forests in the region are currently managed in such a way that they are well suited for berry and mushroom
picking
3.29 3.25 3.53 3.63 4.00 3.88 Forests in the region are currently managed in such a way that they are well suited for hunting 3.36 3.36 3.79 3.68 3.73 4.08 Mean value and attitude scores for statements measured before and after presenting forest simulation results by anthropocentric value orientation (low, neutral or positive anthropocentric value orientations).⁎=significant difference between before and after values according to Wilcoxon sign-rank test p≤0.05, ⁎⁎=p≤0.01.
(Sturtevant et al., 2007). When there were no more issues to discuss, the participants filled in the second questionnaire. The first and second questionnaires were identical, but background information on the participants was only collected once and at the end of the second questionnaire the participants were asked to do a self evaluation of their learning and change of opinions during the meeting.
We used self-administered questionnaires with questions adapted from McFarlane and Boxall (2000) measuring forest values and attitudes towards forest management (Table 2). Questions on multiple uses of the forests and the effects of forestry on the visual quality of the landscape were added. Afive-level Likert scale was used in the questions with the lowest point being“totally disagree”, the highest point“totally agree” and the middle point “not sure”.
A total of 80 persons answered both questionnaires (Table 3). There were only two women in the forestry professionals group, while about 42% of the other forest users were women. The mean age of the forestry professionals was not significantly different from the mean age of other forest users but the annual income and the share of university education was higher in the forestry professionals group than among other forest users. The mean age of forestry professionals was slightly higher than in studies byMcFarlane and Boxall (2000)in Alberta, andBerninger (2007)in Quebec. The proportion of forestry professionals with an income of $ 70,000 or more was lower than in a study carried out in Quebec (Berninger, 2007). The Innu and Metis were represented in both groups.
3.3. Data analysis
Qualitative responses to the questions“What did you learn” and “How did your opinions change” were in a written form and they were generally short and clear. They were classified by the main researcher into groups according to their main message (Tables 4 and 5).
A Wilcoxon sign-rank test was used to test whether the answers before and after the presentation of the simulation results were different for each statement. The participants were classified
accord-ing to their anthropocentric value orientations (Berninger and Kneeshaw, in review) into low (anthropocentric value score form 1 to 2.66), uncertain (anthropocentric value score from 2.67 to 3.33) and high groups (anthropocentric value score from 3.34 to 5).
A Wilcoxon rank sums test was used to test if the mean change in value and attitude scores were different in the professionals and the other forest users groups. Non parametric methods were used since the variances of the compared groups were different (Howell, 2004, p. 467). Statistical analyses were carried out using the JMP statistical package (SAS institute).
4. Results
The participants were given an opportunity to state whether they learned something and whether they changed their opinion after seeing and discussing the simulation results. They also described in their own words what they learned and/or how their opinions changed. In most cases learning was reported, more often among the forest users than among the forestry professionals (Fig. 4). Opinion change was reported only by onefifth of the forestry professionals, but by almost half of the other forest users (Fig. 4). The description of learning and opinion change by forestry professionals was more specific than that of other forest users (Tables 4 and 5).
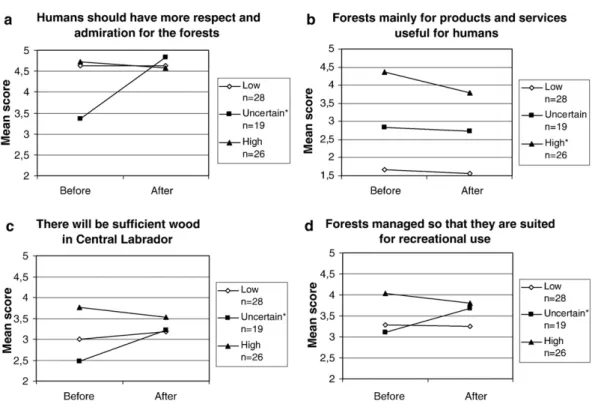
For most of the value and attitude statements there was no significant difference between the mean scores measured before and after presenting simulation results. When the participants were classified according to their answers to questions measuring anthro-pocentric value orientation, most change occurred among the uncertain participants: significant change (p≤0.05) occurred in four questions (Table 2,Fig. 5). For the low or high groups, change towards less extreme positions or the mean of all participants was detected in three questions (Table 2, Fig. 5). Answers to questions measuring
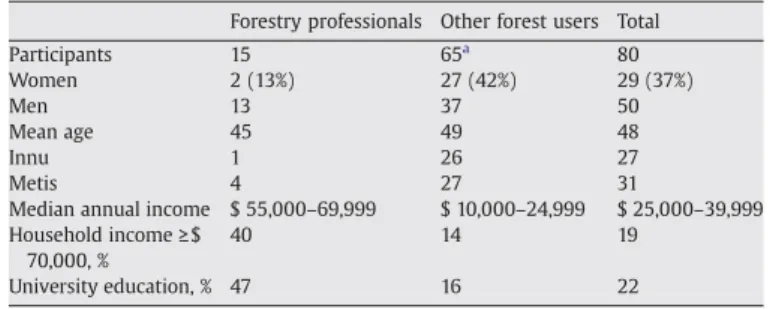
Table 3
The number of participants, the number of men and women, mean age and median income by group
Forestry professionals Other forest users Total
Participants 15 65a 80 Women 2 (13%) 27 (42%) 29 (37%) Men 13 37 50 Mean age 45 49 48 Innu 1 26 27 Metis 4 27 31
Median annual income $ 55,000–69,999 $ 10,000–24,999 $ 25,000–39,999 Household income≥$
70,000, %
40 14 19
University education, % 47 16 22
a
The information on sex is missing for one person.
Table 4
Classification of the answers of forestry professionals and other forest users to the question“what did you learn?”
Forestry professionals n = 15
Other forest users n = 65
Learned about future scenarios 1 20
Clear cut size or coarse/fine protection and roads 7 3
Learned some other small fact 1 6
The current plan is better than I thought 0 6
Became concerned about the future of forests or want more protected area
0 6
Criticizes the model or presentation 0 3
Local processing etc. 0 2
Learned, but more info needed 0 1
The answers marked in italics represent the most specific answers.
Fig. 4. Self evaluation by forestry professionals and other forest users on learning and opinion change following discussion of simulation results of alternative management scenarios for district 19A.
Table 5
Classification of the answers of forestry professionals and other forest users to the question“how did your opinions change?”
Forestry professionals n = 15
Other forest users n = 65
Clearer understanding or change not specified
0 6
It's important to take care of the forests 0 5 Now prefer coarse protection/bigger cut
blocks
3 1
The current plan is better than I thought 0 4 It's important to be active in the planning
process
0 4
There should be more protected areas 0 3
Learned but more info needed 0 3
Keep benefits in Labrador 0 3
Criticizes the work or does not trust the model
0 3
attitudes (significant change in 31% of the questions) changed more often than answers to questions measuring values (significant change in 18% of the questions).
For the other forest users group, the mean change in answers to value questions was lower than to attitude questions, whereas there was no difference in the mean change in answers to value and attitude questions in the forestry professionals group (Fig. 6). For the forestry professionals group, the mean change in answers to attitude questions was significantly less than for the other forest users group (Wilcoxon rank sums test, p≤0.01Fig. 6). For the value questions, the differences between groups were not significant.
5. Discussion
5.1. Presentation of long-term effects and learning
The process applied in this research offirst presenting information on implications of various forest management options and then discussing relevant issues with the participants involved two types of learning: cognitive learning by gaining new information on forests and their management and social learning by hearing other peoples' opinions about the issues (Eagly and Chaiken, 1993, p. 257;Schusler et al., 2003). Social learning can be defined as “learning that occurs when people engage one another, sharing diverse perspectives and experi-ences to develop a common framework of understanding and basis for joint action” (Schusler et al., 2003). Social learning is especially important when dealing with complex issues and uncertainty such as in forest management planning (Schusler et al., 2003) however for this to be effective cognitive learning is also often required.
The demonstration of long-term effects that go beyond the current plan was considered a useful exercise by most of the participants as it increased their cognitive understanding of issues that exceed the spatial and temporal scales that most are used to dealing with. However, it is important to note that some participants expressed that they did not trust the model. The effects of the protection of small patches and of small cut blocks in contributing to the fragmentation of the forest were not obvious intuitively, in order to ensure that long
term impacts were understood the effects of these strategies required a simulation period of over 200 years.
About 47% of the forestry professionals reported having learned about the relationship between clear cut size or small-scale protection and the amount of roads required (Table 4) and 20% of the forestry professionals reported having changed their opinion accordingly (Table 5). These results show that the complexity of forest manage-ment over a large area while considering long-term processes is such that forestry professionals also need to engage in a constant learning process (Daniels and Walker, 1996). To this end, landscape-scale models developed in collaboration with local people and simulations that show long-term development of relevant indicators are needed (Fall et al., 2001).
5.2. Quality and direction of change
There was partial support for thefirst hypothesis, since the results indicate that some attitude change occurred, but also values changed somewhat. The change in answers to value questions was weaker than the change in answers to attitude questions for the other forest users
Fig. 5. Mean value (a and b) and attitude scores (c and d) for four statements measured before and after presenting forest simulation results by anthropocentric value orientation. ⁎=significant difference between before and after values p≤0.05, Wilcoxon sign-rank test.
Fig. 6. Mean change in answers to questions measuring forest values and attitudes towards forest management for the forestry professionals and for other forest users. I don't know answers are excluded. Persons with 2 or more missing answers for value questions and persons with 4 or more missing values for attitude questions not are excluded.⁎=significant difference (p≤0.01) between groups according to the Wilcoxon rank sums test.
group, but not for the forestry professionals group. Contrary to the work ofEagly and Chaiken (1993)the fact that we detected a differ-ence between change in answers to value and attitude questions demonstrates the importance of differentiating between values and attitudes in measuring change.
The mean change for value questions was 0.4 points on afive point scale for both groups. This is a considerable change if we consider the expectation that values would be enduring and that they would be difficult to change as described in the cognitive hierarchy model of human behaviour (Vaske and Donnelly, 1999). It is possible that the questions used were not effective in measuring held values but instead they could have measured other less stable cognitions.
Another possible explanation for the magnitude of change in value questions is that the participants had relatively unstable opinions concerning certain questions, as also reported bySeekamp et al. (2006). However, after receiving more information and hearing other people's points of view, they were able to form a more informed and more carefully considered opinion. They may have learned about the existence of more diversity of forest values than they were aware of (Daniels and Walker, 1996) or they may have learned about concepts related to forest management which helped them better understand the questions asked. The latter may be counter-argued by the fact that change in value questions was also measured in the forestry professionals group and foresters have a strong understanding of forest management concepts as they are using them daily.
The results give evidence, as indicated byTable 2andFig. 4b, that the presentation and discussions moderated the most extreme positions. The group setting and hearing opinions of other participants may have influenced the views of some participants, even if consensus or a group opinion was not required. Most of the significant changes occurred when the persons uncertain in their answers to several questions measuring anthropocentric value orientation formed an opinion on the question at hand. This is consistent with earlier research (Bright and Manfredo, 1997; Seekamp et al., 2006) and gives support for the second hypothesis. The opinion forming that we detected and the moderation of extreme opinions indicates that social learning occurred in the process.
5.3. Differences between groups
We found partial support for the third hypothesis, as forestry professionals changed less in attitude questions, but as much in value questions as the other forest users. The professionals also reported less learning and opinion change in self evaluation. Many of the other forest users were ignorant of the content of the current management plan and during the presentation they learned that it takes into consideration a broad set of values and leaves a large area of forest untouched. In the self evaluation several persons from the other forest users group mentioned that they learned that the current plan was better than they thought. Most of the forestry professionals had been involved in the planning process, so they had an in depth cognitive understanding of the plan, but the exercise may have shown them the effects of different scenarios that were not obvious without such a planning tool as SELES (Fall et al., 2001).
According to the results, it appears that presenting simulation results provides valuable information to both forestry professionals and other forest users. However, the two groups learned different things. While forest users gained more confidence in the current forest management plan and were motivated to further participate, professionals learned about the relationships between cut block size and thefine protection network and the amount of roads required. This shows how the same information provided to persons with different backgrounds can produce different outcomes.
The results indicate that more technical knowledge on forests and forest management leads to more detailed change and less technical knowledge leads to more general changes like a better understanding
on the importance of forests. This reflects the differences between local knowledge and scientific knowledge described byFailing et al. (2007): local knowledge is expressed in more holistic and less reductionist ways than scientific or technical knowledge.
6. Conclusions
The current research tested the effects of presenting simulation results on forest values and attitudes towards forest management based on the cognitive hierarchy model of human behaviour. However, one of the main results of the study is related to learning. Our results indicate that the use of presentation of simulation results together with in-depth discussion enhances both cognitive and social learning among the participants. Our study demonstrates that although forestry professionals are more familiar with modeling tools than lay persons, they may also learn and change their opinions on forest management issues upon seeing simulation results, a mainly cognitive process. Forestry professionals also engage in discussions and gain insight on the values and viewpoints of other participants, a process of social learning. Both types of learning are needed in a process of adaptive management in order to write management plans that are based on the best available science and that integrate diverse values.
Providing information in a way that helps to make complex choices may also increase trust in managers which is considered a key factor in effective public participation processes (Arvai and Gregory, 2003; Davenport et al., 2007). Our results show that effective communication and open discussion on the implications of different management options may enhance positive attitudes towards forestry among local people. Participants in this study gained an improved understanding of the complexity of the task of managing a large forest area for diverse values and their trust in forestry professionals increased accordingly. Acknowledgements
We thank all participants as well as the persons who made this research possible: Neal Simon and Frank Phillips from the NL Department of Natural Resources; Valerie Courtois from the Innu Nation and Bryn Wood from the Labrador Metis Nation. We thank Andrew Fall for his work as the main modeller of the SELES model used and his support in developing indicators, building scenarios and running simulations. We thank Rebecca Ford from University of Melbourne and the anonymous reviewers for their valuable com-ments and Mélanie Desrochers for help with maps. We also thank the Sustainable Forest Management Network as well as the Finnish Helsingin Sanomat Fund and the Finnish Cultural Foundation for funding.
References
Adamowicz, W.L., Burton, P.J., 2003. Sustainability and sustainable forest management. In: Burton, P.J., Messier, C., Smith, D.W., Adamowicz, W.L. (Eds.), Towards sustainable management of the boreal forest. NRC Research Press, Ottawa, pp. 41–64. Arvai, J., Gregory, R., 2003. Testing alternative decision approaches for identifying cleanup
priorities at contaminated sites. Environmental Science & Technology 37 (8), 1469–1476.
Berninger, K., 2007. Attitudes des trois groupes d'intérêt sur les forêts et la foresterie en Mauricie. Rapport pour le projet TRIADE. Available at:http://www.projettriade.ca/ recherche_doc.phpViewed 17.4. 2007.
Berninger, K., Kneeshaw, D., in review. Forest value orientations and attitudes towards forestry of interest groups in three regions varying in importance of commercial forestry. Submitted in Journal of Environmental Management.
Berninger, K., Kneeshaw, D., Messier, C., 2009. The role of cultural models in local perceptions of SFM - differences and similarities of interest groups from three boreal regions. Journal of Environmental Management 90, 740–751.
Bright, A.D., Manfredo, M.J., 1997. The influence of balanced information on attitudes toward natural resource issues. Society & Natural Resources 10, 469–483. Buchy, M., Hoverman, S., 2000. Understanding public participation in forest planning: a
review. Forest Policy and Economics 1, 15–25.
Daniels, S.E., Walker, G.B., 1996. Collaborative learning: Improving public deliberation in ecosystem-based management. Environmental Impact Assessment Review 16 (2), 71–102.
Davenport, M.A., Leahy, J.E., Anderson, D.A., Jakes, P.J., 2007. Building trust in natural resource management within local communities: a case study of the Midewin National Tallgrass Prairie. Environmental Management 39 (3), 352–368. Eagly, A.H., Chaiken, S., 1993. The psychology of attitudes. HBJ Publishers, Fortworth
et al.
Failing, L., Gregory, R., Harstone, M., 2007. Integrating science and local knowledge in environmental risk management: a decision-focused approach. Ecological Economics 64 (1), 47–60.
Fall, A., Fall, J., 2001. A domain-specific language for models of landscape dynamics. Ecological Modelling 141, 1–18.
Fall, A., Daust, D., Morgan, D.G., 2001. A framework and software tool to support collaborative landscape analysis:fitting square pegs to square holes. Transactions in GIS 5 (1), 67–86.
Forsyth, J., Innes, L., Deering, K., Moores, L., 2003. Forest Ecosystem Strategy Plan for Forest Management District 19 Labrador/Nitassinan. Innu Nation and Newfound-land and Labrador Dept.of Forest Resources and Agrifoods, Northwest River. Fulton, D.C., Manfredo, M.J., Lipscomb, J., 1996. Wildlife value orientations: a conceptual
and measurement approach. Human Dimensions of Wildlife 1, 24–47.
Howell, D.C., 2004. Fundamental statistics for the behavioral sciences. Thomson, Brooks/Cole. Belmont et al. 5. edition.
Hunter Jr., M.L., 1990. Wildlife, forests, and forestry: Principles of managing forests for biological diversity. Englewood Cliffs, NJ, USA, Prentice Hall.
Kaplan, S., Kaplan, R., 1982. Cognition and environment— functioning in an uncertain world. Praeger, New York.
Levin, S.A., 2000. Multiple scales and the maintenance of biodiversity. Ecosystems 3, 498–506.
Messier, C., Kneeshaw, D., 1999. Thinking and acting differently for sustainable manage-ment of the boreal forest. Forestry Chronicle 75, 929–938.
Messier, C., Fortin, M.-J., Schmiegelow, F., Doyon, F., Cumming, S.G., Kimmins, J.P., Seely, B., Welham, C., Nelson, J., 2003. Modelling tools to assess the sustainability of forest management scenarios. In: Burton, P.J., Messier, C., Smith, D.W., Adamowicz, W.L. (Eds.), Towards sustainable management of the boreal forest. NRC Research Press, Ottawa, pp. 531–580.
McFarlane, B., Boxall, P., 2000. Forest values and attitudes of the public, environmen-talists, professional foresters, and members of public advisory groups in Alberta. Can. For. Serv. Northern For. Cen. Inf. Rep. NOR-X-374.
Petty, P.E., Carcioppo, J.T., 1986. The elaboration likelihood model of persuasion. Advances in Experimental Social Psychology 19, 123–205.
Rokeach, M., 1973. The nature of human values. Free Press, New York. Rokeach, M., 1979. Understanding human values. Free press, New York.
Schusler, T.M., Decker, D.J., Pfeffer, M.J., 2003. Social learning for collaborative natural resource management. Society & Natural Resources 15, 309–326.
Seekamp, E., Hall, T., Harris, C., Cole, D., 2006. Attitudes and changes in attitudes about visitor management at the Green Lakes/South Sister area of the Three Sisters Wilderness: A study of four stakeholder involvement meetings in Oregon. Wilderness Research Center, University of Idaho. Available at:http://www.cnr.uidaho.edu/wrc/ Publications/publications.htmViewed 5.11. 2007.
Sheppard, S., Meitner, M., 2005. Using multi-criteria analysis and visualisation for sustainable forest management planning with stakeholder groups. Forest Ecology and Management 207, 171–187.
Sheppard, S.R.J., Lewis, J.L., Akai, C., 2004. Landscape visualization: An extension guide for First Nations and rural communities. Sustainable Forest Management Network, Edmonton.
Sturtevant, B., Fall, A., Kneeshaw, D., Simon, N., Papaik, M., Berninger, K., Doyon, F., Morgan, D., Messier, C., 2007. A toolkit modeling approach for sustainable forest management planning: achieving balance between science and local needs. Ecology and Society 12 (2), 7 [online] URL:http://www.ecologyandsociety.org/vol12/iss2/art7/.
Thompson, J.R., Elmendorf, W.F., McDonough, M.H., Burban, L.L., 2005. Participation and conflict: lessons learned from community forestry. Journal of Forestry 103 (4), 174–178.
Turner, M.G., Gardner, R.H., O'Neill, R.V., 2001. Landscape ecology in theory and practice. Springer-Verlag, New York.
Vaske, J., Donnelly, M., 1999. A value-attitude-behavior model predicting wildland preservation voting intentions. Society & Natural Resources 12, 523–537. Wilson, J.S., McGaughey, R.J., 2000. Landscape-scale forest information: what is sufficient