Effect of Cu, Mg and Fe on solidification processing and
microstructure evolution of Al-7Si based foundry alloys
Thèse
Mousa Javidani
Doctorat en génie des matériaux et de la métallurgie
Philosophiae doctor (Ph.D.)
Québec, Canada
Résumé
Au cours de la dernière décennie, les alliages de fonderie Al-Si ont été utilisés de plus en plus comme une alternative appropriée à la fonte dans la fabrication de composants de moteurs (par exemple les culasses). Les objectifs du projet étaient d'étudier l'effet des éléments tels que le cuivre, le magnésium et le fer sur les défauts de solidification, et sur l'évolution des phases poste-eutectiques les alliages de fonderie Al-Si.
Tout d’abord, les travaux antérieurs sont soigneusement examinés afin de mieux comprendre les charges de fatigue thermomécanique, les caractéristiques, les exigences et les matériaux applicables dans les composantes du moteur. Par la suite, les défauts de solidification (tendance de fissuration à chaud (HTS) et microporosité) des alliages à base d’Al-Si ont été évalués. En augmentant la teneur en Cu et en Fe des alliages, la valeur de HTS et de microporosité ont été augmentées. Les indices théoriques de fissuration à chaud ont été simulés avec un modèle de microségrégation multiphasique avec rétrodiffusion dans la phase primaire «multiphase back diffusion model». La corrélation obtenue entre les résultats expérimentaux (HTS) et les résultats simulés est excellente.
L’effet de la composition chimique (Cu, Mg et Fe contenu) dans les alliages Al-Si sur l'évolution de la microstructure ont donc été étudiées. Les microstructures à l'état de coulée et à l'état de traitement thermique de mise en solution (SHT) ont été évaluées par les microscopies optique/électronique. Deux intermétalliques contenant du Mg (Q-Al5Cu2Mg8Si6, π-Al8FeMg3Si6) qui apparaissent avec une couleur grise sous le microscope
optique ont été discriminés par des attaques chimiques que nous avons développées. L’analyse calorimétrique différentielle à balayage (DSC) a été utilisée pour examiner les transformations de phase survenant au cours du processus de chauffage et de refroidissement. Les calculs thermodynamiques ont été effectués pour évaluer la formation de la phase à l'état d'équilibre et hors-équilibre.
Les résultats ont démontré que la séquence de solidification et la stabilité des intermétalliques contenant du Cu/Mg ont été fortement influencée par la composition chimique des alliages. La phase Q-Al5Cu2Mg8Si6 a été solidifiée soit à la même température
phases Q-Al5Cu2Mg8Si6 et π-Al8FeMg3Si6 qui étaient solubles à 505 dans l'alliage
Al-7Si-1.5Cu-0.4mg, sont restées presque intactes dans l'alliage Al-7Si-1.5Cu-0.8mg wt.-%. Bien que l’intermétallique-AlCuFe a été à peine observé dans la microstructure de coulée, la réaction entre la phase primiare α-Al avec la phase β-Al5FeSi a causé la formation de la
phase N-Al7Cu2Fe au cours de la mise en solution. La transformation de phase à l'état
Abstract
Over the past decade, Al-Si based foundry alloys have increasingly been used as a suitable alternative for cast iron in the fabrication of engine components. This project was aimed to study the effect of Cu, Mg and Fe elements on solidification defects (hot rearing tendency and microporosity), and on evolution of post eutectic phases in the Al-7Si (wt.-%) based alloys.
Initially, the previous works and the most pertinent literatures were thoroughly reviewed to elaborate the thermo-mechanical fatigue loads, characteristics, requirements and materials applicable in engine components (mainly cylinder-head). Subsequently, the solidification defects of the Al-Si based alloys were evaluated. By increasing Cu and Fe content of the alloys, the hot tearing sensitivity and the microporosity content of the alloys were both enhanced. Multiphase back diffusion model was utilized to simulate the theoretical hot tearing indices. A very good correlation was obtained between the experimental and the theoretical hot tearing indices.
Effect of the chemistry (Cu, Mg and Fe content) on microstructure evolution of the Al-Si foundry alloys was consequently studied. As-cast and solution heat treated (SHT) microstructures of the alloys were evaluated by optical- and electron-microscopy. Two etchants were developed to discriminate the Mg-bearing intermetallics (Q-Al5Cu2Mg8Si6,
π- Al8FeMg3Si6) under optical microscope. Differential scanning calorimetry (DSC) was
utilized to examine the phase transformations occurring during heating/cooling process. Thermodynamic computations were carried out to assess the phase formation in the equilibrium/non-equilibrium conditions.
According to the predicted/experimental results, the solidification sequence and the stability of Cu/Mg bearing intermetallics are strongly influenced by the chemistry of the alloys. Q-Al5Cu2Mg8Si6 phase was solidified either at the same temperature or earlier than
θ-Al2Cu phase depending the Cu content of the alloy. Moreover, Q-Al5Cu2Mg8Si6 and π-
Al8FeMg3Si6 which were soluble at 505 in the alloy Al-7Si-1.5Cu-0.4Mg, remained
Tough the AlCuFe- intermetallic was barely observed in the as-cast microstructure, the reaction of α-Al with the β-Al5FeSi phase caused the formation of the N-Al7Cu2Fe phase
during SHT. The solid state phase transformation (precipitation temperature and mechanism) of β-Al5FeSi to the N-Al7Cu2Fe phase was also investigated.
Table of Content
RÉSUMÉ ... III
ABSTRACT ... V
TABLE OF CONTENT ... VII
LIST OF TABLES ... X LIST OF FIGURES ... XI ACKNOWLEDGMENTS ... XVII PREFACE ... XVIII CHAPTER 1 INTRODUCTION ... 1 Background ... 2 Objectives ... 5 Structure of thesis ... 6
CHAPTER 2 LITERATURE REVIEW ... 9
“APPLICATION OF CAST AL-SI ALLOYS IN INTERNAL COMBUSTION ENGINE COMPONENTS” ... 9
Thermomechanical fatigue ... 10
Engine characteristics and requirements ... 15
2.2.1. Engine components and requirements ... 16
2.2.2. Magnesium alloys ... 18
2.2.3. Aluminium alloys ... 19
Description of Al–Si based alloys ... 22
2.3.1. The binary Al–Si system ... 22
2.3.2. Influence of iron as impurity ... 23
Solidification sequence in 356 and 319 Al alloys ... 25
2.4.1. 356-type Al alloys ... 25
2.4.2. 319-type Al alloys ... 26
Effect of microstructural features on TMF strength ... 27
2.5.1. Porosity... 28
2.5.2. Secondary dendrite arm spacing ... 29
2.5.3. Segregation ... 30
2.5.4. Cracking/debonding of Si particles ... 30
2.5.5. Slip bands ... 31
Strengthening of cast aluminium alloys ... 32
Dispersion hardening ... 40
Recent developments in Al–Si alloys and applications in engine components ... 44
Summary ... 48
CHAPTER 3 MATERIALS AND METHODS. ... 51
Alloy making and melting: ... 52
3.1.1. Alloy making and melting procedures to evaluate hot tearing susceptibility ... 52
3.1.2. Alloy making and melting procedures for microstructure evolution ... 52
Thermodynamic Prediction: ... 54
Atomic absorption spectroscopy ... 55
Microstructural Analysis: ... 55
Differential Scanning Calorimetry (DSC): ... 56
Heat Treatment: ... 57
CHAPTER 4 . ... 59
“HOT TEARING SUSCEPTIBILITY OF AL-SI BASED FOUNDRY ALLOYS CONTAINING VARIOUS CU,MG AND FE CONTENT”... 59
Résumé: ... 59
Abstract: ... 60
Introduction: ... 60
Materials and Method:... 63
4.2.1. Hot tearing indexation: ... 65
4.2.2. Samples preparation and characterization ... 67
4.2.3. Thermodynamic Prediction: ... 67
Experimental results and discussion ... 67
4.3.1. Microstructural constituents ... 67
4.3.2. Characterization of microporosity ... 70
4.3.3. Hot tearing sensitivity ... 71
4.3.4. Hot tear surface analyses ... 72
4.3.5. Prediction Hot Tearing Susceptibility: ... 74
Conclusion: ... 78
CHAPTER 5 . ... 81
“EVOLUTION OF INTERMETALLIC PHASES IN MULTICOMPONENT AL-SI FOUNDRY ALLOYS CONTAINING DIFFERENT CU,MG AND FE CONTENT” ... 81
Résumé: ... 81
Abstract: ... 82
Introduction ... 82
Experimental procedure ... 84
Results and discussion ... 85
5.3.1. As-cast microstructure ... 85
5.3.2. Microstructure of the solution treated specimens ... 86
5.3.3. Time period of solution treatment ... 88
5.3.4. High temperature solution heat treatment ... 91
5.3.5. Stability of Q-phase ... 92
CHAPTER 6 . ... 97
“ASSESSMENT OF POST-EUTECTIC REACTIONS IN MULTICOMPONENT AL-SI FOUNDRY ALLOYS CONTAINING CU,MG AND FE” ... 97
Résumé: ... 97
Abstract: ... 98
Introduction ... 98
Experimental Procedure ... 101
Results and discussion ... 101
6.3.1. Microstructure of the alloys ... 102
6.3.2. Thermal analysis of as-cast specimens ... 105
6.3.3. The N-phase ... 108
6.3.4. Sequence of the θ- and Q-phases transformation in heating/cooling processes ... 116
6.3.5. Effect of Cu content on the post-eutectic phases ... 119
Conclusion ... 120
CHAPTER 7 . ... 123
“SOLUBILITY/STABILITY OF CU/MG BEARING INTERMETALLICS IN AL-SI FOUNDRY ALLOYS CONTAINING DIFFERENT CU AND MG CONTENT” ... 123
Résumé: ... 123
Abstract: ... 124
Introduction: ... 124
Materials and methods... 127
Results and Discussion ... 129
7.3.1. Characterizing the microconstituents under OM: ... 129
7.3.2. Stoichiometry of the phases after etching: ... 134
7.3.3. Effect of Cu/Mg content of the alloys on evolution of as-cast microstructure ... 134
7.3.4. Effect of Cu/Mg content on maximum applicable SHT temperature ... 137
7.3.5. Microstructure evolution and age hardening after SHT at 505 : ... 139
7.3.6. Effect of high temperature SHT on dissolution of intermetallics ... 142
General discussion ... 144
7.4.1. Stability of the Cu/Mg bearing intermetallics: ... 145
Conclusion: ... 149
CHAPTER 8 PERSPECTIVE AND GENERAL CONCLUSIONS ... 151
General conclusions ... 152
Recommendations for future works: ... 157
CHAPTER 9 APPENDIX ... 159
Appendix (1): calculation of R (ratio of solidification shrinkage) ... 159
Appendix (2): Back diffusion model (BDM) ... 161
List of Tables
Table 2-1: Weight reduction results for CGI vs. grey cast iron cylinder blocks 65 ... 18
Table 2-2: Chemical composition (wt-%) of 356-type, 319-type and 390-type Al alloys ... 21
Table 2-3: Some major properties of the Al 319-, 356-, and 390- type alloys91 ... 21
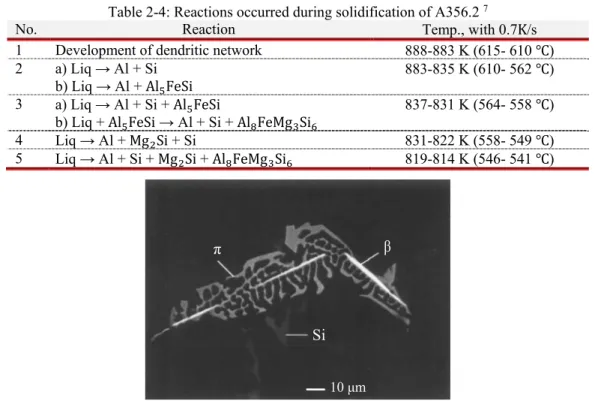
Table 2-4: Reactions occurred during solidification of A356.2 7 ... 26
Table 2-5: Summary of reactions occurring during solidification of 319.1Al alloys ... 27
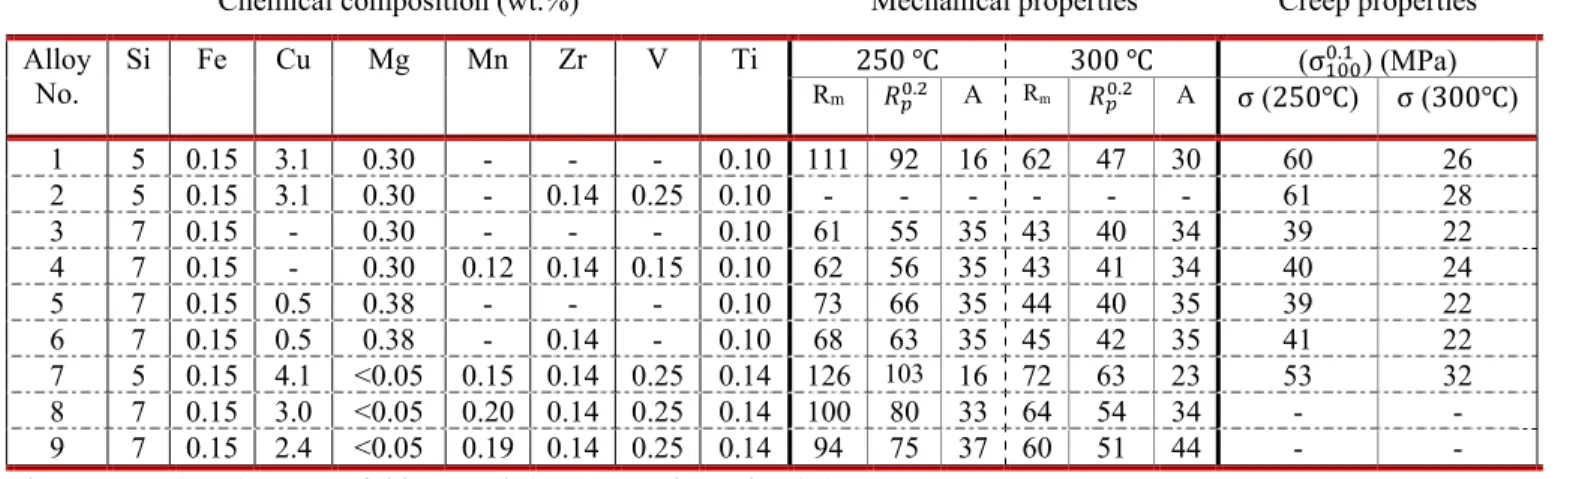
Table 2-6: Chemical composition, mechanical strength and creep properties of Al-Si alloys233 ... 48
Table 3-1: chemical composition of the alloys used to evaluate hot tearing susceptibility (wt.%) ... 52
Table 3-2: chemical composition of the alloys (wt.%) used for microstructure evolution... 54
Table 4-1: chemical composition (wt.%) and SDAS of the alloys ... 63
Table 4-2: Mould temperature of the alloys ... 65
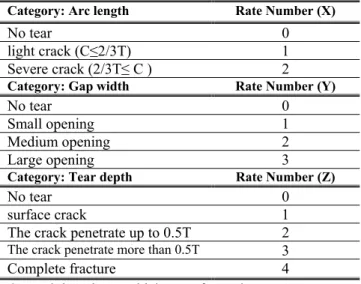
Table 4-3: Crack size parameters for hot tearing index ... 66
Table 5-1: Chemical composition of the Al alloys (wt.%) ... 84
Table 6-1: chemical composition of the alloys (wt.%)... 101
Table 6-2: the solidification temperatures K ( ) of the post eutectic phases predicted by the MBD model 1. ... 104
Table 7-1: chemical composition of the alloys (wt.%)... 128
Table 7-2: stoichiometry of Q- and π-phases measured before and after etching. ... 134
Table 7-3: concentrations of Mg element in α‐Al after different SHT conditions in the studied alloys. ... 145
List of Figures
Figure 2-1 a) out-of-phase and b) in-phase thermo mechanical loading16 ... 11
Figure 2-2 Active damaging mechanisms during an OP- TMF cycle16, 23, 24 ... 11
Figure 2-3 Photographs of a typical crack initiation area in the cylinder head, a) reprinted with permission from American Foundry Society 27, b) copyright © 2006 SAE International; reprinted with
permission 28 ... 12
Figure 2-4 Hoop-stress vs. hoop-strain at valve bridge 36 ... 13
Figure 2-5 Typical thermal loading in valve bridge (e.g. point A) of cylinder head (maximum operating temperature 573K), (reprinted with permission from Elsevier)20, 21 ... 14 Figure 2-6 Increasing the peak firing pressure in truck engines to fulfil emissions standards requirements58 16
Figure 2-7 a) Cross-section of a cylinder head b) engine block, (reprinted with permission from Taylor & Francis)55 ... 17
Figure 2-8 The relation between vehicle mass and fuel consumption68, 69 ... 17
Figure 2-9 Material properties of compacted graphite iron (CGI-400), grey cast iron (GJL-250), Al-A390, AlSi9Cu and Mg-MRI 230D 65, 74, 81. ... 20
Figure 2-10 Peak firing pressure limits for various materials in diesel engine cylinder block58, 81 ... 20
Figure 2-11 The equilibrium phases diagram of the Al–Si alloy system92, 93... 22
Figure 2-12 The role of Al5FeSi in the formation of shrinkage porosity, (reprinted with permission from
Taylor and France)137 ... 25
Figure 2-13 SEM micrograph of A356 as-cast Al alloy showing the close association between Al5FeSi and
π-Al8FeMg3Si6 phase, (reprinted with permission from Springer)140 ... 26
Figure 2-14 Effect of cooling rate on the formation of β-Al5FeSi brittle phase38 ... 29
Figure 2-15 SEM images of: a) debonded (reprinted with permission from Elsevier)150, and b) fractured Si
particle (reprinted with permission from Springer)94 ... 31
Figure 2-16 Temperature ranges for heat treatment and relevant solvus line for binary aluminum alloys 193 .. 33
Figure 2-17 DSC curves of AlSiCuMg alloy solution treated at 773K for different times (reprinted with permission from Elsevier)6 ... 35
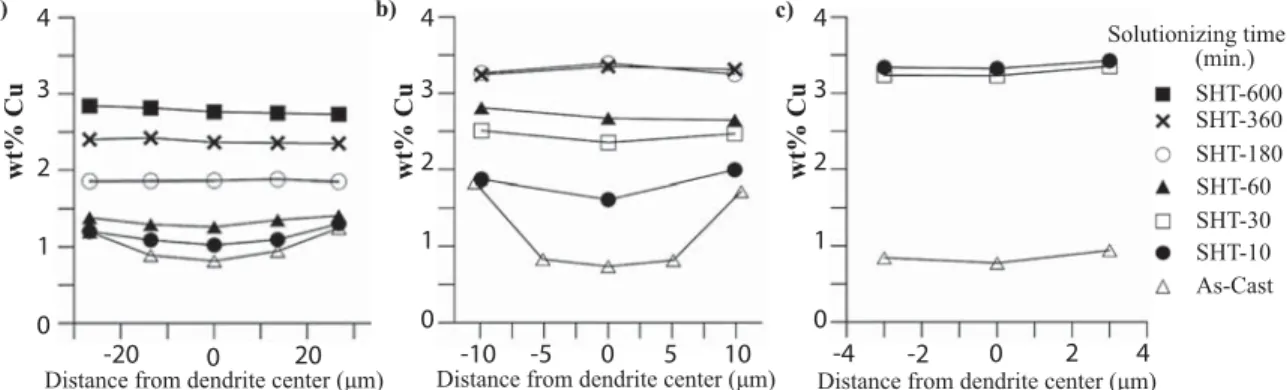
Figure 2-18 Cu concentration measured across dendrite arms in different solutionising times at 768 K (495 ) for various samples: (a) SDAS 50 μm, (b) SDAS 25 μm and (c) SDAS 10 μm, (reprinted with permission from Elsevier)192 ... 36
Figure 2-19 DSC curve of Al7Si3Cu0.4Mg alloy, solution-treated 10hrs@773K, water-quenched and aged for different times at 443K, (reprinted with permission from American Foundry Society)121 ... 38
Figure 2-20 a) L12, (b) D022, and (c) D023crystal structures, (reprinted with permission from Elsevier)252 . 42
Figure 2-21 Calculated diffusivities for different solute elements at 573K (300 ), 673 K (400 ), and 933 K 660 (Tm of Al), (reprinted with permission from Carl Hanser Verlag) 240 ... 43
Figure 3-2: SDAS mesurement of the specimens ... 56
Figure 3-3: cooling curve of the alloy RC3(M0) during quenching, recorded by Data-Logger (OM-DAQPRO-5300). ... 57
Figure 4-1: Schematic view of the ring mould used for the investigation of hot tearing tendency ... 64
Figure 4-2: macrographs to illustrate the different severity levels of hot tearing in the alloys ... 66
Figure 4-3: As-cast microstructures of the four alloys studied. ... 69
Figure 4-4: DSC cooling curves of the alloys RC3 and RC3F0.7, with a scanning rate of 10 K/min.. ... 69
Figure 4-5: evolution of the main intermetallic phases (calculated by MBD model) in alloys: (a) RC3, (b) RC3F0.7. ... 70
Figure 4-6: microporosity content in the alloys. ... 71
Figure 4-7: Microstructure of 3 alloys showing the micropores formed near the hot spot. The amount of porosity in these microstructure are in ascending order from left to right and can be representative of the 3 categories of alloys... 71
Figure 4-8: Hot tearing index (HTS) of the studied alloys ... 72
Figure 4-9: SEM micrographs of the hot tear section in the alloys. ... 73
Figure 4-10: Optical micrograph across the tear region of the alloys a) RC3(M0) and b) RC3F0.7(M0), solid-arrow: β-Al5FeSi phase, dash-arrow: Si-particles. ... 74
Figure 4-11: Physically blocking the metal feeding by β-Al5FeSi phase ... 74
Figure 4-12: Plot of HTS versus HCS assuming ocr= 0.02 and fraction liquid =0.78 at the dendrite coherency point. ... 75
Figure 4-13: Plot of porosity area versus HCS calculated with cr = 0.02 and fraction liquid =0.78 at the dendrite coherency point. ... 76
Figure 4-14: Plot of porosity area versus R calculated with cr = 0.02 and fraction liquid =0.78 at the dendrite coherency point. ... 77
Figure 4-15: Plot of HTS versus R calculated with cr = 0.02 and fraction liquid =0.78 at the dendrite coherency point. ... 78
Figure 5-1: As-cast microstructures of: a) alloy (RC0.5), b) alloy (RC3). ... 86
Figure 5-2: Heating DSC curves of the alloys in as-cast condition. ... 86
Figure 5-3: a) Comparison of DSC curves of alloy (RC0.5) in as-cast and after solution treatment (2h@502C+8h@540C), b) remaining of π-phase after the first step of solution treatment (2h@502C). ... 87
Figure 5-4: DSC curves of a) alloy (RC1.5) and b) alloy (RC3) after different solution treatment times at 502C (935F). ... 88
Figure 5-5: Remnant of θ‐ and Q- phase in alloy (RC3) after 8 hours of solution treatment. ... 89
Figure 5-6: Remnant of Q-phase in alloy (RC3) after 15 hours of solution treatment at 502C (935F). ... 90
Figure 5-7: Calculated mass fraction of phases vs. temperature (in equilibrium state) for Al-7Si-3.5Cu-0.35Mg containing a) 0.15 and b) 0.75 wt % Fe. ... 90
Figure 5-8: Area fraction of intermetallic phases containing Cu (EPMA mappings), and the area under DSC curves (mW/mg) corresponding to peaks II and III in alloy (RC3F0.7). ... 91
Figure 5-10: DSC curves of alloys (RC3) and (RC3F0.7) in as-cast condition and after solution treatment (5h@535C). ... 92 Figure 5-11: Variation of the dissolution temperature of Q-phase with chemical composition (calculated with
Thermo-Calc). ... 94 Figure 5-12: Phase field distribution of Al-7Si-xCu-xMg-0.15Fe at 500C (932F), calculated by ThermoCalc).
... 94 Figure 6-1: as-cast microstructures of the experimental alloys: a) alloy#1 (RC0.5), b) alloy#4 (RC3), c)
alloy#5 (RC3F0.7), d) alloy#6 (RC3(M0)). ... 103 Figure 6-2: mass fraction of phases vs. temperature as calculated with the MBD model 1. ... 104
Figure 6-3: DSC heating curves of the as-cast specimens with scanning rate of 10K/min. The solidus
temperatures (Ts) given above were calculated with the MBD model 1. ... 107
Figure 6-4: DSC cooling curves of alloys #3 to #5 (RC1.5, RC3 and RC3F0.7) with a scanning rate of 5 K/min. The starting temperature of the DSC cooling tests was 933 K (660 . ... 108 Figure 6-5: morphology of the AlCu-eutectic and block-like AlCuFe- intermetallic phases in alloy RC3
(prepared with the permanent mould). ... 109 Figure 6-6: a) alloy #7 (RC3F0.7(M0)) in as-cast condition; b) alloy #7 heated up to 800 k (527 , just beyond peak II) and rapidly cooled (a and b were taken at the same location). ... 110 Figure 6-7: a) alloy #7 (RC3F0.7(M0)) in as-cast condition; b) alloy #7 heated up to 810 K (537 , just
beyond peak III) and rapidly cooled (a and b were taken at the same location). ... 110 Figure 6-8: elemental mapping of alloy #5 (RC3F0.7) in as-cast condition. ... 111 Figure 6-9: elemental mapping of alloy #5 (RC3F0.7) solution heat treated 15 min. at 775 K (502 and
quenched. ... 112 Figure 6-10: elemental mapping of alloy #5 (RC3F0.7) solution heat treated 20 hours at 502 ... 112 Figure 6-11: DSC curves of alloy #5 (RC3F0.7) in as-cast and solution heat treated conditions; scanning rate
10 K/min. ... 112 Figure 6-12: phase morphology, EBSD pattern and simulation results for the N-Al7Cu2Fe phase in alloy
#5-RC3F0.7 (MAD=0.2). ... 114 Figure 6-13: N-Al7Cu2Fe phase under a) optical microscope and b) SEM. ... 114
Figure 6-14: microstructure of alloy #7 (RC3F0.7(M0)) a) 10 hours solution treated at 775 K (502 ), b) 10 hours solution treated at 775 K (502 ), quenched and 10 min. solution treated at 810 K (537 ); (a and b were taken at the same location); (solid black arrows are AlCuFe-, dotted red arrows are AlFeSi- and dashed arrows are AlCu- intermetallics)... 115 Figure 6-15: microstructure of alloy #5 (RC3F0.7) a) 10h solution treated at 775 K (502 ), b) 10h solution
treated at 775 K (502 ), quenched and 10 min. solution treated at 803 K ((530 )); (a and b were taken at the same location). ... 116 Figure 6-16: effects of Cu and Mg contents on the precipitation temperature of the Q- and θ-phases; predicted
by the MBD model. ... 116 Figure 6-17: a) alloy #4 (RC3) in the as-cast condition. b) alloy #4 heated up to 787 K (514 , just beyond
peak I) and quenched (a and b were taken at the same location); (prepared with the permanent mould). ... 118 Figure 6-18:a) alloy #3 (RC1.5) in the as-cast condition. b) alloy #3 heated up to 787 k (514 , just beyond
peak I) and quenched (a and b were taken at the same location); (prepared with the permanent mould). ... 118
Figure 6-19: a) alloy #4 (RC3) in the as-cast condition. b) alloy #4 heated up to 803 K (530 , just beyond peak III) and quenched (a and b were taken at the same location); (prepared with the permanent mould). ... 118 Figure 6-20: DSC cooling curves of alloys #1 (RC0.5), #3 (RC1.5) and #4 (RC3), with a scanning rate of 5
K/min. ... 120 Figure 6-21: evolution of mass fraction and temperature formation of the π-phase with Cu content (in
Al-7Si-xCu-0.35Mg-0.15Fe), predicted by the MBD1. ... 120
Figure 7-1: microstruture of alloy #2-RC1M0.8 (SHTed 14h @ 505 : a) microstruture before tretment with the etchant, b) after treatment with (HNO3), c) after treatment by (HNO3+HCl); the micrographs
were taken at the same coordinate. ... 130 Figure 7-2: as-cast microstructure of alloy #4-RC1.6M0.8: a) before tretment with the etchant, b) etched with
HNO3 c-e) EPMA elemental mapping of the Cu, Mg and Fe elements; the dashed lines in EPMA
micrographs correspond to the same coordinate of the OM micrographs. ... 132 Figure 7-3: as-cast microstructure of alloy #4-RC1.6M0.8: a) before tretment with the etchant, b) etched with
HNO3+HCl c-e) EPMA elemental mapping of the Cu, Mg and Fe elements; the dashed lines in
EPMA micrographs correspond to the same coordinate of the OM micrographs. ... 133 Figure 7-4: SHTed (6h@505 ) microstructure of alloy #2-RC1M.08 a) before treatment with the etchant,
and b) after being etched with HNO3; the micrographs were taken at the same coordinate; gray
colour of Q-phase was changed to dark colour (like Mg2Si) after being etched. ... 133
Figure 7-5: a EPMA elemental mapping of the Mg element correspond to the dashed area in Figure 7-2-d, b) the area correspond to Q-phase (white area) was manually masked, c) the hue in threshold color of ImageJ 134, 168 and the counted area fraction is 2.9% d the hue 134, 169 and the counted area fraction is 10.7%. ... 134 Figure 7-6: The effect of Mg content on phase fractions in Al-7Si-1Cu-0.07Fe-xMg (wt.%); the
dashed-vertical-red lines correspond to the chemistry of the #3-RC1.6M0.4 and #4-RC1.6M0.8 (the results were predicted by MBD1). ... 135
Figure 7-7: as-cast microstructures of the experimental alloys: a) alloy#1 (RC1M0.4), b) alloy#2 (RC1M0.8), 4 c) alloy#3 (RC1.6M0.4), d) alloy#4 (RC1.6M0.8). ... 136 Figure 7-8: the quantified area fractions and predicted volume fraction by MBD1 of the phases
Q Mg2Si and π β in as‐cast condition vs. ratio of Cu/Mg. ... 137
Figure 7-9: microstructure of alloy #2 (RC1M0.8), a) in as-cast condition, b) after 5 hours SHT at 525 ; the micrographs were taken at the same coordinate; Cu-bearing intermetallics were melted but Mg2Si
and π-phases were remained almost intact. ... 138 Figure 7-10: evolution of as-cast microstructure (a, d & g) after applying 1st step SHT (6h@505 ) (b, e & h)
and after 2nd step SHT (8h@525 ) (c, f & i); a-c: alloy #2 (RC1M0.8), d-f: #3 (RC1.6M0.4) and
g-i: alloy #4 (RC1.6M0.8); the micrographs of each alloy were taken at the same coordinate. ... 139 Figure 7-11: Phase fractions (in as-cast condition, after SHT (14h@505 ) and predicted@505 ) in the
alloys vs. ratio of Cu/Mg a) Q+Mg2Si b) π β . ... 141
Figure 7-12: Concentration of the elements [after SHT (14h@505 ) and predicted@505 in the α-Al matrix vs. ratio of Cu/Mg a) Cu b) Mg c Si. ... 141 Figure 7-13: microstructure of alloy #4 (RC1.6M0.8); a) in as-cast condition, b) after 1st step SHT
(6h@505 ); the micrographs were taken at the same coordinate; the phase inside the solid black line represents Mg2Si phase which shrunk in favour of Q-phase after applying the SHT, Q- and
π-phases were remained almost intact. ... 141 Figure 7-14: Hardness vs. aging time relation; (specimens were SHTed (14h@505 ), quenched and aged at
Figure 7-15: concentration of the elements (prediction & experiment) in the α-Al matrix of alloy #3 (RC1.6M0.4) vs. the different SHT processes [(14h@490 , (14h@505 ,
(6h@505+8h@520 and 6h@505+8h@530 . ... 143 Figure 7-16: Hardness of alloy #3-RC1.6M0.4 vs. the different SHT processes [(14h@490 , (14h@505 ,
(6h@505+8h@520 and 6h@505+8h@530 . ... 144 Figure 7-17: maximum dissolved Mg (mass %) in α-Al vs. Mg content of Al-7Si-yCu-xMg-0.1Fe alloy
(y=0.5, 1 & 1.5; x= 0.00 to 0.8%) at two different temperatures (505 and 530 ). The
microconstituents in sections: a=(Al+ Si+ β-Al5FeSi), b=( Al+ Si+ β-Al5FeSi+ π-Al8FeMg3Si6),
c=( Al+ Si+ π-Al8FeMg3Si6); for Cu= 0.5 and 1%: d=( Al+ Si+ π-Al8FeMg3Si6+Mg2Si) and for
Cu= 1.5: d=( Al+ Si+ π-Al8FeMg3Si6+Q-Al5Cu2Mg8Si6). ... 145
Figure 7-18: the green plan corresponds to TTS of each phase (the predicted equilibrium precipitation
temperature for θ, Q and π-phases in Al-7Si-yCu-xMg-0.1Fe), the red-plan corresponds to the (=505 , and the vertical (blue & red) lines correspond to the chemistry of the studied alloys. ... 147 Figure 7-19: maximum Mg content of the Al-Si alloys soluble at the corresponding temperature; three
Al-7Si-0.1Fe-yCu-xMg (y=0.5-1.5 & 4%Cu) are compared. ... 147 Figure 7-20: alloy #3 (RC1.6M0.4), a) in as-cast condition, b) after 1st step SHT (6h@505 ); the
micrographs were taken at the same coordinate; θ-phase and the majority of Q-phase were
dissolved. ... 148 Figure 7-21: alloy #4(RC1.6M0.8), a) in as-cast condition, b) after 10 hours SHT at 505 ; the micrographs
were taken at the same coordinate; Q- and π- phases remained almost intact after SHT and Mg2Si
was transformed to Q-phase. ... 148 Figure 7-22: alloy #3 (RC1.6M0.4), a) in as-cast condition, b) after two step SHT (2 hours@505 +
5hour@525 ); the micrographs were taken at the same coordinate; as shown in dashed-dotted area, the Cu-bearing intermetallics (Q & θ) were melted after the SHT. ... 149 Figure 9-1: Calculated composition profiles of a specimen obtained at 3 different solidification steps (solid
fractions: 0.25, 0.50 and 0.75), a) in equilibrium condition, b) in Scheil condition, c) in BDM condition. ... 163
Acknowledgments
I would like to express my sincere gratitude to my supervisor, Professor Daniel Larouche, for having confidence in me to conduct this project, for his great availability for meetings and discussions and for his valuable comments and suggestions. His encouragement, patience, knowledge and advices were very helpful and appreciated all through my studies. I am also thankful to my co-supervisor, Professor X. Grant Chen, for his insight, support, and his valuable comments and discussions throughout this project. This dissertation would not have happened without you both. I am also thankful to my thesis evaluation committee. Thanks to all of the staff of Mining, Metallurgical and Materials Engineering Department of Laval University for their help and support. Special thanks go to Marc Choquette, Maude Larouche and André Fernand for their help with microstructural analyses, Daniel Marcotte and Vicky Dodier for their availability, collaboration and technical assistance in the laboratory. I am grateful to Amir R. Farkoosh (from McGill) and Honoré Kamguo Kamga† for fruitful discussions, Zhan Zhang, Mohammad Shakiba and Kun Liu (from UQAC) for their assistance in Scanning Electron Microscopy studies. Many thanks to all my colleagues and friends in the department for their kind support, help, suggestions, and making a joyful environment.
Finally, and most importantly I would like to thank my family for their encouragement, sacrifices and patience. I am grateful to my parents, brothers and sisters for their dedication, support and love in all and every stage of my life. Above all, I would like to thank my loving wife, Sheida, for her endless understanding, encouragement and patience with me. This dissertation would not have been possible without the support and love of my family.
Preface
To reveal the performance requirements for the engine components (engine blocks and cylinder heads), the operating service conditions need to be thoroughly reviewed. Three different loads that are applied on the cylinder head have to be considered: the assembly load, the load produced by combustion pressure and the thermal load. The effects of thermal load on the fatigue lifetime of a cylinder head are overwhelmingly greater than those of the other loads. In a start–stop cycle, an engine might be warmed up from 243 K (-30 ) in a cold winter to over 523 K (250 ). During such a thermal cycle, large thermal/mechanical loads are applied on the engine components because of non-uniform thermal expansion/contraction of different engine parts.
Engine components have historically been manufactured in cast iron owing to its inherent high-temperature strength; however cast iron is a very dense material (~7.5 g cm−3).
Demands to improve fuel economy and to reduce emissions necessitate replacement of cast iron with lighter metals. Excellent thermal conductivity and lower density make Al–Si foundry alloys a suitable alternative for cast iron in the fabrication of engine components. The increase in the maximum operation temperature and pressure of engines necessitates improving the thermomechanical fatigue (TMF) performance of Al-Si alloys. Casting defects are of the major parameters to affect the TMF performance of Al-Si alloys. In defect-limited specimens, crack initiation can be significantly delayed.
Copper and Mg play a vital role in the strengthening of Al-Si alloys. To maximize the efficiency of strengthening, the large post-eutectic phases (e.g. θ-Al2Cu and
Q-Al5Cu2Mg8Si6) must be dissolved and re-precipitated by applying appropriate heat
treatment. The temperature(s) and reaction(s) of the last solidified eutectic phases are critical parameters in the optimization of the solution heat treatment. Moreover, the Fe content of the alloys, by which the solidification process and the overall mechanical properties of the alloys are significantly affected, must be taken into account.
This doctoral thesis is presented to the department of mining, materials and metallurgical engineering of Laval University. Financial assistance received from the Natural Sciences
and Engineering Research Council of Canada (NSERC), Rio-Tinto-Alcan (RTA) and Fonds de recherche du Québec- Nature et technologies (FRQ-NT) by the intermediary of the Aluminium Research Centre (REGAL) is gratefully acknowledged. The project was carried out under supervision of Professor Daniel Larouche and co-supervision of Professor X. Grant Chen. This thesis has been prepared as an article insertion thesis and includes five articles, which at the time of the thesis submission, were mostly published or submitted for publication.
My contribution to these articles was: define the objective of each article, prepare the plan of experiments, design/assembly of the experimental set-ups and perform the experiments as follow: modify the design of the ring mould test, present a semi-quantitative indexation method, study the post eutectic reactions and evaluate the stability/solubility of the post eutectic phases in the Al-Si hypoeutectic alloys. A computational algorithm developed by Larouche1, was used in the thermodynamic computations to calculate the mass fraction of
phases and to simulate the theoretical hot tearing index. I subsequently prepared the first draft of the articles, which were all revised by the co-author(s) before submission.
The first article titled: “Application of Cast Al-Si Alloys in Internal Combustion Engine
Components” co-authored by Professor Daniel Larouche, is a literature review paper and
has been published in the journal of International Materials Reviews, 2014, Vol. 59, No. 3, pp. 132-158.
The second article titled: “Hot Tearing Susceptibility of Al-Si foundry alloys containing
vairous Cu, Mg and Fe content”, co-authored by Professor Daniel Larouche, has been
written and is ready to submit.
The third article titled: “Evolution of Intermetallic Phases in Multicomponent Al-Si
Foundry Alloys Containing Different Cu, Mg and Fe Content”, co-authored by Professor
Daniel Larouche and Professor X. Grant Chen, has been published in American Foundry
Society (AFS) Transactions, 2014, Vo. 122, No. 14-056.
The forth article titled: “Assessment of post-eutectic reactions in multicomponent Al-Si
foundry alloys containing Cu, Mg and Fe”, co-authored by Professor Daniel Larouche and
Professor X. Grant Chen, has been published in Metallurgical and Materials Transactions
The fifth article titled: “Solubility/ Stability of Cu/Mg Bearing Intermetallics in Al-Si
Foundry Alloys Containing Different Cu and Mg Content”, co-authored by Professor
Daniel Larouche and Professor X. Grant Chen, has been written and is ready to submit.
I collaborated on the following published/accepted articles, as well:
1) Farkoosh A., Javidani M., Hoseini M., Larouche D., Pekguleryuz M., “Phase formation
in as-solidified and heat-treated Al–Si–Cu–Mg–Ni alloys: Thermodynamic assessment and experimental investigation for alloy design”, Journal of Alloys and
Compounds, 2013, 551(0): p. 596-606.
2) Larouche D., Javidani M., “Mathematical analysis of the heat measured by a power
compensated differential scanning calorimeter during the solidification of a multiphase alloy”, Journal of Thermal Analysis and Calorimetry, (accepted on 16
Background
Engine blocks and cylinder heads are the fatigue critical automotive components which experience two distinct types of fatigue failure in service: mechanical fatigue, as a high cycle fatigue (HCF), is initiated by the variation of pressure within the combustion chamber; and thermal fatigue, as a low cycle fatigue (LCF), is originated by the start-stop cycles of the engine. The effect of thermal load on fatigue life is overwhelmingly greater than those of mechanical loads (combustion pressure). Thermal fatigue strength is not an inherent property of the alloy and many parameters are generally involved to improve the thermal fatigue resistance in the Al-Si alloys: high thermal conductivity, low thermal expansion coefficient, low porosity level, high/room temperature tensile strength, high ductility, high creep resistance, high fatigue strength, microstructural stability, small secondary dendrite arm spacing (SDAS), and low content of coarse intermetallic phases. Over the past decade, Al-Si casting alloys have increasingly been used in the automotive industry as a suitable alternative for cast iron in fabrication of engine components. The major advantage of the Al-Si alloys, besides their high strength to weight ratio, is their excellent thermal conductivity, which allows the combustion heat to be extracted more rapidly compared to cast iron. On the other hand, the automotive industry has been ever facing the challenge of improving efficiency and overall performance of engines. To increase the efficiency, the maximum operation temperature and pressure of the engine must be raised. The increase of operation temperature, which leads to softening of hypoeutectic Al–Si alloys, necessitates high-temperature strengthening of the Al–Si alloys. Two main categories of the commercial aluminum alloys are commonly used in fabrication of engine components: 1) Al-7Si-3Cu alloys (e.g. as A319) containing Mg (<0.4 wt.%), and 2) Al-7Si-0.3Mg alloys containing Cu (e.g. A356+0.5Cu-wt.%). Presence of Mg and Cu in the Al-Si based alloys is required to improve the mechanical strength; while Fe is usually present as an impurity element.
Performance and fatigue lifetime of Al-Si based alloys (319- and 356-type Al alloys) can be more influenced by the actual casting processes than by alloy chemistry. Defects (e.g. porosity and inclusions), which are associated with casting processes, strongly impair the mechanical strength (in particular fatigue strength). In defect-limited specimens, crack
initiation can be significantly delayed. Therefore finding parameter(s), which affect the casting defects (e.g. porosity and hot-tearing), reserve particular importance to improve the quality characteristics of Al-Si based alloys.
The soundness of cast Al-Si alloys can be strongly influenced by content of the impurities (e.g. Fe) and alloying elements (e.g. Cu and Mg). Iron as the most common impurity in Al-Si alloys is generally appeared as lamellar intermetallic phases; these iron-bearing intermetallics reduce the fluidity and enhance shrinkage porosity by physically blocking the metal feeding. The alloying elements (e.g. Cu) promote the porosity formation by increasing both the solidification interval (∆T) and the solidification shrinkage. The solidification interval (∆T) has been reported to increase from 59K (59 , in Al-7Si-0.3Mg wt.%) to 117K (117 , in Al-7Si-1Cu-0.3Mg wt.%); by further increasing the Cu content (Al-7Si-4Cu-0.3Mg wt.%), the ∆T was decreased to 109K (109 )2. The overall
solidification shrinkage in Al-Cu binary alloys is ~8%, and in of Al-Si is ~4%3-5.
Precipitation hardening is one of the major strengthening mechanisms of the Al–Si hypoeutectic alloys. The large eutectic phases (e.g. θ-Al2Cu and Q-Al5Cu2Mg8Si6)
precipitated during solidification weaken the strengthening role of the alloying elements (Cu and Mg). To maximize the strengthening, the as-solidified large eutectic phases must be dissolved by applying an appropriate solution heat treatment (SHT), and are re-precipitated as fine evenly distributed metastable phases.
The solution heat treatment is a heating process at a temperature range between the solvus and the solidus line of the specimen. The time period of the heating process must be long enough to entirely/ partially dissolve some certain microconstituents. Spheroidisation of the eutectic Si particles and homogenisation of the alloying elements are the other objectives of the solution treatment.
The temperature of solution heat treatment (TSHT) must be limited to melting temperature
(Tmp) of the last solidified eutectic phases. Applying SHT at higher temperature causes
incipient melting of the eutectic phases through which the mechanical properties deteriorates. The last solidified eutectic reaction in Al-Si-Cu-Mg alloys, which involves θ-Al2Cu and Q-Al5Cu2Mg8Si6 phases, generally reported to occur at ~507 (780 K) 6, 7.
(773 K). It has been reported that the single step SHT is neither able to maximize the dissolution of Cu rich intermetallic phases, nor is able to homogenize the microstructure and modify the Si particle. Thus, a two-step SHT has been proposed, by which the Cu-bearing eutectic phases solidified at the last stage of solidification could be dissolved at the first step of SHT. The second step of SHT, which could be ~10-35 higher than the TSHT
of the first step, assists to dissolve the remaining Cu-bearing intermetallic phase and further homogenize the microstructure. It is worth mentioning that the solubility/stability of some phases is strongly influenced by the content of the alloying elements. Fairly sluggish dissolution rate or even stability of Q- Al5Cu2Mg8Si6 phase has been reported in the alloys
having high Mg content. Therefore, the content of the alloying elements plays vital role in the solution heat treatment temperature (TSHT) and in the possibility of applying the second
step of SHT.
The solidification temperature of θ-Al2Cu phase was disputed in literature. Mulazimoglu et
al. 8 reported the precipitation temperature of θ-Al
2Cu phase is at ~549 in 319.2 foundry
alloy. Samuel 9, 10 reported the appearance of the θ-Al
2Cu phase with two distinct
morphologies, viz. eutectic-like and block-like morphology, at ~520 and at ~533 , respectively. The temperature of the reaction reported by Mulazimoglu et al. was neither confirmed by Samuel 9, 10 nor by other authors 6, 7.
The mechanical properties of Al-Si alloys are significantly influenced by the iron-bearing intermetallics. Their detrimental effect is directly proportional to their size, density and morphology. β-Al5FeSi and π-Al8FeMg3Si6 phases are of the major iron-bearing
intermetallics which are frequently observed in Al-Si based foundry alloys. The latter can be entirely/ partially soluble during solution treatment. Therefore, precipitation/dissolution temperature of this phase can also influence optimization of the SHT. N-Al7Cu2Fe phase is
another Fe-bearing intermetallic which has been observed in the solution heat treated (SHTed) specimens by a few studies 11-14; but the detail of the phase transformation, its
effect on thermal analysis and the influence of chemical composition has never been studied.
Objectives
The major purpose of this work is to investigate the parameters by which the thermo-mechanical fatigue strength of Al-Si based alloy can be influenced. The TMF loads are cyclically exerted on the components (e.g. cylinder head) within a certain temperature range with varying status of stress (tensile and or compression). The TMF strength is not an intrinsic property to be studied and various mechanical properties must be considered to improve it. Therefore, it is required to thoroughly review the literature to better understand the TMF stresses/strains and temperature ranges in engine components, and the parameters which affect the TMF strength in Al-Si foundry alloys.
Casting defects (e.g. porosity and hot tearing) is one of the major parameters to deteriorate the TMF strength of Al-Si foundry alloys. The defects are correlated with the solidification interval (∆T) of the alloys, which in turn, is affected by Cu and Mg content. Moreover, mechanical properties of the secondary (i) 319-type Al alloys have been often compared in
literature with the primary A356 alloys containing Cu. However, the high Fe content can be of the major factor to promote the defects which, in turn, influence the mechanical properties. Therefore, the first part of this work was designated to study the effect of the elements (Cu, Mg and Fe) on casting defects (porosity and hot tearing).
In order to enhance the efficiency of precipitation strengthening, the microstructure evolution of the post eutectic phases must be profoundly investigated. Solution heat treatment (SHT) is generally limited to ~500 to avoid localized melting of eutectic Q- and θ- phases. However, there is a controversy between the melting/solidification temperatures of Q-phase reported in literature with the results predicted by Thermo-Calc. According to literature, Q-phase is started to melt at ~507 in Al‐Si foundry alloys containing Cu and Mg; but according to Thermo-Calc the melting/solidification temperatures of Q-phase can be varied by the alloying elements (Cu and Mg). Moreover, in some references Q-phase has been reported to be soluble, but there are some other references which reported stability of Q- phase after applying hours of SHT.
Thermodynamic computation can be a valuable tool to find the correlation of the alloying elements (mainly Cu and Mg content) with the stability/solubility of Q-phase.
θ-Al2Cu phase has been reported to appear with two distinct morphologies; eutectic-like
morphology with Cu concentration of ~28 wt.% and block-like morphology with Cu concentration of ~40 wt.% 9, 15, but they have not talked about the rest of the concentration
in the block-like θ-phase. Moreover, they observed the signatures of the two θ-phase morphologies in thermal analysis during heating process; but they have not reported presence of the signature (of blocky θ-phase) during cooling process9, 15. Thermodynamic
calculation predicts only one type of θ-phase in Al-Si-Cu-(Mg) system.
π-Al8FeMg3Si6 is an iron-bearing intermetallics which can be entirely/ partially soluble
depending the chemistry of the alloys. Therefore, precipitation/ dissolution temperature of this phase and its correlation with the chemistry can be one of the criteria in optimization of SHT. N-Al7Cu2Fe phase is another iron-bearing intermetallics, which has been rarely
reported in solution heat treated microstructures; but the presence of this phase in as-cast microstructure has never been observed. Evaluating the effect of chemistry of the alloys and SHT parameters on appearance of N-phase, and the signature of N-phase in thermal analysis are the other purposes of this work.
Structure of thesis
The PhD dissertation was written in the form of a collection of scientific publications, which were either published or submitted at the time of the thesis submission. The thesis is presented in eight chapters:
Chapter 1 is allocated to the general introduction, the problem identification, the objectives, and the structure of the thesis. In Chapter 2, a literature review on the application of Al-Si based foundry alloys in the engine components is presented. The TMF and the structural stress–strain in engine components are initially elaborated. The physical and mechanical properties of the suitable alternative alloys in manufacturing of engine components are compared with cast-iron. A detailed review on solidification sequence and strengthening mechanisms of cast Al-Si alloys are presented. The effect of microstructural
features on TMF strength is thoroughly reviewed. The advantages/disadvantages of application of various Al-Si foundry alloys containing different elements (e.g. Ni, Sc, etc.) in cylinder heads, which has been studied in last decades, is elaborated. It is worth mentioned that this chapter is the first part of the paper published in journal of International Materials Review. The second part of this paper which was allocated to the characteristics of the engine block (requirements, applicable materials, procedures to reinforce the cylinder block wall, etc.) was out of the scope of the thesis.
Chapter 3 This chapter gives a detailed description on experimental methodologies and procedures. In this chapter, the procedures of preparation of the Al-Si alloys melt and hot tearing indexation are provided. Procedures of metallography (mounting, grinding and polishing) for microstructural characterization and differential scanning calorimetry (DSC) analysis are detailed. Heat treatment applied to evaluate the stability/solubility of post eutectic phases is described. Thermodynamic computations to calculate the mass fraction of the phases and to simulate the theoretical hot tearing indices are also explained.
Chapter 4 The results of the second article are presented in this chapter. Solidification defects (microporosity and hot tearing susceptibility) of seven different Al-Si foundry alloys (356- and 319-based alloy) were compared. The hot tearing susceptibility (HTS) of the alloys was ranked by a new semi-quantitative indexation. The HTS and microporosity were correlated with the combined amount of the Cu and Fe of the alloys. The theoretical hot tearing indices of the alloys were simulated by multiphase back diffusion (MBD) model developed by Larouche1. The correlation between the experimental and the theoretical hot
tearing indices was excellent.
Chapter 5 The purpose of this article was to elucidate the evolution of Cu/Mg bearing intermetallics in Al-Si-Cu-Mg alloys. Four Al-Si alloys containing Cu, Mg and Fe were investigated. The SHT parameters were optimized to maximize the dissolution of θ-Al2Cu,
π-Al8Mg3FeSi6 and Q-Al5Cu2Mg8Si6 phases while minimizing the loss of Cu into
N-Al7Cu2Fe phase.
Chapter 6 The effect of Cu, Mg and Fe content on post eutectic reactions occurring in Al-Si based foundry alloys was studied in the third article, and presented in chapter 6. Seven different Al-7Si based alloys containing various Cu, Fe and Mg content were investigated.
The solidification temperature of Mg bearing intermetallics (Q-Al5Cu2Mg8Si6 & π-
Al8FeMg3Si6) was correlated with the Cu content of the alloy. The AlCuFe-intermetallic
compound, which was barely found in the as-cast microstructure, significantly enhanced after SHT; this intermetallic compound was mostly detected as N-Al7Cu2Fe phase after
applying SHT.
Chapter 7 This article was aimed to specify the chemistry of Al-Si alloys for which the Cu/Mg bearing intermetallics (θ, Q, Mg2Si and π) are all soluble. Four Al-Si based alloys
containing various Cu (1 and 1.6 wt.%) and Mg (0.4 and 0.8wt.%) contents were investigated to assess with further details the effect of chemistry on evolution of Cu/Mg bearing intermetallics. Two etchants were developed to distinguish the Mg bearing intermetallics (Q-Al5Cu2Mg8Si6 & π- Al8FeMg3Si6) under optical microscope. The
chemistries of Al-Si alloys (the range of Cu and Mg content of the alloys), for which the whole Cu/Mg bearing intermetallics are soluble, were predicted by Thermo-Calc.
Chapter 8 summarizes the major achievements and concludes the obtained results in this project. In addition, recommendations are provided for future work.
Chapter 2
Literature review
“Application of Cast Al-Si Alloys in Internal Combustion Engine Components”
This chapter, which is parts of the paper published in journal of International Materials Review, summarizes the literature most pertinent to the subject of this thesis. It has been composed of eight main sections: the first section describes the thermo-mechanical fatigue (TMF) in engine components. The second section elaborates characteristics, requirements and materials applicable in engine components. The sections three and four deal with the specifications and solidification sequence of the Al–Si foundry alloys. The fifth section introduces the microstructural features of Al-Si foundry alloys which affect TMF strength. The sixth section presents the strengthening mechanisms of Al-Si alloys. The seventh section lists the Al-Si alloys used in engine components and their developments in last decades.
Thermomechanical fatigue
The cyclic stresses required to cause fatigue failure at elevated temperature (0.3Tm T
0.7Tm) do not necessarily result from the application of external loads; they could also be
created by cyclic thermal stresses. Thermal stresses are produced when the change in dimensions of a member, which is in turn the result of a temperature change, is restricted by some kind of constraint. For instance, in a fixed end bar, the thermal stress produced by a temperature change (T) can be expressed as (if no plastic strain):
d d dT d T E T (1)
where is the linear coefficient of thermal expansion and E is the elastic modulus.
Under thermomechanical conditions, the total strain (tot) is the sum of thermal strain (th)
and mechanical strain (mech) components, the latter being composed of elastic (el) and
inelastic strain (in) components:
tot th mech
(
T T
0)
el in
(2)where T0 is the reference temperature and T is the test temperature.16, 17
In thermomechanical fatigue (TMF), thermal and mechanical strains with different phasing might be applied to specimens.18 Two major cycles are generally employed in a TMF test:
(a) in-phase cycle, where the mechanical strain and thermal strain are at the same phase (e.g. maximum strain at maximum temperature); and (b) out-of-phase cycle, where mechanical strain is maximum at minimum temperature. Variations of strain components (thermal/mechanical and total strain) with time corresponding to OP TMF (out-of-phase TMF) and IP TMF (in-phase TMF) cases are illustrated in Figure 2-1.16, 19
Figure 2-1 a) out-of-phase and b) in-phase thermo mechanical loading16
The governing damage mechanism in engine components (e.g. cylinder heads) has been reported to be OP TMF cycles.20, 21 In each cycle of OP TMF, since a specimen crosses a
temperature range, it can be affected by a variety of thermally activated processes (as illustrated in Figure 2-2). The damage mechanisms can affect the specimen either individually or in mutual interactions. The major damage mechanisms in TMF processes are activated by fatigue, environment (oxidation) and creep.19, 22
Figure 2-2 Active damaging mechanisms during an OP- TMF cycle16, 23, 24
Because of the complex geometry, thermal/mechanical strains in a cylinder head are known to be larger than in an engine block; therefore the former is more susceptible to failure by TMF. Detailed information about geometry, constituent parts and applied conditions on cylinder heads can be found elsewhere.25, 26 Figure 2-3 shows two pictures of typical crack
initiation areas in cylinder heads.
a) Hot Hot Cold Strain t (sec)
ε
th Coldε
totε
mechΔε
mech b) Strain t (sec)ε
thε
mechε
totΔε
mechHot Hot Hot
Cold Cold ε σ Plastic deformation Cyclic ageing Oxidation Cr eep effects Recovery process Plastic deformation Crack initiation and pr opagation Hardening process Hot Cold Coarsening effects
Figure 2-3 Photographs of a typical crack initiation area in the cylinder head, a) reprinted with permission from
American Foundry Society 27, b) copyright © 2006 SAE International; reprinted with permission 28
Several studies28-30 have been done to simulate/measure the thermal/mechanical stress–
strain variations and temperature gradient in cylinder heads. As mentioned above, three loads on the cylinder head must be taken into account: the assembly load, the load produced by combustion pressure and the thermal load. The assembly load is generated by the screws connecting the cylinder head to the engine block, press fitting of valve seats and hot plug. The peak firing pressure, which is generated by combustion pressure, can reach values up to 200 bar in diesel engines.20, 31-33 In a start–stop cycle, the engine is warmed up
to over 523 K (250 ), with a strong temperature gradient being created during operation between the water cooled flame deck (from 373 to 393 K, (100 to 120 )) and the combustion chamber face (from 523 to 573 K, (250 to 300 )). The constraint imposed on thermal expansion creates the most significant operating stresses at the critical flame-face sections of the cylinder head (e.g. valve bridge). The thermal load affects the fatigue lifetime to a far greater extent than the other two loads mentioned.33-35
Figure 2-4 illustrates the calculated hoop strain–hoop stress for the first through third hot– cold cycle in the valve bridge area of a cylinder head. At the beginning, assembly loading generates a tensile hoop stress. The stress is compressive during heating which becomes tensile upon cooling of the assembly. As illustrated, the mean hoop strain is compressive while the mean stress is rather tensile during the temperature cycle.34, 36
Figure 2-4 Hoop-stress vs. hoop-strain at valve bridge 36
Two distinct fatigue modes control the lifetime of engine cylinder heads: mechanical fatigue and thermal fatigue. Mechanical fatigue, as a high cycle fatigue (HCF) in cylinder heads, is driven by the fluctuation of pressure in the combustion chamber. The thin walls (thickness ~10 mm), adjacent to the water ducts in the valve bridge of a cylinder head, are the critical locations for mechanical fatigue crack initiation. The temperature range in these areas has been reported to be 393 K (120 , at lower engine speed) up to 443 K (173 , at higher speed).37 The design of cylinder heads, the intrinsic fatigue strength of the alloy and
residual stresses induced by heat treatment are the three major factors which significantly affect the mechanical fatigue resistance.37, 38 Thermal fatigue, as a low cycle fatigue (LCF),
is driven by the start–stop cycles of the engine. The typical thermal stress and strain cycles in the valve bridge (i.e. point A) of a cylinder head are illustrated in Figure 2-5. The thermomechanical loading factor KTM = −(mech/th) is ~0.75 in the cylinder head. It seems
that the influence of HCF loadings on the lifetime is small; the typical ignition pressure is less than 200 bar, and the time of the HCF loading occurring is superimposed with the heating period and dwell time during which the stress is compressive.20, 21, 23
-200 -100 0 100 200 Hoop strain (%) Hoop stress ( MPa ) -0.8 -0.6 -0.4 -0.2 0 0.2
Figure 2-5 Typical thermal loading in valve bridge (e.g. point A) of cylinder head (maximum operating temperature 573K), (reprinted with permission from Elsevier)20, 21
The mechanism of fatigue failure can be explained as follows. After ignition of the engine, the valve bridge is heated up and the temperature becomes quite high (exceeds 523 K (250 )) relative to the circumference of the combustion chamber. The bridge section tends to expand but cannot do so freely, since it is constrained by the water cooled flame deck across which it is suspended. This creates a local compressive stress field within the bridge section and induces compressive yielding. The most severe stress is created when the temperature difference between the combustion chamber and the water cooled flame deck is the largest (i.e. at the maximum speed). It is important to note that plastic deformation, which occurs at high temperature, does not cause fatigue cracking (because of being in a compressive state) as long as the engine is running.30, 31, 34 When the engine is turned off,
the bridge section tends to contract while cooling back to room temperature. The yielded regions cannot return to the initial condition and tensile stresses are generated in these regions.34, 39, 40 Therefore, the stress field for the yielding regions of the cylinder head is
compressive at high temperatures, but becomes tensile at low temperatures (as shown in Figure 2-5). The repetition of these compressive–tensile stress cycles is considered to cause the cracking in the radial direction. As a result, the number of engine start–stop cycles could be a better indicator of TMF failure than the mileage of a vehicle.21, 37
Therefore, to prevent crack initiation, the alloy must have either high yield strength to accommodate stress elastically, or high ductility to delay crack formation.38, 41, 42 The
T Transient temperature t σ t Plastic deformation Stress relaxation Engine start A t ɛ ɛ mech ɛth superimposed HCF-loading superimposed HCF-loading
former is required to prevent gas leakage, and the latter is required to prevent cracking in the valve bridge area of a cylinder head. Another factor that must be taken into account is the degradation of strength owing to overaging, which makes plastic deformation easier.37,
41, 43 Moreover, there are some other parameters that improve TMF resistance such as:
narrow thermal stress hysteresis loop,41, 44 high thermal conductivity, low thermal
expansion coefficient,45-47 microstructural stability,41, 43 small secondary dendrite arm
spacing (SDAS),38, 48 low porosity level49-51 and low content of coarse intermetallic
phases.41, 52
Engine characteristics and requirements
Diesel engines have become a suitable alternative to gasoline engines over the last decade. Cars powered by diesel engines account for approximately 50% of the total market share in Europe (60% in France). Less fuel consumption, lower CO2 emissions and larger power
output and torque of diesel engines are the main reasons for this progress.53, 54 The major
difference between diesel and gasoline engines is their fuel combustion method, which has been elaborated by Denton.55 Diesel engines operate at a higher compression ratio (between
14:1 and 25:1 compared to gasoline engines at between 8:1 and 12:1) because of the higher temperature and pressure of the mixture in a diesel cycle.
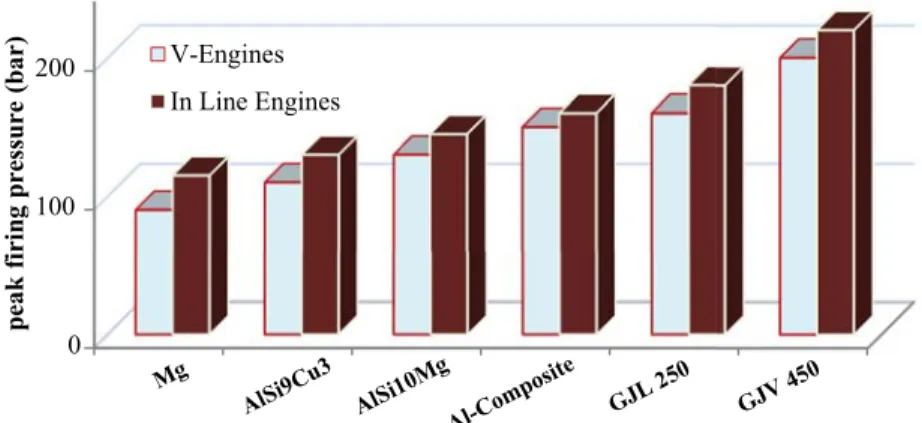
To increase engine efficiency and fulfil emission standard requirements (Euro legislation), the maximum operation temperature and pressure of the engine must be raised, in particular in diesel engines. For instance, the combustion pressure in truck engines was about 125 bar in 1992 and met the Euro I regulations; but it had to rise above 200 bar to fulfil the Euro V regulations (see Figure 2-6). This has increased the maximum operating temperature of cylinder heads from below 443 K (170 ) in earlier engines42, 56 to temperatures above 523
K (250 ) in recent engines.26, 36 These operating service conditions enhance the specific
Figure 2-6 Increasing the peak firing pressure in truck engines to fulfil emissions standards requirements58
Andersson59 stated that only ~12% of the total vehicle power is transferred to the wheels.
About 15% of the energy is consumed by mechanical losses (mainly frictional) in powertrain system, the rest of the energy being dissipated in cooling and exhaust systems.59, 60 Funatani et al.61 stated that friction in the engine system can lead to a loss of over 40% of
total power. The major sources of these frictional losses are attributed to the contact between the piston assembly and cylinder bore.60-62 Therefore, surface modifications of the
cylinder bore could contribute to significant friction reduction, with further benefits for emissions and fuel economy.61, 63 A 10% decrease in frictional losses could reduce fuel
consumption by about 3%. A volume of 600 L of petroleum could therefore be saved for each vehicle having an average fuel consumption of 10 L/100 km and running a distance of 200 000 km over its entire lifetime.59
2.2.1. Engine components and requirements
The engine block and cylinder head, which are shown in Figure 2-7, are the two major components of an engine; both components have historically been manufactured in cast iron owing to its inherent high-temperature strength. Nevertheless, cast iron is a dense material (~7.5 g cm−3) and the engine is the single heaviest component within the
powertrain group (~14% of total vehicle mass64). About 3–4% of the total mass of an
average vehicle is generally assigned to the engine block. The improved specifications and legislations for fuel economy and emissions oblige car manufacturers to make a significant weight reduction in their products. It has been reported that each 100 kg in weight reduction could contribute to ~0.5 L of petrol being saved per 100 km driven.64-67 As
illustrated in Figure 2-8, weight reduction of a vehicle by a certain amount could result in
120 ca. 140 160 180 200 220
Peak firing pressure (bar)
1989 1992 1995 2000 2005 2008 Euro 0 I II III IV V 125 125 135 145160 180 >200 ?
significant improvement in fuel economy.68, 69 Social impetus, for instance the US
Partnership for a New Generation of Vehicles (PNGV) program, demands car manufacturers produce vehicles having a fuel consumption lower than 1 L/30 km.70
Figure 2-7 a) Cross-section of a cylinder head b) engine block, (reprinted with permission from Taylor & Francis)55
Figure 2-8 The relation between vehicle mass and fuel consumption68, 69
Using materials with higher strength and stiffness, such as compacted graphite iron (CGI) instead of grey cast iron, contributes to increase in power and decrease in size of an engine by reducing the main bearing thickness (see Table 2-1).65 Another alternative is to replace
cast iron with lightweight materials (e.g. aluminium and magnesium alloys). Owing to the considerable difference of the density between cast iron (~7.5 g cm−3) and aluminium (~2.7
g cm−3) and magnesium (~1.74 g cm−3) alloys, the substitution of cast iron by one of these
alloys could make a significant weight reduction.
Angle of Valve Angle of Valve
Inlet Port Exhaust Port a) spark Plug drilling b) 26.50 21.25 17 12.75 8.50 4.25 0 54 908 1362 1816 2770
Vehicle mass (Kg)
Distance / Fuel consumption
Table 2-1: Weight reduction results for CGI vs. grey cast iron cylinder blocks 65 Engine size
(Litres)
Engine type Grey iron
weight (kg) CGI weight (kg) Weight reduction (%) 1.6 I-4 Petrol 35.4 25.0 29.4 1.8 I-4 Diesel 38.0 29.5 22.4 2.5 V-6 (Racing) 56.5 45 20.4 4.6 V-6 Petrol 72.7 59.6 18.0 9.2 V-6 Diesel 158 140 11.4 2.2.2. Magnesium alloys
Magnesium is ~75% and ~33%, respectively, lighter than iron and aluminium. It has attracted great interest in the automotive industry. However, the specific stiffness of aluminium and iron has been reported to be slightly (~0.69% and 3.752%, respectively) higher than that of Mg; but the specific strength of Mg is significantly greater than that of aluminium and iron (14.075% and 67.716% for aluminium and iron, respectively).68, 71
The regular commercial cast Mg alloys (e.g. AZ91 and AM50), which are widely used in the automotive industry, suffer from poor creep resistance.72 The creep resistance of the
magnesium alloys (e.g. AM50: Mg–5Al–0.3Mn–0.2Zn (approximate wt-%ii)) has been
reported to be ~15% less than that of aluminium alloys (e.g. A380: Al–8.5Si–3.5Cu–3Zn (approximate wt-%)) at 293 K, and ~65% less at 403 K.73 Therefore, new Mg alloys (e.g.
MRI 201, MRI 230) have been developed to improve the creep resistance and high-temperature strength. These alloys could compete with the commercial Al alloys (e.g. A380 and A319) in terms of creep resistance and high-temperature strength.74-76
Despite these advantages, application of magnesium alloys in the automotive industry has been very limited: the average application of Al alloys has been reported to be over 100 kg per car, while that of Mg alloys has been reported as ~6 kg.77 The higher total cost of Mg
alloys is one of the major reasons for impeding their widespread application in the automotive industry.77-79 It is worth noting that the price of magnesium has been
considerably reduced in the last few years.71 Lower thermal conductivity and higher
thermal expansion are the other disadvantages of Mg alloys compared with Al alloys.72
2.2.3. Aluminium alloys
In the late 1970s, the generation of aluminium engine blocks was introduced to be used in gasoline engines. However, because of technical requirements, application of aluminium alloys was very limited in diesel engines until the mid-1990s. Nowadays, blocks for gasoline engines are generally cast in aluminium alloys; and the use of aluminium in diesel engines is continuing to increase. Also, most cylinder heads are cast in aluminium alloys. Substitution of cast iron by aluminium in engine blocks could result in a weight reduction of 15–35 kg.80 Inline cylinder blocks made in aluminium are noticeably lighter than
corresponding cylinder blocks produced with CGI. For an engine weighing 35 kg in CGI, the weight of the inline cylinder block should be 28 kg using an aluminium alloy.65
However, if the design of the engine is adapted to CGI (V-8 instead of inline), a marginal weight saving can be made with CGI.
Some important properties of Al alloys, Mg alloy, grey cast iron (GJL-250) and CGI (CGV-400) are compared in Figure 2-9. As shown in this figure, another advantage of aluminium alloys compared to cast iron is their excellent thermal conductivity, which accelerates cooling of engine. In spite of all these advantages, softening of the commercial foundry aluminium alloys at service temperature restricts their application in engine components. For instance, as shown in Figure 2-10, some studies from AVL reported that the application of aluminium engine blocks must be restricted for those passenger car engines with 150 bar peak firing pressure.81, 82