Proceedings, 10th World Congress of Genetics Applied to Livestock Production
Consequences of Selection for Environmental Impact Traits in Dairy Cows
P. B. Kandel1, S. Vanderick1, M. L. Vanrobays1, A. Vanlierde², F. Dehareng², E. Froidmont², H. Soyeurt1 and N. Gengler1
1
University of Liège, Gembloux Agro-Bio Tech, Department of Agricultural Science, 5030, Gembloux, Belgium ²Walloon Agricultural Research Centre, 5030, Gembloux, Belgium
ABSTRACT: Genetic selection programs aiming to mitigate methane (CH4) emissions require the estimation of genetic correlations with other production and economical traits and predicted selection response. CH4 intensity was predicted from Mid-infrared spectra of milk samples from Holstein cows. Genetic correlations between CH4 intensity and milk yield (MY) was -0.68, fat yield (FY) -0.13, protein yield (PY) -0.47, somatic cell score (SCS) 0.07, longevity 0.05, fertility 0.31, body condition score (BCS) 0.17. Adding 25% relative weight on CH4 intensity to the current Walloon selection index, the response to selection would reduce CH4 intensity by 24%, increase MY by 30%, FY by 17%, PY by 29%, SCS by -14%, longevity by 24% but also reduce fertility by 11% and BCS by 13%. In conclusion, environmental traits can be added without jeopardizing production traits, but energy balance related traits have to be protected.
Keywords: Methane intensity; genetic correlation; dairy cows
Introduction
Livestock are responsible of 37% of the anthropogenic CH4 emission (FAO (2006)). The enteric fermentation of ruminants accounts for a major part of total CH4 emitted from livestock. In addition to the environmental impact, CH4 can be a loss of 2 to 12% of gross energy intake (Johnson and Johnson (1995)). Therefore, reducing the CH4 emitted by dairy cows has both economic and environmental interests. Current breeding goal for dairy cattle do not include CH4 emission but it is possible this emission factor (by using direct or indirect traits) in the selection index in order to select animals with less CH4 emission (Hayes et al. (2012)).
Previous studies have shown that mid-infrared (MIR) spectroscopy can be used to predict milk fatty acids (Soyeurt et al. (2011)) and milk fatty acids are indirectly related to CH4 emission (Chilliard et al. (2009); Dijkstra et al. (2011)). Therefore, direct
prediction of CH4 from MIR is a step forward. Recently, Dehareng et al. (2012) and Vanlierde et al. (2013) demonstrated that direct quantification of CH4 emission by MIR spectroscopy from milk samples was feasible and can be useful to generate a large number of CH4 phenotypes. Genetic selection of CH4 intensity (CH4 g/kg of milk) predicted from MIR spectra of milk samples can be imagined because it has genetic components (Kandel et al. (2013)). However, such selection programs need to be considered in terms of multi-trait selection index. This requires, therefore, additional information about genetic correlations between all traits and their predicted response before adding any novel traits. The objectives of this study were to estimate the genetic correlations between CH4 intensity and other traits of animal selection and quantify their predicted selection response.
Materials and Methods
Milk Samples and CH4 Phenotypes. Milk samples were collected from Holstein cows in their first three lactations from January 2007 to October 2012 in the context of the Walloon routine milk recording. All samples were analyzed using a Milkoscan FT6000 spectrometer (Foss, Hillerød, Denmark) by the milk laboratory ‘Comité du Lait’ (Battice, Belgium) to quantify the contents of fat and protein and to record the spectral data. The CH4 emission (g/day) was predicted from the recorded milk MIR spectra by the equation developed by Vanlierde et al. (2013). The intensity of the CH4 emission (g/kg of milk) was defined as the ratio of CH4 (g/day) value predicted by MIR divided by the total milk yield recorded for the considered test-day. Production, Functional and Type Traits. Three categories of traits are recorded by the Walloon Breeding Association (Ciney, Belgium) for the routine Walloon genetic evaluation system; 1. Production traits: MY, FY and PY 2. Functional traits: SCS, fertility and BCS and
3.Type traits: 25 linear traits and 8 synthetic traits (Vanderick et al. (2011)).
Animals and Pedigree. Animals which have at least 75% of Holstein genetics in their breed composition were kept for this study. Pedigree data were extracted from pedigree used for routine Walloon genetic evaluation. Final data set of CH4 intensity contained 779,369 test-day records on 82,383 first three parity cows originated from 3,585 sires.
Estimation of Genetic Parameters. Single trait multiple lactation random regression test-day model was used to estimate the genetic variability of the CH4 intensity. The model can be presented as follows: y=Xβ+Q(Zh+Zp+Zu)+e
where y was the vector of observations for CH4 intensity, β was the vector of fixed effects (herd x test-day, DIM (73 classes of 5 days interval), and stage of gestation (35 classes), h was the vector of herd x calving year random effects, p was the vector of permanent environmental (PE) random effects, u was the vector of additive genetic effects; Q was the matrix containing the coefficients of 2nd order Legendre polynomials; e was the vector of residuals; X and Z were incidence matrices assigning observations to effects. The fixed effects and estimated breeding values (EBV) were calculated using a BLUP approach.
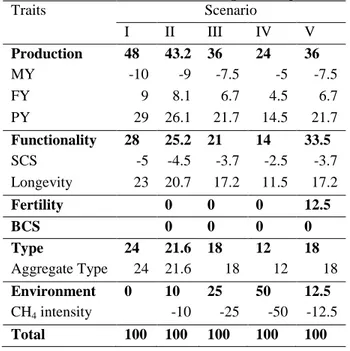
The EBVs of sires for production, functional and type traits were extracted from the EBV calculated for official Walloon genetic evaluation (Croquet et al. (2006); Vanderick et al. (2011)). All EBVs were cumulated over lactations and genetic correlations were approximated through correlation of sire’s EBVs. The Selection Scenarios and Predicted Response. Five selection scenarios to calculate the selection response are proposed. Scenario I is the present Walloon selection index, from second to fourth are 10, 25 and 50 percent reduction on CH4 intensity and scenario V was reduction in CH4 intensity and increase in fertility (Table 1). Relative genetic changes for each trait from selection based on these alternative total indexes were estimated as 𝒓=𝒃′𝑮 where 𝒓= vector of relative genetic gain on all traits; and 𝒃= proportional index weights; 𝑮= matrix of genetic co-variances between index traits and goal traits. Selection intensity was set to 1 and for one generation.
Table 1. Selection scenarios (Scenario I is present Walloon selection index; values in percentage)
Traits Scenario I II III IV V Production 48 43.2 36 24 36 MY -10 -9 -7.5 -5 -7.5 FY 9 8.1 6.7 4.5 6.7 PY 29 26.1 21.7 14.5 21.7 Functionality 28 25.2 21 14 33.5 SCS -5 -4.5 -3.7 -2.5 -3.7 Longevity 23 20.7 17.2 11.5 17.2 Fertility 0 0 0 12.5 BCS 0 0 0 0 Type 24 21.6 18 12 18 Aggregate Type 24 21.6 18 12 18 Environment 0 10 25 50 12.5 CH4 intensity -10 -25 -50 -12.5 Total 100 100 100 100 100
Results and Discussion
The predicted CH4 intensity observed for the first three lactations was 23.82±8.52 with minimum of 7.55 and maximum of 67.88 g . The heritability of CH4 intensity was 0.21±0.01. The genetic correlations with production traits were always negative and nearly zero with SCS and longevity and positive with fertility and BCS (Table 2a). There were negative genetic correlations with average of all type traits while most of individual type traits had negative correlations (Table 2b) with few exceptions (ranged -0.28 to 0.08). Some traits were variable across lactation (for example BCS), so genetic correlations across test-days are more relevant than average of lactations.
Expected Genetic Changes under Selection Scenarios. The selection responses to each scenario are tabulated on Table 3. Under all scenarios, favorable genetic gain would be achieved for CH4 intensity from 14% to -34%. Even without selection on CH4 intensity the reduction in CH4 intensity was substantial. However, the speed of reduction would be faster if we were to add this new trait to the selection index. Fertility is decreasing as expected unless fertility trait was also added in selection index. Type traits have positive genetic correlations on average but both positive and negative correlations on individual traits.
Table 2a. Genetic correlations (rg) approximated as correlations among EBVs (number of bulls=2,080)
Production Functionality Ferti lity BC S MY FY PY SCS Long evity CH4 intensity -.68 -.13 -.47 .07 .05 .31 .17
Table 2b. Approximate genetic correlations of type traits§ (number of bulls=2,060)
Avera ge of Type Angul arity Stat ure Dairy characte r Confir mation score CH4 intensity -.12 -.20 -.16 -.18 -.17
§Other type traits have genetic correlations ranging from -0.28 to 0.08.
This study has some limitations. First, the analyses were only based on correlations of sire’s EBV which might not truly reflect the true genetic correlations. Similarly, it is well known that the early lactation period is characterized by body fat mobilization, negative energy balance (Van Knegsel et al. (2007)) which is also related to CH4 emissions, so test-day genetic correlations are more important than average of whole lactations. The link between energy balance traits, including milk composition to fertility was established recently by Bastin et al. (2012) and should be explored further before adding CH4 intensity to the index.
Table 3. Percentage change in each scenario with CH4 intensity Traits Scenario I II III IV V CH4 intensity¥ -15.3 -18.9 -24.4 -33.5 -14.1 MY 17.4 22.5 30.0 42.6 15.7 FY 17.7 17.2 16.6 15.5 11.2 PY 22.8 25.2 28.8 34.8 17.8 SCS -18.2 -16.7 -14.3 -10.3 -17.5 Longevity 30.2 27.9 24.4 18.6 28.6 Fertility -3.9 -6.6 -10.6 -17.3 5.7 BCS -8.4 -10.3 -13.2 -17.9 -5.6 Average of Type 24.4 24.3 24.1 23.8 18.8 ¥ Negative values of CH
4 intensities are favorable.
Conclusions and Perspectives
Even without direct selection of CH4 intensity, the CH4 intensity in dairy cattle would be decreased however response to selection will be faster if
environmental traits are added on selection index. Similarly, energy balance related traits as BCS should be also considered along with environmental traits because of its dynamic relationship with CH4 intensity.
Further studies will focus on two major points: 1) providing more reliable estimates of genetic correlations among traits as these estimates have large influence on the results, 2) including other new environmental traits (energy efficiency, total CH4 emissions) in the alternative indexes through constraining profit from farm or with exact economic weights.
Literature Cited
Bastin, C., D.P. Berry, H. Soyeurt et al. (2012). J. Dairy Sci., 95:6113-6121.
Chilliard Y., Martin C., Rouel J. et al. (2009). J. Dairy Sci., 92:5199-5211.
Croquet, C., Mayeres, P., Gillon, A. et al. (2006). J. Dairy Sci., 89:2257-2267.
Dehareng, F., Delfosse, C., Froidmont E. et al. (2012). Animal, 6:1694-1701.
Dijkstra, J., van Zijderveld, S.M., Apajalahti, J.A. et al. (2011). Anim. Feed Sci. Technol., 166-167:590-595. FAO (2006). Livestock’s Long shadow- environmental issues and options, Italy.
Hayes, B.J., Lewin, H.A., and Goddard, M.E. (2012). Trends in Gen., 29:206-214.
Johnson, K.A., and Johnson D.E. (1995). J. Anim. Sci., 73: 2483–2492.
Kandel, P.B., Vanrobays, M-L., Vanlierde, A. et al. (2013). Adv. Animal Biosci., 4:279.
Soyeurt, H., Dehareng, F., Gengler, N. et al. (2011). J. Dairy Sci., 94:1657–1667.
van Knegsel, A.T.M., Brand H., Dijkstra, J. et al. (2007). J. Dairy Sci. 90:1467–1476.
Vanderick, S., Bastin, C., and Gengler, N. (2011).
http://www.elinfo.be accessed on Jan, 2014.
Vanlierde, A., Dehareng, F., Froidmont E. et al. (2013). Adv. Animal Biosci., 4:433.