This project is funded by the European Union under the 7th Research Framework Programme (theme SSH) Grant agreement nr 290752. The views expressed in this press release do not necessarily reflect the views of the European Commission.
Working Paper n°72
Exploring the whole effects of migration in
sending countries (Ecuador-Spain)
Ramon Mahia & Anda David
UAM, Universidad Autónoma de Madrid
Exploring the whole effects of migration in sending
countries (Ecuador-Spain)
Ramon Mahia & Anda David
April 2015
The main objectives of this piece of research are:
1. Describe the migration context
2. Describe living conditions and social integration from the arrival and during
the period of stay in Spain
3. Analyze the impact of Crisis, as external shock, in migration dynamics and
migrant’s welfare
4. Understand determinants of return by comparing returnees and stayers
5. Understand determinants of successful return
According to these objectives, this document briefly presents the main results of
two surveys, one conducted in Madrid on Ecuadorian current migrants and one
conducted in Quito and its province (Pichincha) on return migrants in the
2
Contents
Introduction ... 3
1. Questionnaire design ... 8
1.1. Common ground between the two surveys ... 8
1.2. The "return expectations" block ... 9
1.3. The "return" block ... 10
2. Sampling and data collection... 11
2.1. Current migrants survey ... 11
2.2. Return migrants survey ... 12
2.3. Sample representativeness ... 13
Madrid survey ... 13
Quito survey ... 16
3. Migration profile ... 21
3.1. Who are the Ecuadorian migrants? ... 21
Family composition ... 21
Education ... 23
3.2. What was their level of wellbeing prior to migrating? ... 24
3.3. Why and how did they migrate? ... 28
Migration reasons and decision making ... 28
Context of migration and arrival in Spain ... 31
3.4. What are their labor market outcomes? ... 36
4. Migrants’ wellbeing before and after the crisis ... 41
4.1. What was the level of migrant’s wellbeing before the economic crisis in Spain? ... 41
4.2. To what extent did the crisis impact the Ecuadorian immigrants? ... 43
4.3. What was the crisis impact on migrants’ labor market outcomes? ... 48
5. Integration aspects ... 50
5.1. Economic integration ... 50
5.2. Socio-cultural integration ... 51
6. Return migration ... 53
6.1. How did the crisis shape current migrants’ perception of returning to Ecuador? ... 53
6.2. What are the socioeconomic outcomes of return migrant in Ecuador? ... 55
Return decision making process ... 55
Labor market outcomes upon return ... 59
Changes in wellbeing after migration ... 59
7. Conclusion ... 61
References ... 66
APPENDIX ... 67
3
Introduction
The evolution of migration in Spain offers an excellent setting for researching migration dynamics.
In this context in which Spain has established itself as a migration destination, the Ecuadorian immigration is a particularly interesting case study
The approach of a double survey in Madrid and Quito is an innovative stand point that will allow a better understanding of migration dynamics, its effects on the welfare of migrants and origin households and, above all, of the factors that promote or inhibit the return of immigrants.
During the years of the economic boom in Spain (2001-2008), a growth model leaded by low productivity and high labor intensive sectors boost an extraordinary process of job creation. Around 4.7 million net jobs were created representing 31% of the total EU27 employment generated between 2001 and 20071.
This huge increase in labor demand could only be partially covered by the native workforce, thanks to slight increase in the native potential workforce, a slight increase in the rate of the native activity rate and a small rise in the native employment rate. But the combination of these three factors meant that there were "only" 2 million native employees to meet the labor demand, so the balance (to cover the 4.7 million jobs created) were filled by immigrants.
The total number of economic immigrants living in Spain in 2000 was only around 500,000 people but from the year, Spain started to experience one of the most intense voluntary immigration flows ever recorded in Europe. Nearly 4.5 million immigrants entered Spain between 2001 and 2008, with 3.6 million coming from poor countries (Graph 1). A total of 2.7 million immigrants eventually succeeded in finding employment; by early 20092, the number of foreigners residing in Spain had already surpassed 5.5 million; an increase representing 12% of its population in just 8 years.
* Faculty of Applied Economics, Universidad Autonoma de Madrid, Madrid.
1
Source: Eurostat. LFS. Seasonally adjusted data.
2
4 Graph 1. Stock of foreign population residing in Spain between 1998 and 2014
Source: Own elaboration with data from Municipal revision of Register (INE), Labor Force Survey (INE) and Residence Permits, (Ministry of Interior).
Then the economic bubble burst and the crisis came. The change in migration trend seen in Graph 2 is clearly explained by a context of extremely high economic difficulties, with a severe decline in labor demand and increasing unemployment. Additionally, the shrinkage of employment opportunities took place in a restrictive immigration policy context where the regulation change in 20113 consolidated the legal link between arrival and permanence of foreigners and job market needs, by means of considering the national employment situation and enhancing its measurement. In this difficult context, inflows of immigrants started to reduce very slowly but, at the same time, emigration of nationals but mainly return of resident immigrants began to rise markedly.
3
Law was approved on december 2009, through Organic Law 2/2009. Immigration Regulations approved by Royal Decree 557/2011, of April 20. Full text available at http://www.boe.es/boe/dias/2011/04/30/pdfs/BOE-A-2011-7703.pdf 0 1,000,000 2,000,000 3,000,000 4,000,000 5,000,000 6,000,000 7,000,000
5 Graph 2. Stock of foreign population residing in Spain between 1998 and 2014
Source: Own elaboration with data from Residential Variation Statistics. (INE).
In this context, Spain emerges as an ideal case of analysis of international migrations. The speed at which the phenomenon of boom-slowdown-drop occurred allows a distinctive study of migration dynamics of a single generation of immigrants. Indeed, the emigration from the origin country, the arrival in Spain, the stay, and the final return or its expectations are still fresh in the minds of the current residents or return migrants. A single generation of immigrants has undergone these various stages in just over a decade allowing a quasi-experimental analysis focused on the migration reasons, the residence context, the return motivations, and the role of an external shock such as the economic crisis in the migratory journey.
On the one hand, Ecuador is one of the main countries of origin of migrates residing in Spain, only surpassed by Romania and Morocco, thus ensuring a sufficiently large group of analysis.
It was estimated that between 1.5 million and 2 million Ecuadorians were living abroad in 2013, representing around 10.3-13.8-2% of the total population. The diaspora is mainly the result of two waves of migration: a first one in the early 1980s with migration flows towards the US and a second one in the late 1990s for which the main destination was Spain. This second wave, often characterized as "mass emigration", was triggered by a severe economic crisis resulting from low oil prices and floods damaging export crops, all this in a context of political instability and financial mismanagement (Jokisch, 2014). The economic crisis translated in a steep increase in unemployment, reaching 15%, an increase in poverty to 56% and a loss of value of the national currency (the Sucre) of more than two-thirds, pushing between 500 000 and 1 million Ecuadorians to emigrate between 1998 and 2005. The
2008 2009 2010 2011 2012 2013 Immigration 599.074 392.963 360.704 371.335 304.054 291.041 Emmigration and Return 288.432 380.118 403.379 409.034 446.606 547.89
0 100 200 300 400 500 600 700
6 main destination was Spain, where the lack of visa requirements, common language and significant demand of low-skilled informal jobs created a perfect destination. Graph 3 presents the evolution of the number of Ecuadorian nationals residing in Spain between 1998 and 2013 showing a spectacular increase that peaked in 2005 with the regularization law that granted legal status to almost 200.000 Ecuadorians.
Graph 3. Evolution of the number of Ecuadorians living in Spain between 1998 and 2013
Source: Instituto Nacional de Estadística (INE)
On the other hand, in the recent years of the crisis, the population of Ecuadorian origin presents a very strong return dynamic, considerably higher than that of nationals of other countries. For instance, according to data from the General Secretariat for Emigration and Immigration (Secretaría General de Emigración e Inmigración), the number of Ecuadorians living in Spain with a residence card fell by 49% between 2009 and 2013 while the population from other Latin American countries only declined by 21% over the same period, and that from Romania increased by 23%.
According to INE figures, between 2012 and 2013, Spain recorded 56 466 less Ecuadorians, including those with double nationality (Jokisch, 2014). Along the same lines, the SENAMI estimated having assisted more than 40 000 Ecuadorian migrant to return between 2008 and 2013.
Return migration is thus a significant phenomenon for Ecuador and our study aims at shedding light on the wellbeing of current and return Ecuadorian migrants, the determinants of their return and their socioeconomic integration and the role of the crisis among these determinants.
Usually, the study of return migration is based on surveying returnees in their country of origin (Cassarino, 2007; Sabadie, 2010), but they face the issue of selection into return; alternatively, return intentions are evaluated using studies made in receiving countries (Dustmann, 2003; Khoo et al., 2008; de Arce & Mahia, 2012), but the realization of these intentions are not observed. Therefore, the proper study of the return determinants requires implementing two surveys, one in the home country and one
0 100000 200000 300000 400000 500000 600000 19 98 19 99 20 00 20 01 20 02 20 03 20 04 20 05 20 06 20 07 20 08 20 09 20 10 20 11 20 12 20 13 Number of Ecuadorians
7 in the host country, in order to compare the returnees with an adequate reference population of non-returnees.
In our study, we have chosen specifically this approach; conducting a survey in Madrid and another one in Quito allowing the comparison of groups of returnees and non-returnees, thus determining more precisely the factors that drive or inhibit the return. This report presents the main results of the two surveys, with a focus on the impact of the crisis on the wellbeing of migrants. Thus, we will not systematically distinguish between current and return migrants, since this will be the focus of an upcoming research article. However, in some sections we present separately the results for the two samples, but merely with the scope of fully benefitting of the richness of the data and justifying our approach.
The report is organized as follows: a first section will be dedicated to the description of the sample and the field work, a second section presents the questionnaire structure and the third section analyses the results.
8
1. Questionnaire design
As discussed in the introduction, the methodological design was based on the realization of two “twin” surveys in Spain and Ecuador. Following the lines of the MIREM survey (EUI, 2007), both contain a common section dealing with the period prior to migration, the migration episode, and the stay in Spain. Additionally, the survey conducted in Quito includes a specific module on return, while in the Madrid survey, conducted on current resident migrants, we added a module of future return expectations.
Figure 1. Questionnaire design sketch
The common framework for the before and during migration gives us the opportunity to capture the determinants of the return decision and compare current migrants and return migrants. More importantly, this structure and the detailed block on the crisis impact will allow us to compare the socioeconomic wellbeing of individuals before and after the migration and also before and after the crisis. The two complete surveys are available upon request.
1.1. Common ground between the two surveys
The first two parts of the survey trace the migrants’ characteristics before the emigration and the detailed context of their migration episode.
QUITO
Survey
Screening for returnees Pre-migration Section Migration Block After Return sectionMADRID
Survey
Screening for NON returnees Pre-migration Section Migration Block Return Expectations SectionCommon
MIGRATION
module
Specific
SCREENING
modules
Specific
RETURN
modules
9 In the pre-migration block, migrants are asked both individual questions and questions about the family´s socioeconomic situation during the last year that preceded the individual’s outmigration.
At the individual level, questions focused on personal and family educational background and labor market situation, in particular concerning the last job.
The questions at the household level concerned the family structure and various aspects of welfare, using both objective and subjective dimensions of wealth.
In the migration block, one could find again questions at the individual and family /household level.
Some questions are focused on the moment of migration decision: decision making process, reasons to emigrate and to choose Spain, details on past migration episodes, migration intentions and expectations and documents used to enter the country.
In terms of family composition, we focus on the family structure at the moment of arrival and at the moment of the survey for current migrants or at the moment before the return for the return migrants, as well as on the migration (at the same time as the individual or through family reunification schemes) and nationality acquisition of the close family members, changes in marital status, birth and school enrollment of children.
Concerning the labor market situation, we restrict our questions to three key moments of the migration episode: the first job, the longest job abroad and, if different from the longest job, the current job (for current migrants) or the last job (for return migrants). The labor market block contains questions on the activity status, type and level of the job, type of contract, stability and wages and benefits.
As mentioned, a special block of questions was designed in order to measure the impact of the crisis in terms of socioeconomic wellbeing. The questions in this block are both at an individual and household level and cover topics as job losses, working condition deterioration, household indebtedness, evictions, discrimination and subjective perception of socioeconomic status.
Finally, we analyze integration asking detailed questions about the social network and social participation and the remitting behavior.
1.2. The "return expectations" block
For the current migrants, we introduce a block on the expectations of return, aiming to capture their willingness and their preparedness to return. Therefore, current migrants were asked about their short and long term intentions to return, their level of information about the return programs and the Ecuadorian context and their expectations concerning the life after an eventual return.
10
1.3. The "return" block
The questionnaire for the return migrants is slightly longer and contains a small block with questions on the preparation of the return and a detailed block on the socioeconomic integration after return. A first set of questions concern the decision making process concerning the return, the reasons behind it and the expectations relative to the welcome they received. Some specific questions were also added about whether the respondent had knowledge and eventually participated in assisted return programs both by the Ecuadorian and Spanish governments.
Furthermore, the “after return” block evolves around four main dimensions: the family composition, the labor market outcomes, the sociocultural integration and an assessment of the evolution of living conditions linked to the migration episode.
11
2. Sampling and data collection
The process of selection and training of interviewers was carefully designed as to ensure random selection of individuals with the required profile for each survey, given the size and complexity of some of their sections.
A specific annex at the end of this report describes field – work in detail but in this preliminary section we would like to briefly present the basic design of sampling strategy and some relevant issues concerning data collection process.
A total of 1.300 individuals were interviewed by means of two different surveys carried out in Madrid and Quito. Table 1 summarizes some basic data and dates for the different stages:
Table 1. Field work details
Madrid Quito
Pre-test: 3 and 4 June 1: 21-28 April/
2: 30 June-04 July Number of pre-test surveys
completed:
22 1st wave: 16
2nd wave: 4
Selection of interviewers: 1-20 June 1- 20 July
Briefing of interviewers: 23 and 24 June 21-23 July
Dates of interviews: 26 June-14 August 28 July-31 August
Number of interviewers: 22 20
Type of interview: Personal Personal
Language: Spanish Spanish
Duration: Aprox. 40 minutes Aprox. 50 minutes
Survey methodology: Random in the Madrid Region
(Comunidad de Madrid, CAM) (public venues, public transport,
work centers, etc.)
Snowballing from different databases of returnees. Screening applied in a first step and then personal appointment.
Surveys completed: 906 410
Data entry and recording: August – September 2014
Data clean - validation: September – November 2014
2.1. Current migrants survey
The first survey focuses on the analysis of the migratory experience of Ecuadorian migrants still living in Spain.
When designing the sample, we considered as valid observation units individuals of Ecuadorian nationality4, residing in Madrid city, with a minimum age at the time of migration of 15 years old and having been living in Spain for at least one year. Of course another crucial criterion was not having any other family members who already answered the survey.
12 The surveyors were carefully instructed to randomly conduct interviews in public places (parks, street, subway and train stations, Ecuadorian restaurants and bars, shopping areas, ports events, etc.), approaching individuals and asking them the preliminary questions that ensured that they belonged to the sample described above. Given that a significant share of the surveyors were of Ecuadorian origin, they were allowed to survey maximum 2 persons from their family and friends circle as long as they fitted the sample criteria. Additional instructions have been given during the survey as to orient the surveyors in order to obtain a sample whose characteristics in terms of sex, age, duration of stay and labor status would match the official Spanish statistics on Ecuadorian migrants residing in Spain. The survey took place during the months of July and August.
The final sample consists of 882 individuals, representing around 1.2% of the entire Ecuadorian population living in Madrid at the end of 2013 (75.298) according to the official municipal statistics.
2.2. Return migrants survey
The second sample consists of return migrants of Ecuadorian nationality, residing in Quito or its province (Pichincha), having a last migration episode of at least 1 year in Spain and having returned for at least a year at the moment of the survey.
According to the estimations of the Ecuadorian census itself, the number of immigrants who returned to Ecuador in the recent years (2005-2010) is of 63.888. Of these, approximately 46% came back from Spain (29.388). We thus need to bear in mind that our population of interest represents about 0.2% of the total Ecuadorian population. If we concentrate on a smaller geographical unit, as the province of Pichincha, with higher rates of return, where we eventually focus our study, the return migrant population is estimated to be of around 20.000 individuals. If about half of them come from Spain, the group would consist of no more than 8.500 individuals, out of a population of about 2.6 million in the province; that is, a group representing 0.3% of the province’s total population.
The main difficulty was the absence of a government census – both in Spain and Ecuador – that would have provided information for returnees’ location while also informing of their socio-economic status. Thus, in a first phase we started collecting information on : (i) returnees that attended the workshops organized for return migrants by the local government; (ii) returnees that filled signaled themselves on the website we had created for the survey; (iii) returnees that had been identified by the local associations we worked with; (iv) returnees that had benefitted from some specific return assistance programs launched at the time by the National Secretariat for Migrants (Secretaría Nacional del Migrante - SENAMI) and (v) returnees that were registered at the Ministerial job program as unemployed and looking for a job (in Spanish, Bolsa de Empleo del Ministerio de Relaciones Laborales de Ecuador).
13 However, since our population of interest was limited to migrants returning from Spain, this narrow definition made it difficult to obtain a sample large enough to randomly select persons to be interviewed. Therefore, we have tried to contact all the individuals that matched our criteria, but we have managed a successful contact with only 10% of them. This constitutes the original base for the fieldwork, which snowballed from there.
The survey was conducted during the month of August 2014 and the final sample consisted of 410 individuals.
2.3. Sample representativeness
The characteristics of the migrant sample in Madrid are remarkably consistent with the official data and other available studies concerning the resident Ecuadorian population in this region and their migratory trajectories. With respect to the sample of returnees, the analysis of their representativeness is more complex, since there is no official information on this group. On the other hand, the comparison of the sample of returnees with a sample of non-returnees is not at all relevant since, precisely, there may be differences between the two populations specifically related to return. Nevertheless, we present some indicators that aim to prove the validity of the sample of return migrants.
Madrid survey
First of all, we need to mention that the choice of Madrid for the field work was motivated by the fact that is host the highest share of Ecuadorian migrants. According to municipal statistics, Madrid has the largest Ecuadorian migrant population, 75.298 accounting for 28.6% of the total number of Ecuadorians in Spain (INE).
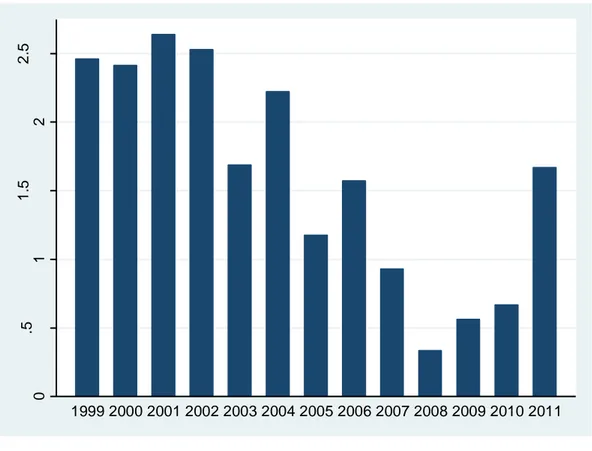
14 Graph 4. Distribution of the sample according the year of arrival
The sample distribution of arrival year shows that the migrant’s inflow started to appear as relevant at the beginning of the Ecuadorian economic crisis in 1997/98, significantly accelerated around the time of the dollarization (years 1999 / 2000) and started to decelerated from 2004 (Graph 4). This is exactly the same trend as the one observed for the national numbers as depicted in Graph 3. It is known that Ecuadorian women started the migration process slightly earlier than men, which is also confirmed in our sample: according to our data, 30% of women surveyed had arrived to Spain in 1999 compared with 22 % of men surveyed.
Table 2. Basic characteristics of the current migrants sample
Men Women Total
Age at the time of migration 27 26.1 26.5
Migration duration 12.9 13.2 13
Current age (at the time of the survey) 39.9 39.1 39.5
Spanish nationality 55.3% 66.6% 52.6%
N° obs 418 464 882
On the average, the Ecuadorian migrants in our sample are 39 years old and they had migrated around the age of 26 years with a slight difference between men and women related to our previous commented on the initiation of migration by women (Table 2). Again, if we compare to the age distribution of the total Ecuadorian population residing in Madrid, we notice that our sample roughly
0 .0 5 .1 .1 5 .2 D e n si ty 1980 1990 2000 2010 2020
Year of arrival
15 follows the same pattern, since according to INE data (Estadística del Padrón Continuo a 1 de enero de 2013) the highest share or Ecuadorian migrants are aged between 30 and 39 years old.
Graph 5. Age distribution of the Ecuadorian population living in Madrid, 2013
Source: INE
Concerning length of migration experience, we observe in our sample average migration duration of 13 years old, but we have to point out that this number only reflects the average duration for the migrants that have not returned.
In terms of nationality acquisition, 52.6% of the migrants in our sample have the Spanish nationality, which is very close to the national numbers provided by INE, according to which, at the end of 2013 8 Estadística del Padrón Continuo), 53.6% of the Ecuadorian residents had the double nationality. The percentage of nationality acquisition for the Ecuadorian population is very high and, in fact, Ecuadorians rank first in terms of naturalizations. This could be easily explained for reasons of historical and cultural closeness, for being one of the first countries of origin since the beginning of Spanish immigration era and or for the preferential conditions of access to nationality offered by our legislation5.
In terms of birthplace, the highest share was born in Quito (30.30%). The other two main origin cities are Loja (19.40%) and Guayaquil (11.60%).
5
The minimum prior period of residence in Spain required for Latin American citizens (as well as Andorra, Philippines, Equatorial Guinea and Portugal) is only two years, while generally for other nationalities the period required is 10 years. On the other hand, Latin American citizens can achieve Spanish nationality without waiving their own, something that does not always occur in the case of nationals from other countries. 0 5000 10000 15000 20000 25000 0-9 years 10-19 years 20-29 years 30-39 years 40-49 years 50-59 years 60-69 years 70-79 years over 80 years
16 Table 3. Main birth places and residence places for the current migrant sample
Top 3 birth place Top 3 residence place before migration
Quito 30.30% Quito 38.70%
Loja 19.40% Loja 12.40%
Guayaquil 11.60% Guayaquil 13.00%
If we compare place of birth with residence place before migration, there is a difference in the distribution across cities (Table 3). Again, most of the migrants were living in Quito and the percentage is even higher (38.70%), indicating that internal migration might be a pre-step in the case of Ecuadorian international migration.
As shown in Table 4, significant shares of those not living in the first two major cities (Quito and Guayaquil), move to Quito before emigrating. The transition matrix also allows us to observe the subsample of those that has a previous migration experience and did not migrate to Spain directly from Ecuador (1.1% of our sample).
Table 4. Transition matrix for the main birth place and residence place for the current migrant sample Birth place
Total Quito/Pichincha Guayaquil Loja Ambato Other
R es ide nce bef o re m igr at ion Quito/Pichincha 90.6% 4.9% 22.9% 5.6% 18.8% 39.1% Guayaquil 0.8% 86.3% 1.8% 0.0% 6.8% 12.9% Loja 0.8% 1.0% 58.2% 0.0% 2.3% 12.4% Ambato 0.4% 0.0% 1.2% 72.2% 2.0% 4.0% Abroad 1.1% 1.0% 0.6% 2.8% 1.3% 1.1% Other 6.4% 6.9% 15.3% 19.4% 68.8% 30.5% Number of observations 266 102 170 36 308 882
There are slightly more women in the sample (52.6%), but the same trend has been observed in the various surveys on immigrants in Spain (Jokisch, 2014). Despite the highest share of women, there is no notable gender difference in age and migration duration.
Quito survey
Following the similar logic as for the Madrid survey, we have conducted the survey in Quito city and its province Pichincha. The province of Pichincha, in the Andes region, is the second region in terms of population among the 24 provinces (approximately 2.600.000 inhabitants representing 18% of the total Ecuadorian population that was estimated at 14.5 millions). However it ranks first in terms of
17 population density. Its capital, Quito, is also the capital of the country and is the residence of more than60% of the population (approximately 1.6 million). It consists of 8 cantons although 87.6% of the population resides in the canton of Metropolitan District of Quito. Pichincha also concentrates the highest share of return migrants – 30.7% (Mejia, 2012). Using the 2010 census, Mejia (2012) estimates the number of return migrants in Pichincha to be slightly above 50 000 individuals, but this concerns all migration destinations (USA, Spain, etc.).
Graph 6. Distribution of the sample according the year of arrival
The distribution of the sample according to the year of arrival follows the same pattern as the sample of current migrants, with a peak in 2000 and a quick slowdown afterwards (Graph 6).
Table 5. Basic characteristics of the return migrants sample
Men Women Total
Age at the time of migration 29.4 27.3 28.3
Migration duration 9.7 9.3 9.5
Time since return 2.7 2.9 2.8
Current age 41.9 39.6 40.7
Spanish nationality 48.5% 52.8% 50.7%
N° obs 194 216 410
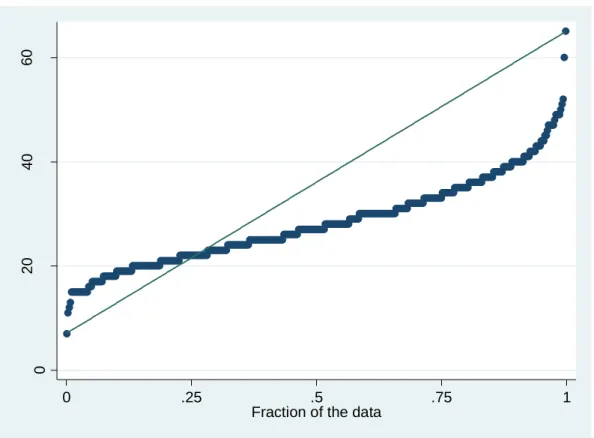
The average age at the time of migration is of 28 years for the entire sample, slightly higher than that of current migrants, especially for men (29.4 versus 27). The quintile distribution (Figure 2) confirms
0 .0 5 .1 .1 5 .2 .2 5 D e n si ty 1990 1995 2000 2005 2010
18 a higher clustering for the first quantiles corresponding to a slightly higher age at the time of migration for the return migrants.
Figure 2. Quintile distribution of the return migrant sample according to the age at arrival
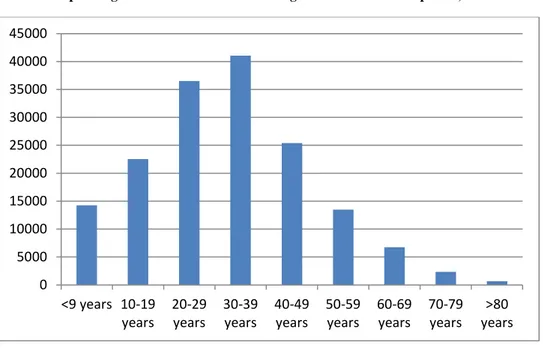
As expected, the migration duration is shorter, 9.5 years, than that of current migrants. This figure confirms the representativeness of the sample and its comparability with the Madrid sample since this migration duration in Spain, summed up with the average number of years since return (about 3 years on average), should match the average period of residence in Spain for the sample of current migrants (which is indeed of 13 years). That time since the return is on average of 2.8 years, confirming that return migration is a recent phenomenon. The age distribution is similar to that of current migrants, with an average age of 40.7 years, and, more importantly, is similar to that return migrants as computed in Mejia (2012) (Graph 7).
0 20 40 60 Q ua n til es o f Ed ad q u e te ní a cu an do vi aj o a E sp añ a 0 .25 .5 .75 1
19 Graph 7. Age distribution of the return migrants all destinations pooled, 2010
Source: Mejia (2012)
In terms of double nationality, 50.7% of the sample also has the Spanish nationality. This percentage is lower than that of current migrants, but this could be explained by two factors: the recent rapid increase in the number of nationality acquisitions in Spain (from 37.7% in 2011 to 53.44% in 2013) and the influence of having Spanish nationality as a factor inhibiting return. In terms of main birth and residence places before migration, the sample is clearly biased in favor of Quito, by construction.
Table 6. Main birth places and residence places for the return migrant sample
Top 3 birth place Top 3 residence place before migration
Quito 57.20% Quito 82.17%
Loja 3.67% Loja 0.70%
Guayaquil 2.20% Guayaquil 0.50%
The transition matrix shows nevertheless, that, for the most part, even those who were not born in Quito/Pichincha, had moved to the capital prior to their migration (Table 7).
0 5000 10000 15000 20000 25000 30000 35000 40000 45000 <9 years 10-19 years 20-29 years 30-39 years 40-49 years 50-59 years 60-69 years 70-79 years >80 years
20 Table 7. Transition matrix for the main birth place and residence place for the return migrant sample
Birthplace
Total Quito/Pichincha Guayaquil Loja Ambato Other
R es ide nce bef o re m ig ra ti o n Quito/Pichincha 90.3% 88.9% 66.7% 87.5% 59.6% 78.8% Guayaquil 0.0% 11.1% 0.0% 0.0% 0.7% 0.5% Loja 0.0% 0.0% 20.0% 0.0% 0.0% 0.7% Ambato 0.4% 0.0% 0.0% 12.5% 0.7% 0.7% Abroad 1.7% 0.0% 0.0% 0.0% 0.0% 1.0% Other 7.6% 0.0% 13.3% 0.0% 39.0% 18.3% Number of observations 237 9 15 8 141 410
We are fully aware that concentrating the sample in the province of Pichincha involves a certain degree of inconsistency with the sample in the region of Madrid: some of migrant returnees interviewed in Pichincha are not returning from Madrid and some of those interviewed in Madrid do not come from Pichincha. Limitations to perform two national surveys have prevented the perfect matching, but, in any case, we will show that the differences between the regions of origin and destination regions relative to the main variables of analysis are not very relevant.
21
3. Migration profile
3.1. Who are the Ecuadorian migrants?
The Ecuadorian migrant population is strongly marked by the family dimension: a significant percentage already had direct family in Spain before arriving here and half of the sample had brought family members through reunification programs after having arrived in Spain.
The data show a high average level of education among the migrant population in spite of which, one third of respondents say they have received additional training in Spain. Therefore, given the low skill of jobs created in Spain in the last decades, half of respondents feel overqualified for the work done in Spain.
Family composition
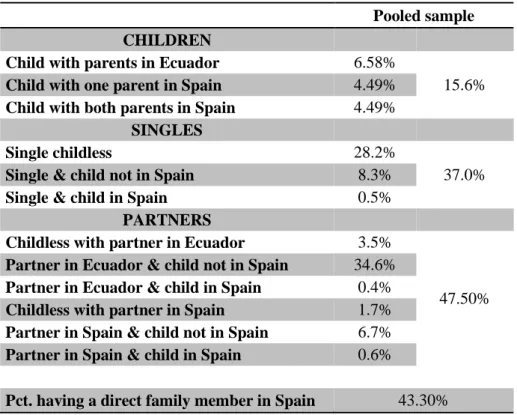
In terms of family status, most Ecuadorian migrants were in couple before having migrated (around 47.5% as shown in Table 8).
Table 8. Aggregated family status prior to migration
Pooled sample
CHILDREN
Child with parents in Ecuador 6.58%
15.6%
Child with one parent in Spain 4.49%
Child with both parents in Spain 4.49%
SINGLES
Single childless 28.2%
37.0%
Single & child not in Spain 8.3%
Single & child in Spain 0.5%
PARTNERS
Childless with partner in Ecuador 3.5%
47.50%
Partner in Ecuador & child not in Spain 34.6%
Partner in Ecuador & child in Spain 0.4%
Childless with partner in Spain 1.7%
Partner in Spain & child not in Spain 6.7%
Partner in Spain & child in Spain 0.6%
Pct. having a direct family member in Spain 43.30%
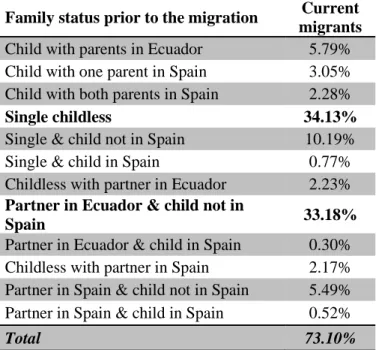
More than 70% of the sample declared having arrived alone in Spain (Table 9). Most of those who arrived alone in Spain were single and childless (34.1%), with very little difference between women (34.5%) and men (36.3%). However, slightly more than 33% went to Spain, leaving their spouse and children behind and this percentage is significantly higher for men (33.4%) than for women (24%).
22 Moreover, if we sum up the various categories, we find that almost 49% of migrants left behind at least a child. Among those who left behind children, almost 80% brought them to Spain later on through family reunification schemes.
Table 9. Distribution of migrants who declared having arrived alone in Spain across family type
Family status prior to the migration Current
migrants Child with parents in Ecuador 5.79% Child with one parent in Spain 3.05% Child with both parents in Spain 2.28%
Single childless 34.13%
Single & child not in Spain 10.19%
Single & child in Spain 0.77%
Childless with partner in Ecuador 2.23% Partner in Ecuador & child not in
Spain 33.18%
Partner in Ecuador & child in Spain 0.30% Childless with partner in Spain 2.17% Partner in Spain & child not in Spain 5.49% Partner in Spain & child in Spain 0.52%
Total 73.10%
Half of the sample has brought family members to Spain using family reunification schemes (almost 51%) and these reunifications mainly concern children and brothers or sisters (Table 10).
Table 10. Characteristics relative to the family structure
Pooled sample Has brought family through family reunification schemes 50.9%
Partner 25.7%
Children 50.6%
Brothers/Sisters 59.4%
Changes in marital status 29.8%
Marriage / Civil partnership 70.8%
Divorce/separation 26.6%
Widowhood 2.6%
Had children during migration 47.1%
Almost a third of the sample declared having experienced at least a change in their marital status during migration. For the most part, this change6 involved getting married or committed in a couple (about 71%). Furthermore, almost half of the sample has had children during migration.
23
Education
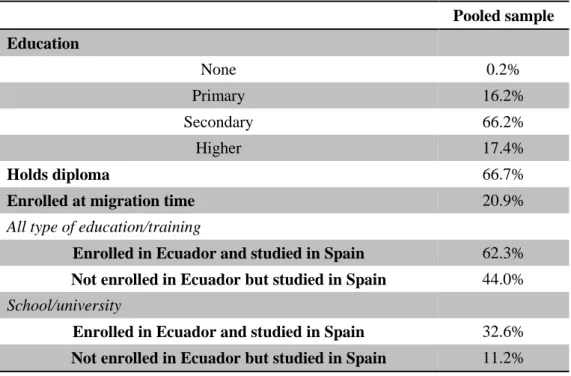
The education distribution is similar for current and return migrants, most of them having secondary education, which is not very far from the results of Mejia (2012), who finds that around 55% of the Ecuadorians abroad have secondary education. Nevertheless, only around 66% of them have a diploma. There seems to be evidence of positive selection since this percentage is significantly higher than the total Ecuadorian population, of which 35% has secondary education (according to the World Development Indicators of the World Bank). Still, the percentages for the tertiary education are similar for migrants (around 20% for current and return migrants) and total Ecuadorian population (21%). Furthermore, we see that around a fifth of the sample was enrolled in school or a type of training at the moment when they migrated (Table 11). Among those who were studying in Ecuador at the time of migration, slightly more than 62% also studied in Spain, but this percentage falls to 32.6% if we only consider those who were enrolled in formal schooling. This is due to the fact that most migrants underwent workplace training or job seeking training during their migration. Nevertheless, we notice that among those who were not enrolled in school at the time of migration, slightly over 11% were enrolled in school or university during their migration.
Table 11. Education characteristics
Pooled sample Education None 0.2% Primary 16.2% Secondary 66.2% Higher 17.4% Holds diploma 66.7%
Enrolled at migration time 20.9%
All type of education/training
Enrolled in Ecuador and studied in Spain 62.3%
Not enrolled in Ecuador but studied in Spain 44.0%
School/university
Enrolled in Ecuador and studied in Spain 32.6%
Not enrolled in Ecuador but studied in Spain 11.2%
Concerning the link between education and labor (Table 12), slightly more than half of the sample of current migrants and 42% of the return migrants declared having studied during their stay in Spain and around 34% of those who were working at the time of the survey, for current migrant, or who were working before the return, for return migrants, had professional training, mainly in the INEM. Among
24 those benefited from professional training, more than 60% of current migrant and almost 74% of returnees found it useful.
Table 12. Labor and education
Current migrants Return migrants
Has studied during migration 50.3% 42.4%
Had professional training 34.1% 33.9%
The training was useful 60.1% 73.7%
Match job-education
Completely 32.4% 42.4%
Overeducated 53.5% 47.7%
Undereducated 2.7% 2.5%
Level match but different field 11.2% 7.4%
In terms of matching between the job level7 and their education, most migrants perceive themselves as overeducated (53% of current migrants and 48% of returnees). Among those who see themselves as overeducated, only 24% for current migrants and 28% for return migrants have higher education, while the highest share has secondary education (70% of current migrants and 65% of returnees).
3.2. What was their level of wellbeing prior to migrating?
The data clearly shows that the vast majority of migrants emigrated even if they had a job in Ecuador with the idea, therefore, to improve their situation. As corroborated by many other studies, migration can only be met by those who have a minimum level of resources, linked to having a job and sufficient income, which would allow them to support the migration costs. Migration, therefore, does not occur in this case with the aim of economic survival but for improvement and, therefore, it is not related to extreme poverty in the home country but with relative poverty, originally perceived when the economic situation is compared with higher living standards that are associated with the opportunities that migration brings.
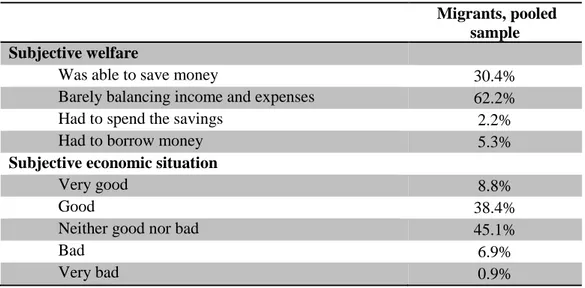
With regards to the subjective welfare, slightly more than 60% of the migrants declared that they were barely balancing their expenses and incomes (or living on a daily basis) before the migration (Table 13). However, we notice that around one quarter of the sample was able to save money prior to the migration.
7
The job used for this variable is the job at the moment of the survey for current migrants and the last job before the return for return migrants.
25 Table 13. Perceived wellbeing
Migrants, pooled sample Subjective welfare
Was able to save money 30.4%
Barely balancing income and expenses 62.2%
Had to spend the savings 2.2%
Had to borrow money 5.3%
Subjective economic situation
Very good 8.8%
Good 38.4%
Neither good nor bad 45.1%
Bad 6.9%
Very bad 0.9%
Migrants were also asked what is their subjective assessment concerning their economic situation before the migration and we observe that almost half of the migrants saw their situation as being “good” or “very good”. Interestingly, as Figure 3 shows, this subjective evaluation is rather well correlated to the objective situation as proxied by the number of durable goods owned by the household prior to the migration, with the average number of durable goods being significantly lower for those who saw their situation being “very bad” compared to those who answered “very good”.
Figure 3. Average number of durable goods owned by subjective welfare level, pooled sample
0 2 4 6 8 10 me a n o f d u r_ g o o d _ AM
26 As we might have expected, Figure 4 shows that there is correlation between education level and the perceived economic situation before the migration. As the education level increases, the share of individuals who report that their economic situation before the migration was “very good” or “good” increases while the share who perceived their situation as “bad” decreases.
Figure 4. Distribution of subjective economic situation before the migration for each education level, pooled sample
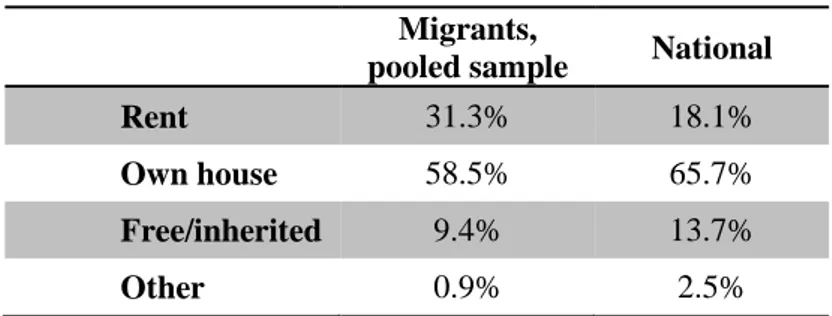
Before the migration, 58.5% of the migrants in our sample were living in a house that they owned (Table 14). This percentage is slightly lower that that at the national level which is of 65.7%, according to the figures from the Ecuadorian statistical institute (INEC, 2009).
Table 14. House ownership type Migrants,
pooled sample National
Rent 31.3% 18.1%
Own house 58.5% 65.7%
Free/inherited 9.4% 13.7%
Other 0.9% 2.5%
In terms of basic services, Figure 5 shows that both of our samples have almost full access to water, electricity and sanitation, with percentages higher than the national ones, especially for access to drinkable water. 0 10 20 30 40 50 60
Primary Secondary Higher Total Very good Good Neither good nor bad Bad Very bad
27 Figure 5. Access to basic services
The living standards of the households can also be captured through the durable goods that they possess. If we restrict the definition of durable goods to technological goods (which might show a less homogenous distribution), we observe that Ecuadorian migrants systematically rate better than the national averages (Figure 6). This indicates that emigrant households have better living conditions than the national averages and confirms the trends that we highlighted on the labor market outcomes.
Figure 6. Technological goods owned by households
95% 96%
68%
99% 99% 96%
95% 95%
90%
Current migrants Return migrants National Water Electricity Sanitation
89% 93% 67% 22% 91% 98% 66% 29% 87% 48% 18%
Refridgerator Television DVD/VHS Computer Current migrants Return migrants National
28
3.3. Why and how did they migrate?
The results suggest the central role of the family and its wellbeing in the migration dynamics. The economic improvement appears as the main reason for the migration, but the choice of the destination is marked by family migration patterns. Thus, improving living conditions and opportunities are evaluated and performed in a family context following individual migration dynamics and subsequent reunification.
Upon arrival in Spain, most immigrants declared having found a better country than they expected, but from that moment, a prolonged irregular stay awaited for them: about 85% of Ecuadorian migrants resided in Spain in an irregular status for more than two years. The effect of this irregularity on migrants’ achievements, in meeting their expectations and in the return is crucial in order to understand the impact of restrictive immigration policies, as well as that of exceptional or ordinary regularizations.
Migration reasons and decision making
Around 6% of return migrants and 7.6% of current migrants had another migration episode before coming to Spain. However, we are referring here to international migration, because, as shown in the simple description, a significant share of migrants had an internal migration experience before leaving Ecuador.
Among the migrants we have surveyed, 44.6% of current migrants and 39.2% of return migrants declared that they had a family member abroad8 before their own migration (Table 15). However, as Figure 7 shows, the percentage of persons that declared having a family member abroad increases with the year of arrival, signaling an amplification of the network effect on migration. In terms of remittances, around 17% of each sample declared that they were receiving remittances before having migrated and the percentage increases to 33% for current migrants and 36% for return migrants if we limit the sample to those who had family abroad.
8
The family members taken into consideration here were the father, mother, partner, children and brothers/sisters.
29 Table 15. Migration related characteristics
Current migrants Return
migrants
Had family in Spain 44.6% 39.2%
Main emigration reason
Economic 53.3% 72.0%
Family related reasons 25.2% 14.6%
Other 21.5% 13.4%
Main reason for choosing Spain
Had family and/or friends here 60.6% 69.0%
It was easier to have a visa or to enter the country 7.6% 13.2%
Job opportunities 12.8% 8.1% Cultural proximity 14.8% 8.8% Labor/study agreement 0.2% 0.2% Health reasons 0.2% Job transfer 0.3% 0.2% Other 3.4% 0.5%
Was receiving remittances 17.5% 17.3%
Had another migration experience 7.6% 6.1%
Decision making
Own decision 50.4% 48.5%
Decision taken by others 15.8% 5.4%
Joint decision 33.6% 46.1%
Figure 7. Percentage of individuals that had a family member in Spain by year of arrival
0 .2 .4 .6 .8 1 me a n o f fa m_ Sp a in _ AM 200020012002 200320042005 200620072008 200920102011 20122013
30 Moreover, these numbers indicate a lower bound for the migrants who already had family in Spain, since when asked about the reason to choose Spain as a destination, more than 60 to 70% of migrants declared that it was because they already had family or friends there. The higher percentage is due to an extended definition of “family” and the inclusion of friends.
Nevertheless, when asked what their main reason for leaving Ecuador was, most individuals conjure up economic motivations: 53% for current migrants and 72% for return migrants. The qualitative answers turn around the concept of improving the living conditions and ensuring a better future for their families. The second major reason for having migrated is related to the family (25% for current migrants and 15% for return migrants), mainly covering people who reunite with their spouses in Spain and children reuniting with their parents.
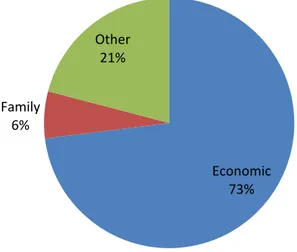
If we define a category for the individuals who migrated the first in their family and define them as “leaders”, we notice that economic related reasons rank first by large (Figure 8).
Figure 8. Distribution according to migration reasons for the subsample of « leaders »
When crossing the main motivation to leave Ecuador with the main reason for choosing Spain we observe that more than 60% of those who declare that they had migrated for economic reasons had chosen Spain because they had family in the country. Again, this points out to the joint importance of economic and family-related factors in the migration decision. The category “Other” for the main reason to emigrate mainly includes answers related to “gaining independence from parents” and “getting to know another country and/or another question”. Again, between 57% and 60% of them declared having family and/or friends in Spain, highlighting the pulling effect of networks.
Economic 73% Family 6% Other 21%
31 Figure 9. Distribution of migrants according to the decision-maker in the emigration process, by emigration reason
As Table 15 shows, around half percent of each sample declared that emigrating was their own decision, while 34% for current migrants and 46% for return migrants declared that the decision was taken jointly (most often with their spouses). However, when we cross the emigration reason and the decision-making (Figure 9), we notice that, in the case of current migrants, when individuals migrate for family related reasons, the decision was mainly taken by others, this result being mainly driven by the minor who travelled to Spain in order to reunite with their parents (the percentage falls from 36% to 15% when we exclude those who left Ecuador before the age of 18). In the case of returnees we do not observe the same result and this might be due to a lower share of the sample that migrated before the age of 18 (20% among current migrants versus 10% for return migrants), confirming once more that children who emigrate might be more reluctant to return, thus we do not capture them properly in our returnee sample. Among the current migrants for whom the decision to emigrate was taken by somebody else, women are overrepresented, accounting for 59.7% and their share is even higher if we exclude those who emigrated as minors, reaching 63%.
Context of migration and arrival in Spain
When asked about their first opinion of Spain compared to the image they had before migrating, most individuals responded that they had found the country to be better than their expectations (Figure 10). The shares range between 62% for current migrants to 80% for returnees, but no significant differences appear when we distinguish those who had already family Spain from those who did not or when we distinguish those who arrived before and after 2003.
0% 10% 20% 30% 40% 50% 60% 70% 80% Econ o m ic Fam ily Ot h er Econ om ic Fam ily Ot h er
Current migrants Return migrants
Own decision Others' decision Joint decision
32 Figure 10. First opinion of Spain compared to expectations
Figure 11 shows that the share of migrants who found upon arrival that the Spain was better than their expectations increases until 2005 and then starts to decrease, with a marked fall after the crisis. Actually after 2008, we notice a sharp increase in the share of new comers who found that the situation in Spain was worse than what they had expected.
0% 10% 20% 30% 40% 50% 60% 70% 80% 90%
Better Same Worse Doesn't remember
Had no expectations
Current migrants Return migrants
33 Figure 11. Evolution of the share of migrants who found Spain better/worse compared to their expectations, by year of arrival
Given that most migrants arrived before the start of the visa requirements in 2003, most of them declared that they did not need any document in order to enter Spain (67%). Figure 12 presents the distribution of migrants according to the documents they used to enter Spain, distinguishing between those who arrived before and after the visa requirements. We notice that after 2003, the share of individuals entering Spain with family reunification and work visa increases considerable compared to the previous period, as well as the percentage of migrants arriving with tourist visas.
0 .2 .4 .6 .8 2000 2001 2002 2003 2004 2005 2006 2007 2008 2009 2010 2011 2012 mean of expect_better mean of expect_worse
34 Figure 12. Distribution of migrants according to the documents used to enter Spain before and after 2003
Concerning the first legal status, if we add the migrants without a residence permit to those that mentioned a tourism visa, we get an estimation of more than 84% of the migrants interviewed with an irregular residence status upon arrival. The shares are even higher for those who arrived before 2003 reaching 95% for current migrants and 91% for returnees, but they remain significant for those who arrived after 2003 with 61% of current migrants having been irregular upon arrival and 71% for returnees. On average, current migrants spent 2.2 years in an irregular situation, while return migrants only spent 1.5 years on average.
Interestingly, if we compute the average number of years spent in an irregular status according to the year of arrival (Figure 13 and Figure 14), we notice a decrease over the years before the crisis and an increase after the crisis, especially for current migrants (since for return migrants, the trend is biased by their decision to return). The increasing difficulties for migrants to find or maintain a job, and thus obtain or renew a residence permit, after the crisis, explain this trend.
0% 10% 20% 30% 40% 50% 60% 70% 80% 90% 100% Before 2003 After 2003 Other Student visa
Family reunification visa Work visa
Turism visa
35 Figure 13. Average number of years spent in an irregular status by year of arrival, current migrants
Figure 14. Average number of years spent in an irregular status by year of arrival, return migrants
0 .5 1 1 .5 2 2 .5 me a n o f d m4 3 _ irre g _ ti me 1999 2000 2001 2002 2003 2004 2005 2006 2007 2008 2009 2010 2011 0 .5 1 1 .5 2 me a n o f d m4 3 _ irre g _ ti me 1999 2000 2001 2002 2003 2004 2005 2006 2007 2008 2009 2010 2011
36
3.4. What are their labor market outcomes?
The data clearly shows that the vast majority of migrants, returnees or not, emigrated even if they had a job in Ecuador with the idea, therefore, to improve their situation. As corroborated by many other studies, migration can only be met by those who have a minimum level of resources, linked to having a job and sufficient income, which would allow them to support the migration costs. Migration, therefore, does not occur in this case with the aim of economic survival but for improvement and, therefore, it is not related to extreme poverty in the home country but with relative poverty, originally perceived when the economic situation is compared with higher living standards that are associated with the opportunities that migration brings.
The labor market situation of migrants is a crucial element that needs to be grasped in order to understand their motivations to migrate, but also the evolution of their integration and living conditions after the migration. Table 16 presents the main labor characteristics of both samples in the year that preceded their outmigration. It´s very interesting to notice that more than three quarters of each sample (reaching almost 82% for return migrants) were employed in the year prior to their migration.
If we cross the labor market with the main migration reason, we notice that 79% among returnees and 64% among current migrants of the active employed declared having migrated mainly for economic reasons, meaning that having a job did not guarantee a sufficient income as to ensure good living conditions. Indeed, the qualitative answers reflect a search of better economic conditions and improving living standards. This also indicates that the good economic situation in Spain was crucial in attracting Ecuadorian migrants and acts as a powerful pull factor. Moreover, the high percentage of active employed among the emigrants might indicate that a minimum level of resources was needed in order to emigrate, in line with the predictions in the economic literature that mention a minimum level of wealth needed in order to overcome the migration costs, and the implication is that the individuals who migrated were not among the poorest ones. Nevertheless, we need to qualify the notion of “active employed” since significant percentages, especially for current migrants, declared not having a contract or having temporary contracts. Also, the high shares of employed and the low unemployment percentage, might indicate a high prevalence of underemployment.
37 Table 16. Labour market outcomes in the year previous to the emigration
Current migrants
Return migrants Labor status before migration
Active employed 76.9% 81.5%
Unemployed 2.0% 3.7%
Inactive 21.1% 14.8%
Main inactive reason
Studies 61.0% 67.2%
Housewife 16.0% 16.4%
Other 23.0% 16.4%
Self-employed 25.2% 26.3%
Type of contract (excluding self-employed)
No contract 42.7% 24.0%
Appointment (in the public sector) 5.4% 5.3%
Permanent contract 34.2% 35.0%
Temporary contract 14.7% 30.5%
Contract for specific task 3.0% 5.3%
Job satisfaction
Satisfied 62.9% 39.4%
Dissatisfied 18.6% 37.6%
Dissatisfied but ok 12.5% 15.8%
Very dissatisfied 5.9% 7.2%
Furthermore, for the inactive, we observe that main inactivity reasons were either related to being enrolled in school or having household responsibilities. Around a quarter of each sample declared having been self-employed, mainly in commercial activities (47% for current migrants and 36% for returnees).
Interestingly, a high share of the migrants declared themselves satisfied with their job at the time of migration, mainly for current migrants. Despite these high percentages, around 70% of those who declared themselves “satisfied” have migrated for economic reasons, often mentioning the willingness to improve their living conditions and ensure a better future for their families. What exudes from the qualitative answers is that the outmigration was motivated by opportunities and “pull factors” than by “push factors” such as the lack of jobs and insufficient income.
If we look at the labor market outcomes after migration, we observe that for both current and return migrants, the first labor status in Spain was “unemployed” (Table 17) and the distribution is very similar among the two samples. Table 18 matches the labor status in the year previous to the migration to the first labor status in Spain and we notice that among those who were active and employed before
38 migration around half were unemployed upon arrival in Spain. Furthermore, significant shares of those who were inactive, declared that they were students upon arrival.
Table 17. Labor market outcomes in Spain
Current migrants Return migrants
First labor status
Unemployed 44.9% 49.5% Wage worker 25.9% 28.5% Domestic worker 19.2% 12.0% Self employed 0.3% 1.0% Employer 0.1% 0.2% Student 8.6% 7.8% Housewife 0.9% 1.0%
Inactive for health or age reasons 0.1%
Average time before the first job (months)
4 3
First job obtained through family/friends
79.6% 82.0%
Average time unemployed (months)
24 11
Percentage of those who were never
unemployed 22.2% 27.0%
Moreover, a significant share of migrants declared that they were wage workers or domestic workers almost immediately after arrival and this is confirmed by the relatively short average time to find the first job (3-4 months), even in spite of not having a work permit in the vast majority of cases. This is linked to a large offer of informal jobs in Spain before the crisis, mainly in the construction and the domestic services sectors. Nevertheless, this average of time to find the first job increases for those arrived after 2003, as shown in Figure 15.
39 Table 18. Transition matrix between labor market status prior to migration and first type of occupation in Spain
Current migrants Return migrants Prior
After migration
Active employed
Unemployed Inactive Active employed Unemployed Inactive Unemployed 46.2% 55.6% 39.3% 53.3% 33.3% 32.8% Wage worker 29.5% 38.9% 11.3% 29.6% 33.3% 21.3% Domestic worker 20.4% 16.7% 12.9% 20.0% 4.9% Self-employed 0.3% 0.5% 1.2% Employer 0.2% 0.3% Student 2.8% 5.6% 30.1% 1.8% 6.7% 41.0% Housewife 0.6% 2.2% 0.9% 6.7% Handicapped 0.2%
Figure 15. Average months to find the first job according to the year of arrival for pooled sample
Only around 22% of the current migrants and 27% of the return migrants declared they have never been unemployed since having arrived in Spain or during their migration, but no clear trend appears with regard to their year of arrival of education that might indicate better opportunities. For those who faced unemployment spells, the average total time spent unemployed was of 2 years for current migrants and of 1 year for return migrants. Interestingly, the time spent unemployed is shorter for
0 5 10 me a n o f cd m 6 1 _ 1 200020012002 200320042005 200620072008 200920102011 20122013
40 return migrants, corroborating, at least in a first bivariate analysis, the qualitative answers according to which migrants who were unemployed chose to return before their situation deteriorated further . Moreover, around 80% of each sample declared having found their first job through their family and/or friends, highlighting the networks’ importance for the Ecuadorian migration.
41
4. Migrants’ wellbeing before and after the crisis
4.1. What was the level of migrant’s wellbeing before the economic crisis in
Spain?
The welfare analysis on migration and return is a central aspect in this study as part of the NOPOOR poverty project. The results clearly suggest that migration leads to an improvement in subjective wellbeing compared to the situation in Ecuador, at least when the baseline for the comparison is the situation in Spain before the outbreak of the crisis.
The perception of the improvement in welfare during their migration in the pre-crisis period implies that two-thirds of immigrants considered their situation equal or better than the Spaniards themselves, even though the aggregate figures have always indicated worse living conditions for the foreigners.
When discussing the wellbeing during the migration, we need to make a clear distinction between the period before the crisis and after the crisis in Spain. If we compare their subjective welfare level before the migration to the one after having migrated, but before the crisis (Table 19 and Table 20), we notice that most of the migrants declared that they were able to save money before the crisis. This indicates a rather good economic situation almost 80% of the current migrants and 74% of the return migrants.
Table 19. Transition matrix for the subjective welfare in Ecuador and in Spain before the crisis, current migrants Before migration Total Was able to save money Barely balancing income and expenses Had to spend the savings Had to borrow money Spai n, bef o re cr isi s
Was able to save
money 81.8% 79.1% 66.7% 80.0% 79.8%
Barely balancing
income and expenses 16.4% 19.7% 26.7% 20.0% 18.8%
Had to spend the
savings 0.7% 1.0% 6.7% 1.0%