ANALYSE DU POTENTIEL DE PRODUCTION DE BIOCARBURANTS PAR LA CULTURE DE CANOLA (BRASSICA NAPUS L.) SUR LES TERRES MARGINALES DU
QUEBEC ET REDUCTION DES IMPACTS LIES A SA CULTURE
par
Charles Beaudette
memoire presente au Departement de biologie en vue de l'obtention du grade de maitre es sciences (M.Sc.)
FACULTE DES SCIENCES UNIVERSITE DE SHERBROOKE
1*1
Library and Archives Canada Published Heritage Branch 395 Wellington Street Ottawa ON K1A0N4 Canada Bibliotheque et Archives Canada Direction du Patrimoine de I'edition 395, rue Wellington Ottawa ON K1A 0N4 CanadaYour file Vote reference ISBN: 978-0-494-65613-6 Our file Notre reference ISBN: 978-0-494-65613-6
NOTICE: AVIS:
The author has granted a
non-exclusive license allowing Library and Archives Canada to reproduce, publish, archive, preserve, conserve, communicate to the public by
telecommunication or on the Internet, loan, distribute and sell theses
worldwide, for commercial or non-commercial purposes, in microform, paper, electronic and/or any other formats.
L'auteur a accorde une licence non exclusive permettant a la Bibliotheque et Archives Canada de reproduire, publier, archiver, sauvegarder, conserver, transmettre au public par telecommunication ou par Nntemet, preter, distribuer et vendre des theses partout dans le monde, a des fins commerciales ou autres, sur support microforme, papier, electronique et/ou autres formats.
The author retains copyright ownership and moral rights in this thesis. Neither the thesis nor substantial extracts from it may be printed or otherwise reproduced without the author's permission.
L'auteur conserve la propriete du droit d'auteur et des droits moraux qui protege cette these. Ni la these ni des extraits substantiels de celle-ci ne doivent etre imprimes ou autrement
reproduits sans son autorisation.
In compliance with the Canadian Privacy Act some supporting forms may have been removed from this thesis.
Conformement a la loi canadienne sur la protection de la vie privee, quelques
formulaires secondaires ont ete enleves de cette these.
While these forms may be included in the document page count, their removal does not represent any loss of content from the thesis.
Bien que ces formulaires aient inclus dans la pagination, il n'y aura aucun contenu manquant.
14-1
Canada
Le4aout 2010
lejury a accepte le memoire de Monsieur Charles Beaudette dans sa version finale.
Membres du jury
Professeur Robert L, Bradley Directeur de recherche Departement de biologie
Professeur Donald L. Smith Codirecteur de recherche Departement des sciences
Universite McGill
Professeure Anne Vanasse Membre externe Departement de phytologie
Universite Laval
Professeur Joan Whalen Membre externe Departement des sciences
SOMMAIRE
Le rechauffement global du climat serait attribuable majoritairement aux emissions de gaz a effet de serre dans l'atmosphere par les activites humaines comme la combustion des combustibles fossiles, la deforestation et les activites agricoles. Les biocarburants, des combustibles renouvelables et capables de mitiger les emissions de gaz a effet de serre, pourrait reduire notre dependance aux combustibles fossiles et aider a la lutte contre les changements climatiques. De plus, L'implantation de systemes de culture intercalaire (SCI) serait une alternative de choix permettant de revaloriser les terres marginales quebecoises et restaurer une partie de leur fertilite originelle, ce qui permettrait de faire pousser les cultures de biocarburants sans faire competition aux cultures nourricieres deja presentes sur les terres agricoles fertiles. Le present travail s'inscrit done au sein d'un reseau de chercheurs pan-canadien, le reseau des cultures vertes, afin de determiner les rendements potentiels d'une culture de canola pour la production de biocarburants sur des terres marginales et d'evaluer l'impact de cette culture sur les emissions d'oxyde nitreux, un puissant gaz a effet de serre.
Nous avons demontre au premier chapitre que la culture de biocarburants sur les terres marginales quebecoises est possible avec l'implantation de systemes de culture intercalaire, que ces systemes peuvent mitiger les emissions d'oxyde nitreux des terres agricoles et que certains cultivars de canola performants peuvent aussi accroitre les emissions d'oxyde nitreux.
Dans le second chapitre, nous avons trouve une tendance vers des rendements superieurs et des besoins nutritionnels inferieurs pour les biocarburants de deuxieme generation en comparaison avec ceux de la premiere generation et nous avons estime que la substitution du tiers de notre consommation de combustibles fossiles serait realisable avec 10 % des terres agricoles mondiales ainsi que les terres marginales par la production de biocarburants.
REMERCIEMENTS
Je tiens tout d'abord a remercier mon superviseur Dr. Robert L. Bradley pour son soutien et sa grande disponibilite tout au long de ma maitrise. J'aimerais egalement remercier mon co-directeur Dr. Donald L. Smith pour son optimisme contagieux et sa grande generosite, ainsi que les membres de mon comite de maitrise, Dr. Bill Shipley et Dre. Anne Vanasse pour leurs judicieux conseils et leur expertise respectifs dans le domaine des statistiques et de
l'agronomie. J'aimerais adresser un remerciement tres special au coordonnateur de laboratoire Benoit Lapointe pour son temps et ses connaissances techniques qui me furent d'un grand secours durant mon terrain.
Le projet n'aurait pas pu etre mene a terme sans l'aide des nombreux stagiaires qui sont venus donner un precieux coup de main: Melanie Bergeron, Jul Bradley, Mederic Lanoix, Xavier Francoeur, Philippe Gregoire, Gilles Joanisse, Hilde Marie Johansen, Andre-Anne Lamarche, Jerome Quirion, David Robert, Renee Roy et Maxime Thibeault. J'aimerais egalement remercier Mme Marielle B. Ares pour m'avoir permis de mener l'ensemble de mes experiences sur ses terres. Je veux aussi remercier les gens du laboratoire, et tout specialement Mathieu Dufresne, pour m'avoir permis de lacher mon fou a quelques reprises durant mes etudes graduees.
Aussi, j'aimerais remercier mes parents, freres et amis pour leur support inconditionnel, ainsi que ma copine pour endurer son boodett's au quotidien.
Ce projet a ete rendu possible grace au support financier du Conseil de Recherches en Sciences Naturelles et en Genie du Canada (CRSNG) par les subventions accordees au reseau des cultures vertes (Green Crop Network, GCN).
TABLE DES MATIERES
SOMMAIRE ii REMERCIEMENTS iii
TABLE DES MATIERES.... iv LISTE DES TABLEAUX vi LISTE DES FIGURES '. vii
INTRODUCTION 1
CHAPITRE 1 - TREE-BASED INTERCROPPING DOES NOT COMPROMISE CANOLA (BRASSICA NAPUS L.) SEED OIL YIELD AND REDUCES SOIL NITROUS OXIDE
EMISSIONS 3 1. Avant-propos.... 4
2. Abstract 6 3. Introduction 7 4. Materials and Methods 10
4.1. Experimental design 10 4.2. N20 flux measurements... 12 4.3. Soil sampling and analyses 13 4.4. Physiological measurements 14
4.5. Yield estimates 14 4.6. Statistical analyses 15
5. Results 16 5.1. Seed oil concentration and yield 16'
5.2. N20 emissions 20 5.3. Plant leaf traits 21 5.4. Soil moisture, microbial biomass and potential nitrification 23
7. Conclusion 27 8. References 29
CHAPITRE 2 - PERSPECTIVE DES RENDEMENTS ET IMPACTS ENVIRONNEMENTAUX DES CULTURES DE PREMIERE ET DEUXIEME
GENERATION DESTINEES A LA PRODUCTION DE BIOCARBURANTS 32
1. Avant-propos 32 2. Introduction 34 3. Developpement 37 3.1. Intrants fertilisants 37 3.2. Emissions de gaz a effet de serre.... 41
3.3. Superficie agricole necessaire 45
4. Conclusion 48 5. Bibliographic ; 50
CONCLUSION ....52 BIBLIOGRAPHIE 54
LISTE DES TABLEAUX
1. Average soil properties at the St-Edouard experimental site before fertilization in
2007 11 2. Effects of canola cultivar and plant environment on photosynthetic rates (A40o)
and specific leaf area (SLA) of canola leaves grown in 2007 and 2008. Also displayed are significant interactions between fertilizer-N rate x canola cultivar in controlling photosynthetic rates. Standard errors are shown in parentheses. Italicized lower-case letters represent statistically different (a = 0.05) means,
according to Tukey's HSD test 22 3. Effects of plant environment (TBI at 1, 4 and 7 m distance from poplar rows, and
CM) on soil water content and potential nitrification rates. Different lower-case letters in italic represent statistically significant (P<0.05) means within each year,
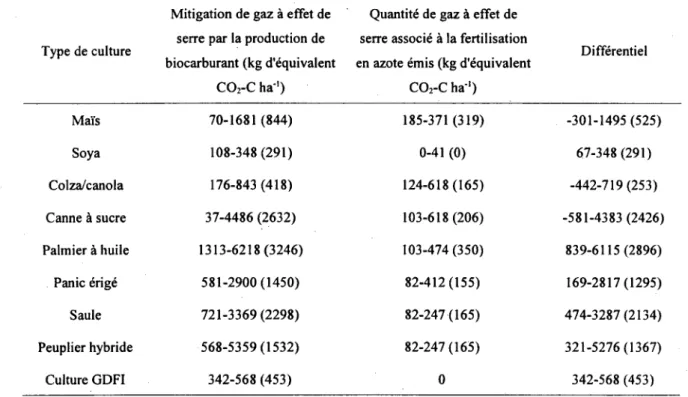
according to Tukey's HSD test. Standard errors are shown in parentheses 23 4. Valeurs Remissions de gaz a effet de serre mitigees par l'utilisation de
biocarburants et produits par l'utilisation de fertilisants en azote pour differents types de culture associes a la production de biocarburants de premiere et deuxieme generation. On suppose ici un cout de transport et de manufacture de 2.9 kg d'equivalent C02 par kg de fertilisant produit ainsi qu'un cout de
degradation du fertilisant sous forme de N20 de 4.65 kg d'equivalent C02 par kg
de fertilisant produit (Snyder et al., 2009). Le tableau se base sur les donnees presentees a la figure 6, avec l'etendue possible repertoriee dans la litterature
LISTE DES FIGURES
1. Average canola seed oil concentrations in relation to (a) fertilizer-N application rates and (b,c) plant environments. Different lower-case letters designate statistically significant (P<0.05) means within each frame according to Tukey's
HSD test. Error bars = 1 S.E 16 2. Average canola seed oil yield in relation to fertilizer-N application rates and plant
environments. Lines and curves represent significant linear and quadratic trends.
Error bars = 1 S.E 18 3. Average seed oil concentration and yield of canola cultivars tested in 2007 and
2008. Different lower-case letters designate statistically significant (P<0.05)
means within each frame according to Tukey's HSD test. Error bars = 1 S.E 19 4. Average soil nitrous oxide (N20) emissions in relation to (a) plant environments
and (b) canola cultivars, over the 2008 growing season. Different lower-case letters designate statistically significant (P<0.05) means within each frame
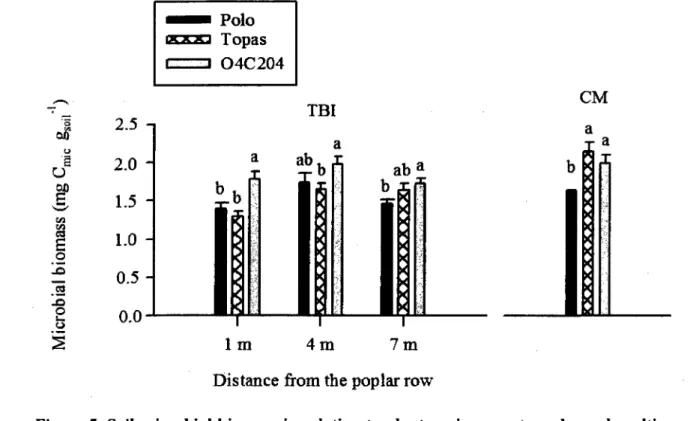
according to Tukey's HSD test. Error bars = 1 S.E 20 5. Soil microbial biomass in relation to plant environments and canola cultivars,
over the 2008 growing season. Different lower-case letters designate statistically significant (P<0.05) means within each cluster according to Tukey's HSD test.
Error bars = 1 S.E 24 6. Intrants de fertilisants azotes et rendements en biocarburants de cinq cultures de
premiere generation et quatre cultures de deuxieme generation. Les barres d'erreur montrent l'etendue des intrants ou rendements de la litterature citee dans le texte. L'acronyme GDFI signifie « grande diversite a faible intrants », traduit
INTRODUCTION
En 2007, le panneau intergouvernemental sur les changements climatiques a publie son quatrieme rapport devaluation sur le phenomene des changements climatiques. Dans ce rapport, l'organisme dresse un portrait alarmant des consequences des activites humaines sur le climat et les ecosystemes (IPCC, 2007). En effet, le phenomene du rechauffement global du climat serait attribuable en grande partie aux emissions considerables de gaz a effet de serre rejetes dans l'atmosphere, qui provienneht majoritairement de la combustion des combustibles fossiles, de la deforestation ainsi que des activites agricoles. De plus, il est probable que ce rechauffement climatique deviendra la cause de l'augmentation de la frequence des evenements climatiques extremes, comme les ouragans, de la desertification de certaines regions du globe, de l'inondation d'une quantite importante de regions cotieres ainsi que de problemes d'approvisionnement et de qualite de l'eau.
C'est dans l'optique de mitiger l'impact des changements climatiques sur les populations humaines ainsi que sur les ecosystemes que certains groupes de recherche ont vu le jour au niveau national et international, dont le reseau des cultures vertes (Green Crop Network ou GCN). II s'agit d'un reseau pan-canadien de chercheurs qui se specialise dans la gestion durable des gaz a effet de serre au sein des systemes de production agricole. Parmi les nombreux volets de recherche entrepris par ce reseau, l'un d'entre eux consiste a trouver des cultures agricoles presentant un fort potentiel de production de biocarburants, des combustibles renouvelables pouvant remplacer ('utilisation des combustibles fossiles et fabriques par les plantes a partir des gaz a effet de serre atmospheriques.
Par contre, la culture de biocarburants s'effectue la plupart du temps sur des terres agricoles fertiles qui servent deja a nourrir les populations humaines. De plus, l'organisme Statistique Canada a estime en 2006 que, depuis 1960, la moitie des terres agricoles du Quebec n'ont maintenant plus de vocations agricoles (Statistique Canada, 2006). Une grande partie de ces
terres sont maintenant des terres marginales, epuisees par une agriculture trop intensive pour etre ensuite laissees a l'abandon par les producteurs agricoles parce que leurs rendements ne sont pas economiquement rentables. L'implantation de systemes agroforestiers, comme les systemes de culture intercalate (SCI), serait une alternative de choix permettant de revaloriser ces terres marginales par la culture d'especes ligneuses qui contribueraient a restaurer une partie de la fertilite originelle du site (Rivest et Olivier, 2007). II serait alors possible de faire pousser les cultures de biocarburants sur ces terres marginales converties et done de ne pas faire competition avec les cultures nourricieres.
Mon projet de mattrise a consiste a entreprendre une serie d'experience pouvant repondre a des objectifs de recherche pertinents s'inscrivant au sein des axes de recherche du reseau des cultures vertes sur des terres marginales du Quebec, en monoculture ainsi qu'en systeme de culture intercalaire. En premier lieu, j'ai elabore avec l'aide de mon superviseur Dr. Robert L. Bradley une serie d'experience visant a tester le potentiel de la culture de canola pour la production de biocarburants et a evaluer les variations de ce potentiel selon les cultivars utilises, le taux de fertilisants en azote appliques et le type de systeme agricole dans lequel la culture a pousse. Dans un deuxieme temps, je me suis egalement interesse aux emissions d'oxyde nitreux (N20), un puissant gaz a effet de serre, produit par les activites agricoles afin
d'observer dans quelle mesure les traitements experimentaux etablis lors du premier volet de mes recherches peuvent influencer les emissions de N2O provenant de la culture de canola.
Le premier chapitre de ce memoire consiste done en les resultats de ces deux volets de recherche presenter sous la forme d'un article scientifique. Le deuxieme chapitre consiste quant a lui en une revue de litterature des rendements et impacts environnementaux d'une grande variete de cultures de biocarburants de premiere et deuxieme generation, presentee sous la forme d'un essai.
CHAPITRE 1
TREE-BASED INTERCROPPING DOES NOT COMPROMISE CANOLA (BRASSICA NAPUS L.) SEED OIL YIELD AND REDUCES SOIL NITROUS OXIDE
EMISSIONS
C. Beaudette8, R.L. Bradley*8, J. Whalenb, P.B.E. McVetty', K. Vesseyd, D.L. Smith6
a Departement de biologie, Universite de Sherbrooke, 2500 boul. de l'Universite, Sherbrooke,
Quebec, J IK 2R1, Canada.
b Department of Plant Science, Macdonald Campus, McGill University,
Ste-Anne-de-Bellevue, Quebec, H9X 3V9, Canada.
c Department of Plant Science, University of Manitoba, Winnipeg, Manitoba, R3T 2N2,
Canada.
d Department of Biology, Saint Mary's University, Halifax, Nova Scotia, B3H 3C3, Canada.
* Author for correspondence: Robert.Bradley@USherbrooke.ca
Tel : 1 -819-821 -8000, ext. 62080
1. Avant-propos
Ce chapitre comprend I'ensemble des experiences que j'ai menees au cours de ma maitrise. Essentiellement, il tente de repondre aux questions suivantes :
• De quelle facon les rendements de differents cultivars de canola, destinee a la production de biocarburants, sont-ils influences par la fertilisation en azote et par le systeme de culture dans lequel la culture est implantee ?
• Quels sont les impacts de la culture de ces cultivars sur les emissions de gaz a effet de serre par les terres agricoles et comment varient-ils en fonction de la fertilisation en azote et le systeme de culture dans lequel la culture est implantee ?
Ces questions refletent bien le compromis present au sein de la culture de biocarburants, puisqu'au-dela d'etre une source d'energie renouvelable, cette culture doit egalement mitiger les emissions de gaz a effet de serre par rapport a l'utilisation des combustibles fossiles pour etre une alternative valable dans le schema energetique mondial. Or, les terres agricoles sont une source importante de gaz a effet de serre par le phenomene de denitrification, qui relSche dans l'atmosphere une quantite importante d'oxyde nitreux (N20), un gaz a effet de serre 300
fois plus efficace que le dioxyde de carbone (C02). De plus, ce gaz est produit majoritairement
sur les terres agricoles en raison de l'apport en azote que nous fournissons aux cultures pour en augmenter les rendements. En vue de considerer les benefices reels de la production de biocarburants sur la mitigation des gaz a effet de serre, il est done crucial d'estimer l'empreinte ecologique complete des cultures de biocarburants. Puisque les emissions d'oxyde nitreux sont reputees pour etre tres variables, a la fois dans l'espace et dans le temps, nous avons mis sur pied un design experimental permettant de saisir cette variability, en repetant nos mesures quatre fois durant la saison, ainsi qu'en quatre blocs experimentaux differents sur le meme site. Pour permettre un aussi grand nombre de donnees, les chambres utilisees ont toutefois ete
cogues avec un volume plus petit que celles normalement utilisees dans ce genre d'experience. Ce compromis diminue done sensiblement la precision de chaque mesure, mais ces dernieres sont prises un plus grand nombre de fois, ce qui permet un meilleur discernement des tendances entre les traitements experimentaux.
De plus, les experiences contenues dans ce chapitre furent menees sur des terres marginal isees du sud du Quebec pour en tester le potentiel agricole pour la culture de biocarburants. Ainsi, il est possible de produire des biocarburants sans faire competition aux ressources alimentaires mondiales. En vue d'obtenir des rendements qui restent rentables pour les producteurs agricoles, l'etablissement de systeme de culture intercalaire (SCI; tree-based intercropping system ou TBI en anglais) propose de revaloriser les terres marginalisees en restaurant a long terme la fertilite des sols, par divers mecanismes comme un apport considerable de litiere annuelle au sol par les arbres ou encore une rhizodeposition importante de carbone dans le sol par les racines des arbres, ce qui permet d'encourager le processus d'humification.
Dans ce chapitre, j'ai cerne les hypotheses de recherche de concert avec mon superviseur Dr. Robert L. Bradley. J'ai ensuite entrepris la mise en place des cultures de canola sur les terres agricoles disponibles. J'ai egalement fait 1'ensemble du travail d'echantillonnage et de laboratoire avec l'aide de nombreux stagiaires, dont l'elaboration d'un protocole d'utilisation du chromatographe en phase gazeuse muni d'un detecteur pouvant mesurer les concentrations d'oxyde nitreux dans les echantillons gazeux recoltes tout au long de la saison 2008. J'ai analyse les donnees recoltees, redige le premier jet du manuscrit presente dans ce chapitre et apporte les correctifs necessaires avec mon superviseur en vue de soumettre ce manuscrit a un periodique scientifique. Le manuscrit presente dans ce memoire est done la forme initiale soumise au periodique « Agriculture, Ecosystems & Environment », qui vient tout juste d'etre accepte pour publication.
2. Abstract
Recent concerns over rising oil prices and greenhouse gas emissions have sparked an interest for the production of first generation biofuels on marginal agricultural land in Eastern Canada. Field trials were established to compare canola seed oil yield and soil nitrous oxide (N2O) emissions in tree-based intercropping (TBI) and conventional monocropping (CM) systems. The 4-5 y-old TBI system comprised alternating rows of hybrid poplar and high-value hardwood species, with 8 m wide alleys. Each cropping system was planted with six canola cultivars, grown at four fertilizer-N rates. Seed oil concentrations decreased linearly with fertilizer-N, while seed oil yields increased either linearly or following a quadratic trend. An optimal fertilization rate was estimated at 80 kg N ha"1. Seed oil concentrations were higher in
the CM than in the TBI system, but the two systems did not differ significantly in terms of seed oil yield. N20 emissions were three times higher in the CM than in the TBI system,
probably as a result of higher soil moisture. The cultivar that produced the highest seed oil yield also produced significantly more N20, probably as a result of greater available C in the
rhizosphere. Our results may be useful to future life cycle assessments for analyzing the net environmental impacts of producing and distributing fertilizer-N to biofuel crops, and the choice of cropping system and canola cultivar that minimize N20 emissions. In a first instance,
we conclude that our model TBI system did not compromise canola seed oil yields, while substantially reducing soil N20 emissions.
Keywords: Biofuel, Canola {Brassica napus L.), N fertility, Seed oil yield, Soil N20
3. Introduction
Rising oil prices and concerns about greenhouse gas emissions have sparked an interest in the production of biofuels as alternatives to fossil fuels. Canola (Brassica napus L.) and related Brassicaceae species (e.g. B. rapa L. and B. juncea (L.) Czern) are already important oilseed crops, providing 12% of the world's comestible vegetable oil supply (United States Department of Agriculture, 2008). As the second largest canola producing country, Canada is thus poised to increase its production of feedstock for first generation biofuels. Accordingly, the Canadian Green Crop Network (GCN) was established in 2006 to develop the scientific knowledge and technologies to grow canola to expand Canada's bio-energy portfolio.
There is a consensus emerging that bio-energy crops must not encroach on land currently producing food. In Canada, canola is primarily grown for food in the western prairie provinces, whereas eastern Canada produces less than 10 % of revenues generated by this crop (Canola Council of Canada, 2008a). In the eastern province of Quebec, the area of land under cultivation has decreased from 6.8 Mha in 1951 to 3.5 Mha in 2006 (Statistique Canada, 2006; Tessier et al., 2009). Much of this abandoned land is lying fallow and could be revitalized to grow crops such as canola for bio-energy. There is a need, therefore, to estimate potential seed oil yields of canola in the cooler and wetter climate conditions of Eastern Canada, and to test novel cropping systems that wouid entice would-be producers to return fallow land into biofuel crop production. Field trials should focus on the response of seed oil yield to soil N fertility. On the one hand, total seed yields are expected to increase with soil N fertility, but a concomitant increase in seed protein content could result in lower seed oil concentrations.
Incentives to cultivate abandoned land are possible through innovative ideas that provide landowners with market outlets for value-added production systems. Tree-based intercropping (TBI), which consists of widely spaced tree rows and annual alley crops, is one such system with potential economic and environmental benefits (Bradley et al., 2008). Within a TBI
system, tree roots may absorb nutrients that are leached below the rooting zone of alley crops thereby increasing nutrient cycling efficiency and decreasing environmental impacts (Allen et al., 2004). When combining fast-growing short-rotation trees such as hybrid poplars (Populus spp.) and high-value hardwood trees such as black walnut (Juglans nigra L.), TBI systems are expected to supplement the landowners' income over that he would receive by conventional mono-cropping (CM) (Gordon, 2008). Within the context of future cap-and-trade carbon markets, TBI systems could also generate revenues because trees fix atmospheric C02 during
their growth and tend to increase soil C sequestration (Peichl et al., 2006). It is uncertain, however, whether trees will interfere with or facilitate the growth of canola when it is grown as an alley crop. On the one hand, TBI systems have been shown to improve soil fertility (Thevathasan and Gordon, 2004), but trees also compete for soil resources and cast shade on the intercrop, which could reduce yields. It is, therefore, necessary to compare canola seed oil concentrations and yields in TBI and CM systems.
One major concern related to the agronomic production of biofuels is the impact this activity may have on soil denitrification, the process by which nitrate (NO 3") is reduced by facultative anaerobic bacteria. Nitrous oxide (N20), a volatile intermediate product in the denitrification
pathway, is approximately 300 times more effective (per mole) as a greenhouse gas than C02
(Forster et al., 2007). The environmental benefits of producing bio-energy to reduce C02
emissions from fossil fuels could thus be offset if the associated agronomic practices increase soil N20 emissions. Denitrification rates are increased by the availability of soil N03 : acting as
terminal electron acceptor during cellular respiration, the availability of reduced C compounds that drive heterotrophic metabolism, and by low oxygen concentrations. Denitrification is thus expected to increase with fertilizer N application, with crops producing high amounts of labile rhizodeposition products, and with cropping systems that maintain high soil moisture.
We report on canola field trials established on revitalized fallow land in the province of Quebec, as part of the GCN's research activities. Three canola cultivars were grown in each of
2007 and 2008, on a pilot study site that included replicated TBI and CM systems, each cropped at four N fertility levels. We hypothesized that yields would be lower near the tree rows than in the center of the alleys because of competition for light and soil resources. We also hypothesized that seed oil concentration would decrease with increasing soil N fertility, and tested how this would affect seed oil yield. Lastly, we hypothesized that denitrification would increase with N fertilization, and also tested how canola cultivars and cropping systems would affect N20 emissions. In order to gain insights into the factors controlling seed oil yield
and N20 emissions, we also measured soil moisture, soil microbial biomass, potential
4. Materials and Methods
4.1. Experimental design
Field trials were conducted at St-Edouard-de-Maskinonge, Qc (46°20' N, 73° 11' W) in 2007 and 2008. Soil characteristics are given in Table 1. The experimental design consisted of TBI and CM systems replicated in four blocks. The TBI systems consisted of rows of high-value hardwood species {Fraxinus americana L., Fraxinus pennsylvanica Marshall and Quercus rubra L.) alternating with rows of fast-growing hybrid poplars {Populus x canadensis "Stormont" and Populus x canadensis), all planted in the spring of 2004. The tree rows were oriented along a South-West to North-East axis. Adjacent tree rows were separated by 8 m wide alleys in which canola was sown in each of the two study years. In 2007, the high-value hardwoods were about 1 m tall whereas the hybrid poplars were about 4 m tall, with a well developed canopy. Alleys were disk-harrowed in mid-May, prior to sowing and fertilizing. Twelve treatments, consisting of three canola cultivars x four N fertility rates, were randomly assigned to 12 plots within each replicated cropping system. These 8 m long alley plots were established perpendicular to two adjacent tree rows, with hybrid poplars on the South-East side and slow-growing hardwoods on the North-West side of the alley. Given the space constraint of fitting twelve treatment plots into TBI and CM cropping systems of pre-established size, each treatment plot was 1 m wide. In order to reduce possible edge effects, adjacent plots were separated by 30 cm wide geo-textile strips. The plots in the CM systems were identical in size and orientation to those in the TBI systems, but excluded the tree rows.
Table 1
Average soil properties at the St-Edouard experimental site before fertilization in 2007. Texture Organic matter (%) Total C (mg/g) Total N (mg/g) C:N Ratio Mehlich-extractible (ppm) Mehlich-extractible (ppm) P^lwater P K Sandy loam 4.59 26.65 1.99 13.39 1.20 4.37 5.9
The canola cultivars used in 2007 were Q2, Sentry and 46A65. These cultivars vary in seed yield and seed oil concentration. Q2 is a high seed yield, blackleg resistant cultivar (Stringam et al., 1999). Sentry is blackleg resistant, medium seed oil concentration cultivar (Rimmer et al., 1998). 46A65 is a Pioneer Hi-Bred, high seed yield, blackleg resistant cultivar (Canola Council of Canada, 2008b). The canola cultivars used in 2008 were Polo, Topas and 04C204. Polo is a Danisco-bred, high oil concentration cultivar (Rahman et al., 2001). Topas is a Swedish spring canola cultivar marketed in 1982, created from parental lines (Bronowski x Guile) x Hermes (Nordic Genetic Resource Center, 2009). 04C204 is a very high oil yield line (hereafter referred to as "cultivar") recently developed by the Plant Science Department, University of Manitoba.
Sowing was done by hand in the third week of May. Plant density was estimated at approximately 60 plants m", below the recommended density of 80 plants m' (Conseil des productions vegetales du Quebec, 1996). According to Angadi et al. (2003), yields are not significantly altered at this density because canola plants compensate with increased
branching. The four fertilizer N rates were 0, 40, 80 and 120 kg N ha'1 applied as urea by hand.
All plots received a blanket application of 80 kg P205 ha"1 and 80 kg K20 ha"1 according to
provincial guidelines (CRAAQ, 2003), applied as triple superphosphate and potash. Boron and sulphur were also added in 2008, at 2 and 20 kg ha"1 respectively.
Within TBI systems, the taller hybrid poplar rows were expected to create a gradient of light and soil conditions. For this reason, plots within TBI systems were sampled in "subplots" at 1 m, 4 m and 7 m from the row of hybrid poplars. These three subplots, along with a single sampling location in the center of each CM plot, comprised a third experimental factor that we designated as the "plant environment". Thus, the full experimental design consisted of a full factorial array of three canola cultivars x four fertilizer N rates x four plant environments, replicated four times (N = 192).
4.2. N20 flux measurements
In 2008, soil N20 emissions were measured with closed-top cylindrical chambers (5.25 cm
radius x 15 cm high) on four dates (July 8th, July 22rd, August 5th and August 22nd). The top 5
cm of each chamber was insulated with foam and equipped with a rubber septum. Cylinders were inserted 10 cm deep into the soil in each of the 192 treatment plots, and 8 ml of headspace air was sampled after 1 h. Soil temperature at 5 cm depth was monitored for each sample. During the incubation, a 22 gauge needle was kept inserted in the septum in order to maintain equal gas pressure with the surrounding air while minimizing N20 loss from the
headspace (Hutchinson and Mosier, 1981). Gas samples were injected into 3.0 ml BD Vacutainer® Plus plastic serum tubes (Becton- Dickinson and Co.., Franklin Lakes, NJ) and transported to the laboratory where N20 concentrations were measured using a Varian
CP-3800 gas chromatograph (Varian Inc., Palo Alto, CA) equipped with a 80-100 mesh Hayesep® packed column, an electron capture detector (ECD), with ultra-high purity N2 as carrier gas.
N20 measurements were corrected to a common temperature of 20 °C by assuming Q10 = 2,
and extrapolated to a ha"1 day'1 basis.
4.3. Soil sampling and analyses
A soil sample (0-10 cm) was collected from each of the 192 sampling locations twice in 2007 (July 3rd and August 11*), and following each N20 measurement in 2008. These were
transported to the laboratory where they were sieved (2 mm) and kept at 4 °C until analyzed. Soil water content was determined by weight loss after drying subsamples at 101° C for 72 h.
Soil available C in each soil sample was inferred from microbial biomass (Bradley and Fyles, 1995) measured by substrate induced respiration (SIR) rates (Anderson and Domsch, 1978). Soil subsamples (20 g dry wt. equiv.) were placed in 500 ml plastic containers and amended with ground and sieved (65 urn) glucose (1000 |ug C g"1). Glucose was first mixed with talc
(9:1 = talc:glucose), and 500 mg of the mixture was dispersed through each soil subsample using a handmixer with one beater. The subsamples were left uncovered for 100 min in order to reach optimum SIR rates (Anderson and Domsch, 1978). The headspace of each container was then flushed for 5 min with ambient air and sealed with lids equipped with rubber septa. Headspace air was sampled after 30 min using a needle and syringe, and CO2 concentrations were detected with a CP-2002 P Micro-GC gas chromatograph (Chrompack, Middelburg, The Netherlands) equipped with a thermal conductivity detector (TCD), using He as carrier gas. SIR rates were corrected to 20 °C by assuming Q10 = 2 and converted to microbial biomass with equations derived by Anderson and Domsch (1978).
Potential nitrification rates were measured by placing 25-30 g fresh subsamples in Mason jars, covering these with a polyethylene film to allow gas exchange and prevent dessication, and incubating in the dark at ambient temperature for 30 days. Soil subsamples were then extracted in 100 ml of IN KC1 solution, stirred for 1 h on a rotary shaker, and the supernatants poured through Whatman No. 5 filter papers. Logistical constraints prevented us from
analyzing all of the extracts, therefore samples were pooled across cultivars and N fertility levels to test only the effects of "plant environment" on potential nitrification. Pooled extracts were analyzed colorimetrically for N03' using a Technicon Autoanalyser (Pulse
Intrumentations Ltd., Saskatoon, Canada), with sulphanilamide color reagent and a Cu-coated Cd reduction column.
4.4. Physiological measurements
Photosynthetic rates (A400) were measured in each subplot once in 2007 during the flowering stage (July 21s,-23rd), and three times in 2008, at stem elongation (June 27th-28th), early
flowering (July 11th- 12th) and late flowering stages (July S O ^ r ' ) , using a LI-COR 6400
portable photosynthesis system (LI-COR Inc., Lincoln, NE). Measurements were made on a newly expanded leaf borne on the main shoot of a randomly chosen plant. In 2007, the leaf remained on the plant during the measurement, while in 2008 the leaf was clipped from the plant and placed in a water tube in order to rehydrate prior to measurement (Wong et al., 1979). Each measurement was achieved under a photosynthetic photon flux density of 1000 umol m"2 s"1, and at a C02 concentration of 400 ppm. All leaves were then kept in total
darkness during 48 h to deplete their sugar reserves (Gamier et al., 2001), scanned to determine their surface with WinFOLIA© software (Regent Intruments Inc., Quebec, Canada), dried at 30° C for two days and weighed. Specific leaf area (SLA) was thus estimated for every leaf as the ratio of leaf surface area to dry mass.
4.5. Yield estimates
The 192 subplots were harvested by hand at the end of August of each year. Ten plants were randomly chosen, air-dried at 30°C for 1 wk, and threshed to extract the seeds. Seeds were weighed and sent to the Plant Biotechnology Institute - National Research Council (Saskatoon, Canada) in 2007, and to the Department of Plant Science - University of
infrared spectroscopy. Seed oil yield in each subplot was estimated from seed weight of 10 plants, planting density and seed oil concentration.
4.6. Statistical analyses
Linear mixed-effects models were used to control the effects of sampling date and blocks (i.e. random variables) while testing the effects of cultivar, N fertility and plant environment, as well as their interactions, on all response variables. The models took into account the nested structure of the split-plot design. Orthogonal polynomials were used to test the statistical significance of linear and quadratic trends in yield as a function to N-fertilhy Tukey's HSD tests were used to reveal statistically different means in the other response variables. All tests were performed using the lmer package from R statistical software (2009) and used a = 0.05 to designate statistical significance.
5. Results
5.1. Seed oil concentration and yield
In both years, seed oil concentration decreased linearly (P<0.01) with fertilizer-N application rate (Fig. la). Average seed oil concentration in 2007 (43.7 %) was lower (P<0.01) than in 2008 (49.1 %). Seeds harvested at 1 m and 4 m from poplar rows in the TBI system had lower oil concentrations (42.7 % and 48.5 % for 2007 and 2008 respectively) than those grown in the CM system (46.6 % and 50.9 % for 2007 and 2008 respectively) (Fig. lb,c).
wt ) (% dr y o 'i h c u u 5 oi l See d 5 5 H 50 -45 40 (a) 3 Z -0 ~-5L_ • 2007 o 2008 " - a - — * 40 80 120 N-fertilizer application rate (kg N ha" )
?
t
!1
oi l See d 55 50 45 40 55 50 45 40 " ( b ) b 1*1 TBI b 2 ab 2007 CM 1m 4 m 7 m (c) b r - i - i b ab 5 -2008 a n*n 1 tn 4 m 7 m Distance from the poplar rowFigure 1. Average canola seed oil concentrations in relation to (a) fertilizer-N application rates and (b,c) plant environments. Different lower-case letters designate statistically significant (P<0.05) means within each frame according to Tukey's HSD test. Error bars = 1 S.E.
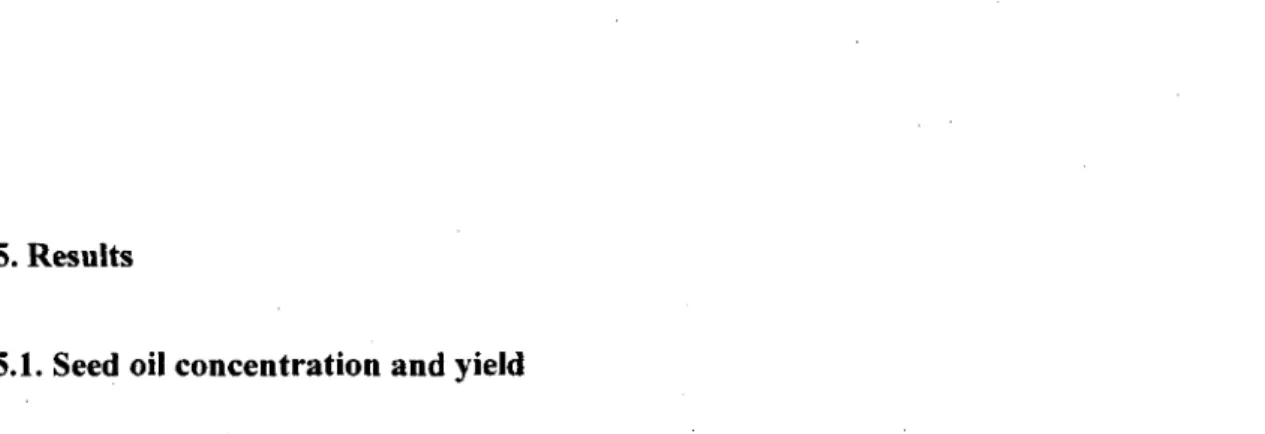
Yields ranged from 0.7 to 1.3 Mg ha'1 in 2007 and from 1.0 to 2.2 Mg ha"1 in 2008. In 2007,
seed oil yield increased linearly (PO.01) with fertilizer-N application rate (Fig. 2a). Seed oil yield at 1 m from poplar rows was lower (P < 0.01) than at 7 m. In 2007, average seed oil yield in the TBI system was numerically higher (1.1 Mg ha"1) than in the CM system (0.9 Mg
ha'1), but the difference was not statistically significant. In 2008, seed oil yield was affected by
an interaction (P=0.02) between N fertilization rate and plant environment (Fig. 2b). More specifically, a quadratic trend (P = 0.02) between yield and fertilizer-N application rate was observed at 1 m (P<0.01) and 7 m (P=0.02) from the tree rows, whereas a linear trend was observed at 4 m and in the CM system. In 2008, average seed oil yield in the TBI system was lower (1.6 Mg ha"1) than in the CM system (1.9 Mg ha"1), but the difference between the two
systems was only significant (P<0.01) at the highest fertilizer-N application rate. The two treatments that provided the highest yield (2.8 Mg ha"1) were 04C204 fertilized with 80 kg N
1
bo•s.
CO 3 -i2 H
0(a) 2007
3 - i 2 1 0 0(b) 2008
40 80120
I S E
T"
0
40 T T80 120
N-fertilizer application rate (kg ha"
1)
T B I - l m - • — T B I - 4 m - A - TBI-7 m
CM
Figure 2. Average canola seed oil yield in relation to fertilizer-N application rates and plant environments. Lines and curves represent significant linear and quadratic trends. Error bars = 1 S.E.
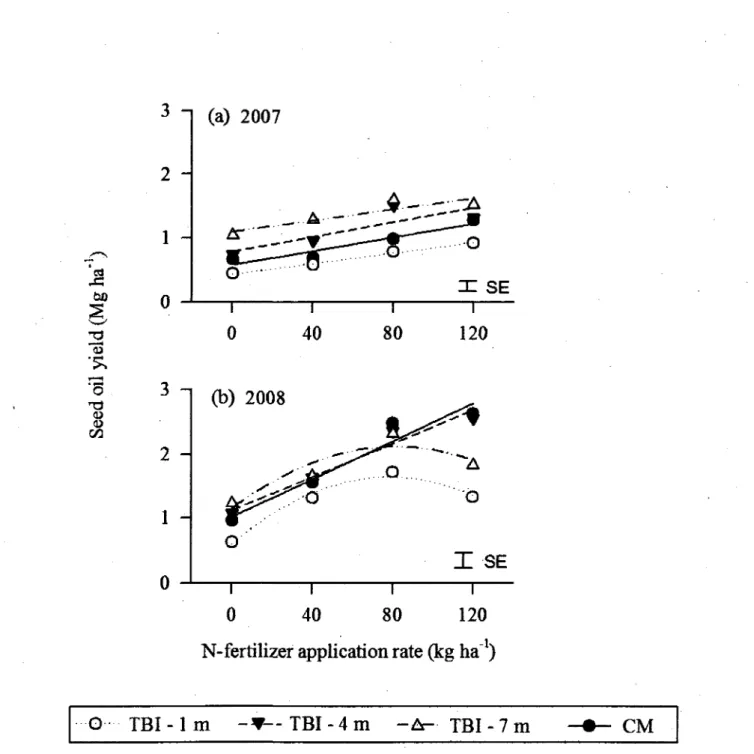
In both years, cultivars had an effect on seed oil concentration and yield. In 2007, seed oil concentration was lower (PO.01) for Q2 (42.2 %) than for 46A65 (44.0 %) and Sentry (44.8
%) (Fig. 3a). In 2008, seed oil concentration was higher (P<0.01) for Polo (51.0 %) than for Topas (47.7 %) and 04C204 (48.5 %) (Fig. 3b). In 2007, Sentry had higher (P=0.03) seed oil yield (1.1 Mg ha"1) than Q2 (1.0 Mg ha"1) (Fig. 3c). In 2008, 04C204 had higher (P=0.04) seed
oil yield (1.9 Mg ha"1) than Polo (1.6 Mg ha"1) (Fig. 3d).
•a es is § §.
I
^P
2007 55 50 45 40-(a)
a i b i a r - 5 - i 1a'
<* <? & 2008 55 50 45 40-(b)
a 1 b i-E-n 1 • b [-5-] i 4S <# s<£ ^ Q"£
•V - 2.5 -i op 2.0 ^ i . o 2 0.5-I
o.o
(c)
^ ab i • b i a • ia"
»* 2.5 -i 2.0 1.5 -\ 1.0 0.5 0.0(d)
b-5-ab
-I-« or a ^ Canoia cultivars
Figure 3. Average seed oil concentration and yield of canoia cultivars tested in 2007 and 2008. Different lower-case letters designate statistically significant (P<0.05) means within each frame according to Tukey's HSD test. Error bars = 1 S.E.
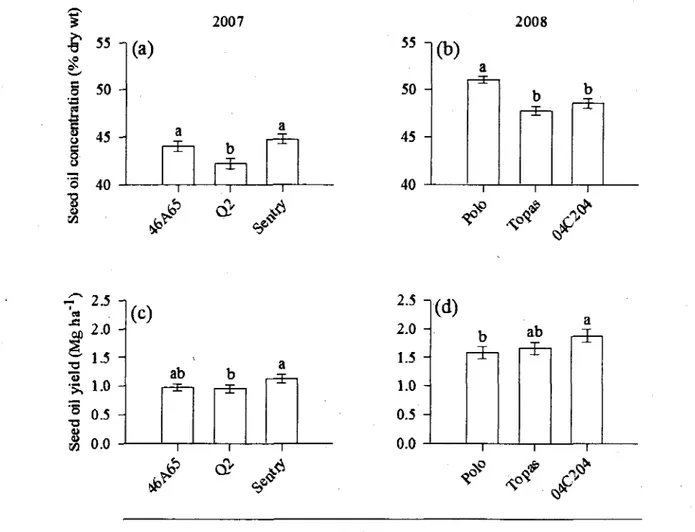
5.2. N20 emissions
Fertilizer-N application rate had no effect (P=0.24) on N20 emissions in 2008. N20 emissions
were more than three times higher (PO.01) in the CM system (60 g N20-N ha'1 day"1) than in
the TBI system (17 g N20-N ha'1 day'1) (Fig. 4a). N20 emissions were more than twice as high
(P<0.05) with 04C204 (39 g N20-N ha"1 day"1) than with Polo (15 g N20-N ha'1 day"1) (Fig.
4b). CM day' 1 ) 'a O Z •22 X fl u O
z
8 0 -i 60 40 20 -00 TBI b T JL b T _l_ b ^TP^
1 1 1 l m 4 m 7 mDistance from the poplar row
80 60 40 20 -0 (b) ab Polo Topas 04C204 Canola cultivars
Figure 4. Average soil nitrous oxide (N20) emissions in relation to (a) plant environments and (b) canola cultivars, over the 2008 growing season. Different lower-case letters designate statistically significant (P<0.05) means within each frame according to Tukey's HSD test. Error bars = 1 S.E
5.3. Plant leaf traits
fn 2007, photosynthetic rates were 15-17 % lower (P=0.01) at 1 m from poplar rows than in the other three plant environments (Table 2). In 2008, plant environment had no effect on photosynthetic rates of leaves that had been excised and re-hydrated prior to measurement. For both years, there was a significant N-fertility x canola cultivar interaction controlling photosynthetic rates (P=0.03 and P=0.02 for 2007 and 2008 respectively) (Table 2).
In 2007, SLA was higher (P=0.03) for Sentry than for 46A65 (Table 2). In 2008, SLA was
Table 2
Effects of canola cultivar and plant environment on photosynthetic rates (A4oo) and specific leaf area (SLA) of canola leaves grown in 2007 and 2008. Also displayed are significant interactions between fertilizer-N rate x canola cultivar in controlling photosynthetic rates. Standard errors are shown in parentheses. Italicized lower-case letters represent statistically different (a = 0.05) means, according to Tukey's HSD test.
46A65 Q2 Sentry TBI - 1 m TBI - 4 m TBI - 7 m CM 16.88a 16.14a 16.95a
A40o (umol C02 m"2 s"1) 2007 0 kg ha'1
(0.96) (1.20) (1.04) 18.74a 16.88a 16.60a 40 kg ha"'
(0.92) (0.73) (1.12) 16.386 19.37a 19.51a 19.71a 20.82a6 22.02a 18.326 (0.72) (0.61) (0.57) (0.47)
80 kg ha1
(0.82) (0.69) (1.16) 20.00a 21.91a 18.84a (1.31) (0.79) (1.05)
Polo Topas 04C204 8.33a 9.86a 9.88a (0.51) (0.58) (0.49) 9.82a 10.81a 10.34a
(0.58) (0-62) (0.41) 11.06a 10.66a 10.77a 11.02a 10.876 12.91a 11.126 (0.36) (0.32) (0.34) (0.33) (0.58) (0.53) (0.52) 11.416 13.76a 11.316 (0.64) (0.57) (0.54) 46A65 Q2 Sentry 120 kg ha'1 2008 0 kg ha"1 40 kg ha1 80 kg ha"1 120 kg ha"1 SLA (cm2 g1) 2007
267.116281.49a6 292.77a 314.71a 281.966 286.26a6 238.88c (6.16) (6.68) (7.52) (8.07) (5.36) (8.68) (5.12)
Polo Topas 04C204
2008
347.6a 329.56 340.3a6 352.0a 347.1a 346.3a 311.26 (5.19) (4.87) (5.01) (5.86) (5.66) (6.09) (5.08)
higher (P<0.01) for Polo than for Topas. In both years, SLA was higher (PO.01) in the TBI than in the CM system. In 2007, SLA was higher (PO.02) at 1 m than at 4 m from poplar rows.
5.4. Soil moisture, microbial biomass and potential nitrification
Average soil water content in 2008 was about 3% lower (P<0.01) with Topas than with the two other cultivars (data not shown). In both years, soil water content was higher (P<0.01) in the CM than in the TBI system (Table 3).
Table 3
Effects of plant environment (TBI at 1, 4 and 7 m distance from poplar rows, and CM) on soil water content and potential nitrification rates. Different lower-case letters in italic represent statistically significant (P<0.05) means within each year, according to Tukey's HSD test. Standard errors are shown in parentheses. T B I - l m 0.1466 (0.003) 0.2226 (0.002) 1.29a (0.53) 20.296 (127) T B I - 4 m 0.148a6 (0.003) 0.2256 (0.002) 1.27a (0.36) 22.3 la6 (1.26) T B I - 7 m 0.1466 (0.003) 0.2256 (0.002) 1.45a (0.37) 22.96a6 (1.62) CM 0J57a (0.004) 0.247a (0.003) 1.52a (0.54) 24.26a (1.61)
In 2008, there was a canola cultivar x plant environment interaction (PO.01) controlling soil microbial biomass (Fig. 5). More specifically, microbial biomass in the CM system was generally higher with 04C204 and Topas than with Polo. Microbial biomass in the TBI system
Soil water content (gnMt gsoif1) 2007
2008
Potential nitrification (ng N03"-N gs„,i"' mo-1) 2007
was generally higher (P<0.01) with 04C204, but the significance of comparisons with the other two cultivars varied according to plant environment.
oo £ o .2 J3 o s _ u
is
• " • Polo I&AAJ Topas 1 = 3 O4C204 2.5 -i 2.0 1.5 1.0 0 . 5 -0.0 TBI a abfe £ l m 4 m a ba 7 m CMDistance from the poplar row
Figure 5. Soil microbial biomass in relation to plant environments and canola cultivars, over the 2008 growing season. Different lower-case letters designate statistically significant (P<0.05) means within each cluster according to Tukey's HSD test. Error bars = 1 S.E.
In both years, potential nitrification decreased with proximity to poplar rows, but a significant effect (P=0.03) was observed only in 2008 between soils samples from the CM system and TBI subplots at 1 m distance from poplar rows (Table 3).
6. Discussion
The fact that the canola cultivars used in 2007 were not the same as those used in 2008 precludes all comparisons of seed oil concentration and yield between years. Our study was not meant, however, to be a rigorous canola cultivar trial, but rather a first estimate of potential seed oil yields on marginal fallow lands in Quebec, using different fertilizer-N application rates and different cropping systems. The decrease in seed oil concentration with increasing fertilizer N application rate is likely the result of protein synthesis being favoured over oil synthesis when N becomes more abundant. This decrease in seed oil concentration was more than compensated by an increase in total seed yield with increasing fertilizer N application rate, at least up to 80 kg N ha"1. Results thus suggest that optimal yields can be
attained on marginal agricultural land in Quebec with 80 kg fertilizer-N ha"1.
In the TBI system, a reduction in seed oil concentration and yield occurs in close proximity to poplar rows. Lower yields at 1 m distance from poplar rows could be due to light interception by the tree canopy. This is corroborated by the higher SLA observed at this distance in 2007, since SLA usually responds positively to reductions in light intensity (Jurik and Van, 2004). We did not observe significantly higher SLA at this distance in 2008, perhaps because of more daylight hours in 2007 (266 mm rainfall; 173 cooling degree days) compared to 2008 (369 mm rainfall; 154 cooling degree days), such that differences in SLA due to shading were more pronounced in the sunnier year. Hybrid poplar is a fast-growing tree crop with a high soil water demand, and this also could contribute to reduced yields at 1 m distance from poplar rows. This is corroborated by differences observed in A40o between years. More specifically,
A40o at 1 m distance was significantly lower when measurements were made on non-excised
leaves experiencing in situ soil water potential (i.e. 2007), but not when leaves were excised and rehydrated prior to measurement (i.e. 2008). Finally, the potential nitrification data provide only weak support that lower yields at 1 m distance from poplar rows were due to
lower soil N supply. Adequately testing for N deficiency would require a measurement of leaf N concentration which we can be combined with A40o values to derive photosynthetic N use
efficiency (PNUE). Notwithstanding the lower yields observed at 1 m distance from poplar rows, our study shows that average yields can be maintained when canola is intercropped with fast-growing hybrid poplar at 8 m intervals, for at least five years following the implementation of this cropping system.
In 2007, we did not expect higher seed oil concentration and yield with Sentry than with Q2, as these two cultivars had been respectively reported as being medium and high in seed oil (Rimmer et al., 1998; Stringam et al., 1999). The climate in Quebec is generally cooler and wetter than in central and western Canada where these cultivars have been tested, and this may have reordered the relative performance of the two cultivars. Results emphasize, therefore, the limit to which the relative performance of canola cultivars can be generalized beyond regional growing conditions. In 2008, it is interesting to note the poor correlation between each cultivar's seed oil concentration, photosynthetic rate or specific leaf area, and its yield.
Contrary to expectation, we did not find a relationship between fertilizer N application rate and soil N20 emissions. It is possible that most of the fertilizer-N had already been
immobilized or lost (volatilized or leached) by the time N20 measurements began, nearly two
months following fertilizer application. On the other hand, we found a substantial three-fold increase of N20 emissions in the CM system, when compared to the TBI system. Thevathasan
et al. (2004) hypothesized that TBI systems could reduce N20 emissions based on better
fertilizer N utilization by both alley crops and trees resulting in lower available N03" for
denitrifiers. In our study, potential nitrification was indeed lower in the TBI than in the CM system. It is also possible that TBI systems reduced N20 emissions by reducing soil moisture.
Given that hybrid poplar is a fast growing species with extensive lateral roots, its high demand for soil water is likely met by foraging the solum well into the alley. This is corroborated by the lower soil moisture contents found at various distances in our TBI plots. Lower N20
emissions provide a further incentive for landowners to adopt TBI systems, based on current and proposed cap-and-trade programs that reward production systems that limit GHG emissions (e.g. European Commission, 2008).
We did not expect to find an effect of cultivars on N20 emissions. Given that nitrification and
soil water content were not higher under cultivar 04C204, we hypothesize that the higher N20
emissions with this cultivar was due to greater rates of rhizodeposition alleviating C limitation among heterotrophic denitrifying bacteria. This is corroborated by a higher microbial biomass under cultivar 04C204. The implication of this cultivar effect is important, given that the cultivar with the best seed oil yield is also the one with the highest rate of N20 emission.
7. Conclusion
In our study, we have shown that seed oil yields of up to 2.8 Mg ha"1 can be obtained in either
TBI or CM systems on marginal farmland in Southern Quebec. According to the 2009 Automotive Consumer Guide (HowStuffWorks Inc., 2009), a 4-cylinder mid-size car's average fuel consumption is 10.6 km l"1, such that it would take approximately 0.67 ha of
marginal land to fuel this mid-size car to run 20,000 km year'1. These yields occur, however,
under optimal fertilizer and cultivar conditions that are not necessarily environmentally sound. There is a need, therefore, to conduct life cycle assessments for analyzing the trade-offs between canola seed oil yields and environmental impacts brought on by the production and application of fertilizer-N, or by the choice of cropping system and canola cultivar that substantially affect N20 emissions. In a first instance, our study allows us to conclude that our
model TBI system did not compromise canola seed oil yields, and substantially reduced soil N20 emissions.
Acknowledgments
The authors are grateful to Mrs. M. Ares for allowing us to perform this study on her farm. We thank the Plant Biotechnology Institute (Saskatoon) for analyzing seed oil concentrations in 2007. Drs. D. Rivest, A. Vanasse and B. Shipley provided useful agronomic and statistical advice. We thank undergraduate students M. Bergeron, J. Bradley, M. Lanoix, X. Francoeur, P. Gregoire, G. Joanisse, H. Marie Johansen, A. Lamarche, J. Quirion, D. Robert, R. Roy and M. Thibeault, who provided technical assistance. The project was supported financially by the Natural Sciences and Engineering Research Council (NSERC) and the Green Crop Network (GCN).
8. References
Allen, S.C., Jose, S., Nair, P.K.R., Brecke, B.J., Nkedi-Kizza, P., Ramsey, C.L., 2004. Safety-net role of tree roots: evidence from a pecan {Carya illinoensis K. Koch) - cotton (Gossypium
hirsutum L.) alley cropping system in the southern United States. Forest Ecol. Manag. 192,
395-407.
Anderson, J.P.E., Domsch, K.H., 1978. A physiological method for the quantitative measurement of microbial biomass in soils. Soil Biol. Biochem. 10, 215-221.
Angadi, S.V., Cutforth, H.W., McConkey, B.G., Gan, Y., 2003. Yield adjustment by canola grown at different plant populations under semiarid conditions. Crop Sci. 43, 1358-1366.
Bradley, R.L., Fyles, J.W., 1995. A kinetic parameter describing soil available carbon and its relationship to rate increase in C mineralization. Soil Biol. Biochem. 27, 167-172.
Bradley, R.L., Olivier, A., Thevathasan, N.V., Whalen, J., 2008. Environmental and economic benefits of tree-based intercropping systems. Policy Options 29, 46-49.
Canola Council of Canada, 2008a. Canola Socio-Economic Value Report. Accessed February
10th 2010.
http://www.canolacouncil.org/uploads/Canola_in_Canada_Socio_Economic_Value_Report_Ja nuary_08.pdf.
Canola Council of Canada, 2008b. Prairie Canola Variety Trials Test Results 2008. Accessed February 10* 2010. http://www.canola-council.org/uploads/pcvt/PCVT_Final_2008_web.pdf.
Conseil des productions vegetales du Quebec inc. - Comite Oleoproteagineux, 1996. Oleoproteagineuses - Canola. Accessed February 10th 2010.
http://www.agrireseau.qc.ca/grandescultures/documents/V9610.pdf.
CRAAQ (Ed.), 2003. Guide de reference en fertilisation, 1st ed. Centre de reference en
agriculture et agroalimentaire du Quebec (CRAAQ), Ste-Foy.
European Commission, 2008. EU Action against climate change - The EU Emissions Trading
Scheme. Accessed February 10th 2010.
http://ec.europa.eu/environment/climat/pdf/brochures/ets_en.pdf.
Forster, P., Ramaswamy, V., Artaxo, P., Berntsen, T., Betts, R., Fahey, D.W., Haywood, J., Lean, J., Lowe, D.C., Myhre, G., Nganga, J., Prinn, R., Raga, G., Schulz, M., Van Dorland, R., 2007. Changes in Atmospheric Constituents and in Radiative Forcing, in: Solomon, S.,
Qin, D., Manning, M , Chen, Z., Marquis, M., Averyt, K.B., Tignor, M., Miller, H.L. (Eds.), Climate Change 2007: The Physical Science Basis. Contribution of Working Group I to the Fourth Assessment Report of the Intergovernmental Panel on Climate Change. Cambridge University Press, New York, pp. 129-234.
Gamier, E., Shipley, B., Roumet, C , Laurent, G., 2001. A standardized protocol for the determination of specific leaf area and leaf dry matter content. Funct. Ecol. 15, 688-695.
Gordon, A.M., 2008. Agroforestry in the World: Lessons for Canada. Policy Options 29, 50-53.
HowStuffWorks Inc., 2009. Consumer Guide® Automotive. Accessed February 10th 2010.
http://consumerguideauto.howstuffworks.com/.
Hutchinson, G.L., Mosier, A.R., 1981. Improved Soil Cover Method for Field Measurement of Nitrous Oxide Fluxes. Soil Sci. Soc. Am. J. 45, 311 -316.
Jurik, T.W., Van, K., 2004. Microenvironment of a corn-soybean-oat strip intercrop system. Field Crop Res. 90, 335-349.
Nordic Genetic Resource Center (NordGen), 2009. Topas, on: Sesto. Accession number:
NGB2695. Accessed February 10th 2010.
http://www.nordgen.org/index.php/skand/content/view/fuIl/344.
Peichl, M., Thevathasan, N., Gordon, A., Huss, J., Abohassan, R., 2006. Carbon Sequestration Potentials in Temperate Tree-Based Intercropping Systems, Southern Ontario, Canada. Agroforest. Syst. 66, 243-257.
R Development Core Team, 2009. R: A language and environment for statistical computing. R Foundation for Statistical Computing, Vienna, http://www.R-project.org.
Rahman, M.H., Joersbo, M., Poulsen, M.H., 2001. Development of yellow-seeded Brassica napus of double low quality. Plant Breed. 120, 473-478.
Rimmer, S.R., Scarth, R., McVetty, P.B.E., 1998. Sentry summer rape. Can. J. Plant Sci. 78, 615-616.
Statistique Canada, 2006. Recencement de l'agriculture. Accessed February 10th 2010.
http://www.statcan.gc.ca/ca-ra2006/index-fra.htm.
Stringam, G.R., Degenhardt, D.F., Thiagarajah, M.R., Bansal, V.K., 1999. Q2 summer rape. Can. J. Plant Sci. 79, 597-598.
Tessier, A., St-Onge, F., Gariepy, S., 2009. Le paysage rural au Quebec : enjeux agricoles et
solutions agroforestieres. Accessed February 10th 2010.
http://www.mapaq.gouv.qc.ca/NR/rdonlyres/BB6D226A-8EAD-40B2-A64B-7628F217D356/0/Documentder%C3%A9flexionsurlepaysagerural_20090605.pdf
Thevathasan, N.V., Gordon, A.M., 2004. Ecology of tree intercropping systems in the North temperate region:- Experiences from southern Ontario, Canada. Agroforest. Syst. 61, 257-268.
United States Department of Agriculture, 2008. World Agricultural Production. Accessed February 10th 2010.
http://www.fas.usda.gov/wap/circular/2008/08-12/productionfulll2-08.pdf.
Wong, S.C., Cowan, I.R., Farquhar, G.D., 1979. Stomatal conductance correlates with photosynthetic capacity. Nature 282, 424-426.
CHAPITRE 2
PERSPECTIVE DES RENDEMENTS ET IMPACTS ENVIRONNEMENTAUX DES CULTURES DE PREMIERE ET DEUXIEME GENERATION DESTINEES A LA
PRODUCTION DE BIOCARBURANTS
1. Avant-propos
Ce chapitre tente de repondre a trois questions qui viennent elargir la portee des conclusions tirees dans le premier chapitre de ce memoire :
• Quelle culture offre un rendement maximal pour la production de biocarburants ?
• Quel est l'impact environnemental associe a la production de biocarburants ?
• Quelle superficie agricole est necessaire pour substituer nos besoins en combustibles fossiles par des biocarburants ?
II continue done sur les memes concepts theoriques que le premier chapitre, mais il tente egalement d'elargir la portee de ces concepts a d'autres grandes cultures destinees a la production de biocarburants au niveau mondial et a les comparer selon les thematiques suggerees par ces trois questions. II tente egalement d'etablir les differences entre les cultures de biocarburants de premiere et deuxieme generation, afin d'illustrer les differences essentielles entre ces types de culture et les benefices apportes par la deuxieme generation en comparaison a la premiere.
Ce chapitre veut egalement informer le lecteur sur les enjeux presents dans la production de biocarburants, comme ceux de la competition de cette production avec les ressources alimentaires ou la superficie et le type de terres que Ton peut affecter a la production de
biocarburants. Bien que plusieurs publications scientifiques aient deja fait des etudes de cycle de vie sur la majorite des cultures en fonction de leur production de biocarburants, il reste tout de meme pertinent de faire une revue de litterature qui permettent de les comparer mutuellement. Malgre tout, ce chapitre ne se definit pas comme une analyse de cycle de vie en soi, mais bien comme une comparaison d'un grand nombre de cultures differentes sur certains points-cles de la production de biocarburants.
Pour ce chapitre, mon superviseur Dr. Robert L. Bradley a eu l'idee originale d'elaborer sur les differences entre biocarburants de premiere et deuxieme generation selon les aspects importants du premier chapitre et a fourni certaines pistes de discussion a partir de publications scientifiques. J'ai redige la totalite du manuscrit en m'inspirant des publications suggeres par mon superviseur et d'autres publications scientifiques trouvees au fil de mes recherches. Ce chapitre ne sera pas soumis pour fin de publication a une revue scientifique.
2. Introduction
L'interet general pour la recherche et Ie developpement des biocarburants decoule essentiellement de deux enjeux socio-economiques majeurs. Tout d'abord, les fluctuations du prix du baril de petrole et les incertitudes lies a son approvisionnement dans les prochaines decennies encouragent les recherches et le developpement de source d'energie renouvelable pouvant eventuellement remplacer, en tout ou en partie, les combustibles fossiles. Aussi, la conscientisation des populations et de leur gouvernement au phenomene du rechauffement climatique planetaire amene les consommateurs de combustibles fossiles a rechercher des energies moins polluantes pour combler leurs besoins energetiques. En date de l'annee 2004, les emissions de dioxyde de carbone (C02) provenant de la combustion des combustibles
fossiles representaient pres de 60 % de toutes les emissions de gaz a effet de serre de nature anthropogenique (IPCC, 2007). Le panneau intergouvernemental sur les changements climatiques estime que ces emissions de gaz a effet de serre ont de fortes probabilites de contribuer directement au rechauffement du climat, ce qui pourrait avoir des consequences catastrophiques sur les populations humaines par le biais d'inondations cotieres, de desertification, d'evenements climatiques extremes plus frequents ainsi que de problemes d'approvisionnement et de qualite de l'eau. Ces consequences auraient aussi de graves repercussions sur les ecosystemes naturels (IPCC, 2007).
L'utilisation des biocarburants est une facon tres prometteuse, a premiere vue, de controler l'augmentation des concentrations de CO2 dans Patmosphere. lis sont des produits chimiquement derives d'elements vegetaux fabriques par le biais de la photosynthese a partir du C02 atmospherique. Ce C02 fixe par la photosynthese est done relache durant la
combustion du biocarburant et peut de nouveau etre fixe par les plantes, et ainsi servir a nouveau de biocarburant. De plus, la croissance intensive de matieres vegetales, qui est
possible actuellement grace a l'agriculture, est un processus renouvelable, pratique depuis des siecles et pour lequel il existe une grande expertise ainsi que de grands moyens techniques.
Par contre, certaines considerations moins evidentes viennent ajouter un bemol a la promotion des biocarburants comme energie verte et renouvelable. L'agriculture moderne fait face a de plus en plus de critiques de la part des environnementalistes. D'une part, ces derniers denoncent l'ajout important de produits chimiques herbicides ou pesticides et d'intrants fertilisants se retrouvant subsequemment sous une forme polluante dans l'environnement. D'autre part, ils denoncent egalement la deforestation de grandes superficies de terres en vue d'utiliser les sols pour ['agriculture, detruisant ainsi les habitats des animaux vivant dans Pecosysteme forestier originel et appauvrissant considerablement les sols par l'erosion de la matiere organique et le lessivage des nutriments. Aussi, les terres agricoles produisent presentement de la nourriture pour nourrir les populations humaines directement ou indirectement, par les animaux d'elevage. L'augmentation des superficies agricoles produisant des biocarburants pourraient done resoudre en partie la crise energetique que Ton vit presentement aux depends d'une crise alimentaire mondiale eventuelle.
De nouvelles avenues dans le developpement des biocarburants pourraient peut-etre pallier aux differentes problematiques rencontrees presentement. En effet, les biocarburants peuvent se classer en deux categories: les biocarburants de premiere et deuxieme generation. Les biocarburants de premiere generation sont derives a partir des recoltes de culture alimentaire, soit le bioethanol par la fermentation des sucres contenus dans les grains recoltes, ou encore le biodiesel par la transesterification des acides gras contenus dans ces memes grains. Les biocarburants de deuxieme generation sont quant a eux derives a partir des composantes structurelles (parois cellulosiques et lignine, majoritairement) de la biomasse residuelle des cultures n'ayant pas ete recolte, des cultures, comme celle du panic erige, ne servant pas a l'industrie alimentaire, ou encore des residus industriels tels que les copeaux de bois et les ecorces, par exemple. La production de biomasse est possible a grande echelle, sans faire
competition avec les ressources alimentaires, mais il est pertinent de se pencher sur les consequences environnementales de la culture de ces biocarburants de deuxieme generation, en vue de les comparer a ceux de la premiere generation et de savoir ainsi si cette alternative est vraiment prometteuse.
Dans ce chapitre, il sera done question de mettre en perspective les avantages et les inconvenients des biocarburants de premiere et de deuxieme generation selon trois aspects importants ressortis dans la publication constituant le premier chapitre de ce memoire : les intrants fertilisants apportes aux cultures agricoles, les emissions de gaz a effet de serre par les terres agricoles ainsi que les superficies, agricoles neeessaires pour la production de biocarburants. Bien qu'il soit egalement possible de bruler la biomasse vegetale pour produire de l'energie, cet aspect ne sera pas developpe dans le present chapitre pour mieux cerner les enjeux exclusifs des biocarburants.
3. Developpement
3.1. Intrants fertilisants
L'ajout d'intrants fertilisants permet d'augmenter considerablement les recoltes des cultures agronomiques, si bien qu'ils font maintenant partie integrante de la gestion des terres agricoles. L'aspect des intrants fertilisants est important lorsqu'il s'agit de comparer les biocarburants de premiere et de deuxieme generation car ils represented un enjeu economique important pour le producteur, ainsi qu'un enjeu environnemental vital du point de vue de la sante des plans d'eau et des emissions de gaz a effet de serre par les terres agricoles.
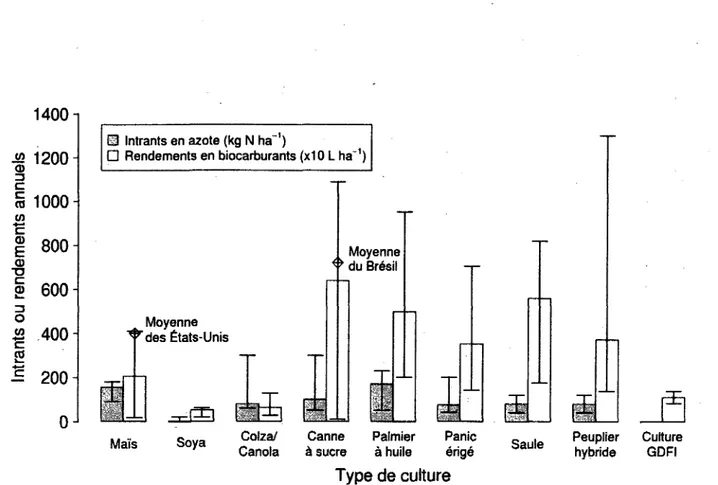
La figure 6 presente un portrait general des intrants en fertilisants azotes et des rendements moyens de biocarburants (ethanol ou biodiesel) de cinq cultures de premiere generation (le mai's, le soya, le colza/canola, la canne a Sucre ainsi que le palmier a huile) et quatre cultures de deuxieme generation (le panic erige, le saule, le peuplier hybride et les cultures de grande diversite a faible intrants). Les estimations sur les intrants en fertilisants azotes necessaires pour les cultures, les rendements de ces dernieres ainsi que les facteurs de conversion des produits de recolte en ethanol ou en biodiesel proviennent des sources suivantes : le « world fertilizer use manual» (manuel mondial de l'utilisation des fertilisants) (1992), Vogel et al. (2002), Parrish et Fike (2005), Adegbidi et al. (2001), Tilman et al. (2006), les statistiques de la FAO (2010), Laureysens et al. (2004), Riemenschneid et al. (2001), Scarascia-Mugnozza et al. (1997), Adler et al. (2007) et Goldemberg (2008). Dans tous les cas, un facteur de 0.90, utilise dans l'article d'Adler et al. (2007), fut appliquee aux valeurs potentielles pour tenir en compte des pertes liees a la conversion des grains ou de la biomasse en biocarburant.
JQ 0> C c CO W + - • c <D E d) T3 C 2 ZJ o w CO 1400 1200H 1000 800 600 400 200 ^ 0 @ Intrants en azote (kg N ha ')
D Rendements en biocarburants (x10 L ha"1)
Moyenne <>duBresil
Moyenne "^"des £tats-Unis
: [ J |
Mais Soya Colza/ Canola
Canne Palmier Panic a sucre a huile erige
Type de culture
Saule Peuplier hybride
Culture GDFI
Figure 6. Intrants de fertilisants azotes et rendements en biocarburants de cinq cultures de premiere generation et quatre cultures de deuxieme generation. Les barres d'erreur montrent l'etendue des intrants ou rendements de la litterature citee dans le texte. L'acronyme GDFI signifie « grande diversite a faible intrants », traduit de l'anglais LIHD (low-input high-diversity), introduit par Tilman et al. (2006).
Tout d'abord, les conclusions a tirer de la figure 6 doivent demeurer prudentes, puisqu'elle ne presente pas l'ensemble des cultures de premiere et deuxieme generation pouvant servir a la production de biocarburants et que l'etendue des estimations pour certaines cultures peuvent etre incompletes. Neanmoins, il est possible de voir que les intrants varient beaucoup au sein de chaque culture en fonction des regions ou celle-ci est etablie. Par exemple, le colza europeen est une variete hivernale et demandent facilement plus de 200 kg N ha"1, alors que
son homologue nord-americain, le canola, est une variete printaniere ne demandant guere plus de 80 kg N ha"1. La canne a sucre peut demander plus de 200 kg N ha"1 dans les regions d'Asie