INFLUENCE DE LA MYTILICULTURE ET DE L'ASCIDIE ENVAHISSANTE STYELA CLAVA SUR LES COMMUNAUTÉS DE MACROINVERTÉBRÉS
BENTHIQUES À L'ÎLE-DU-PRINCE-ÉDOUARD
MÉMOIRE PRÉSENTÉ À
L'UNIVERSITÉ DU QUÉBEC À RIMOUSKI
comme exigence partielle du programme de maîtrise en
Océanographie
PAR
LISA MARY ROBICHAUD
Avertissement
La diffusion de ce mémoire ou de cette thèse se fait dans le respect des droits de son auteur, qui a signé le formulaire « Autorisation de reproduire et de diffuser un rapport, un mémoire ou une thèse ». En signant ce formulaire, l’auteur concède à l’Université du Québec à Rimouski une licence non exclusive d’utilisation et de publication de la totalité ou d’une partie importante de son travail de recherche pour des fins pédagogiques et non commerciales. Plus précisément, l’auteur autorise l’Université du Québec à Rimouski à reproduire, diffuser, prêter, distribuer ou vendre des copies de son travail de recherche à des fins non commerciales sur quelque support que ce soit, y compris l’Internet. Cette licence et cette autorisation n’entraînent pas une renonciation de la part de l’auteur à ses droits moraux ni à ses droits de propriété intellectuelle. Sauf entente contraire, l’auteur conserve la liberté de diffuser et de commercialiser ou non ce travail dont il possède un exemplaire.
RÉSUMÉ
L'influence de la conchyliculture en suspension sur les macro invertébrés benthiques dans le sédiment est bien connue en ce qui concerne certains paramètres classiques décrivant la structure de ces communautés (ex. abondance, diversité), mais l'influence de cette activité sur la productivité secondaire des macro invertébrés benthiques reste méconnue. Pourtant, ce paramètre s'avère très utile pour la compréhension des flux d'énergie dans les écosystèmes et pour la gestion des ressources halieutiques. De plus, les organismes qui vivent en association avec les bivalves en culture, et les ascidies envahissantes qui y sont souvent associés, ont généralement été exclus en ce qui a trait aux effets environnementaux de la culture de bivalves. L'objectifde cette étude était donc de déterminer l'influence de la
mytiliculture et de l'ascidie envahissante Styela clava sur l'ensemble des macro invertébrés « benthiques» dans les sites mytilicoles. À cette fin, les
macro invertébrés associés au sédiment ainsi que ceux associés aux moules cultivées en suspension ont été échantillonnés à l'intérieur et à l'extérieur de sites mytilicoles dans 8 baies à l'Île-du-Prince-Édouard : 3 envahies par S. clava et 5 où S. clava était absent.
L'abondance, la biomasse, la productivité secondaire ainsi que la diversité et structure des assemblages de macro invertébrés benthiques ont été comparées à
l'intérieur et à l'extérieur des sites mytilicoles. Les communautés associées au sédiment étaient significativement moins abondantes dans les sites mytilicoles, et une diminution non-significative de leur biomasse et de leur productivité a aussi été observée. En utilisant ces mêmes paramètres, les communautés de macroinvertébrés sur les boudins de moules de sites envahies par S. clava ont été comparées à celles des sites où S. clava était absent. L'abondance des communautés de macroinvertébrés associés aux boudins de moules étaient plus élevés dans les baies envahies par S. clava et ces communautés étaient caractérisées par une structure différente. En combinant l'abondance, la biomasse et la productivité des communautés de macroinvertébrés dans le sédiment et sur les boudins de moules, un patron inverse à celui décrit pour les macro invertébrés dans le sédiment a été observée: l'abondance, la biomasse et la productivité secondaire des macroinvertébrés étaient plus élevées à l'intérieur des sites mytilicoles.
Contrairement aux résultats prédits, la présence de S. clava n'a pas augmenté l'effet de la mytiliculture sur la productivité secondaire totale (fond et boudins combinés). Ces résultats indiquent que les macro invertébrés associées aux moules en suspension ont compensé les effets négatifs observés sur le fond et démontrent donc qu'il serait utile de considérer ces organismes dans l'étude et la gestion des effets environnementaux des activités conchylicoles.
REMERCIEMENTS
Je tiens à remercier mon directeur de recherche le Dr Chris McKindsey qui m'a d'abord invité à entreprendre ce projet et qui m'a ensuite guidé tout au long de sa réalisation. C'est avec l'encouragement de Chris que j'ai réalisé non seulement ce projet mais aussi un stage à l'étranger et que j'ai participé à de nombreuses conférences, et je lui en suis très reconnaissante.
Je voudrais aussi remercier le Dr Philippe Archambault pour sa contribution à mon projet ainsi que pour son enthousiasme et ses mots d'encouragement.
Je remercie mon co-directeur feu Dr Gaston Desrosiers pour son aide et sa gentillesse pendant mon passage à l'ISMER.
L'échantillonnage en plongée sous-marine des macro invertébrés « dans 8 baies à Île-du-Prince-Édouard » a été possible grâce à une équipe efficace mais comique: mon collègue Olivier D'Amours, Catherine Godbout, Chantale Langevin, Frédéric Hartog, Paul Robichaud ainsi que Chris McKindsey et Philippe Archambault.
De plus, je suis très reconnaissante envers les mytiliculteurs de l'Île-du-Prince-Édouard de nous avoir accordé la permission d'échantillonner dans leurs sites et de nous avoir guidés pendant l'échantillonnage.
Au laboratoire Chantale Langevin, Julien Chopelet, et Matthieu Huot ont travaillé fort pour m'aider à trier et à identifier les échantillons. Cindy Grant et Laure de Montety nous ont beaucoup aidés en partageant leur expertise en identification.
Merci à Andréa Weise pour m'avoir aidé à naviguer dans le monde de l'IML et à réaliser à peu près toutes les étapes de ce projet. Je veux aussi dire un très grand merci à mes consoeurs du labo à l'IML : Myriam Callier, Magalie Hardy, Dr Brianna Clynick et Annick Drouin. Elles m'ont aidé tout au long de ce travail et m'ont beaucoup aidé à mener les analyses statistiques. Un gros merci aussi au Dr Mathieu Cusson pour ses conseils sur les calculs de productivité secondaire et au Dr Marti Anderson pour ses conseils précieux sur les analyses multivariées.
Ce projet fait partie d'une étude plus large sur les changements de productivité secondaire associés aux sites mytilicoles financé par AquaNet. Il est réalisé en collaboration avec l'Institut Maurice-Lamontagne (IML) du ministère des Pêches et Océans Canada. Le personnel du Centre des pêches du Golfe à Moncton (Thomas Landry, Angéline LeBlanc, Luc Comeau), du Département de l'Agriculture, Pêches et Aquaculture de l'Île-du-Prince-Édouard (Neil MacNair), et du PEI Aquaculture Alliance (Greg MacCallum) nous ont assistés pendant la planification de l'échantillonnage à l'Île-du-Prince-Édouard.
Merci aux organismes qui m'ont accordé des bourses d'étude pendant la réalisation de ce projet: l'Institut des sciences de la mer de Rimouski (ISMER), le Réseau Aquaculture Québec (RAQ), et l'Association Aquacole du Canada (AAC).
TABLE DES MATIÈRES
RÉSUMÉ ... .ii
REMERCiEMENTS ... iii
LISTE DES TABLEAUX ... vii
LISTE DES FIGURES ... viii
LISTE DES ANNEXES ... ix
INTRODUCTION GÉNÉRALE ... 1
CHAPITRE 1 : INFLUENCE OF SUSPENDED MUS SEL AQUACULTURE AND AN ASSOCIATED INVASIVE ASCIDIAN ON MACROINVERTEBRATE COMMUNITIES ... Il 1.2 Introduction ... 14
1.3 Materials and methods ... 19
1.3.1 Studysite ... 19
1.3.2 Field sampling methods ... 23
1.3.3 Laboratory methods ... 26
1.3.4 Statistical methods ... 28
1.4 Results ... 31
1.4.1 Sediment macroinvertebrates ... 31
1.4.2 Mussel sock macroinvertebrates ... 40
1.4.3 Sediment and mussel sock macroinvertebrates ... .43
1.5 Discussion ... 45
1. 5.1 Effect of mussel aquaculture on sediment macroinvertebrates ... 45
1.5.2 Effect of mussel aquaculture on sediment and mussel sock macroinvertebrates ... 47
1.5.3 Effect of Styela clava on sediment and mussel sock macroinvertebrates ... 50
1.6 Conclusion ... 51
1.7 Acknowledgements ... 53
CONCLUSION GÉNÉRALE ... 55
BIBLIOGRAPHIE ... 61
ANNEXE 1 : LISTE DE TAXONS IDENTIFIÉS DANS CHAQUE BAIE ET LEURS ABONDANCES ... 74
LISTE DES TABLEAUX
Table 1. Estimated total bay area, area leased for mus sel grow-out in 2005 and % ofbay leased for mussel grow-out, for each bay sampled (data from Fisheries and Oceans Canada, Charlottetown, 2007). (S) indicates bays with Styela clava ....... 20 Table 2. Total number and biomass of Styela clava per 50 cm mussel sock sample
(totals calculated from subsamples of juveniles and full samples of adults).
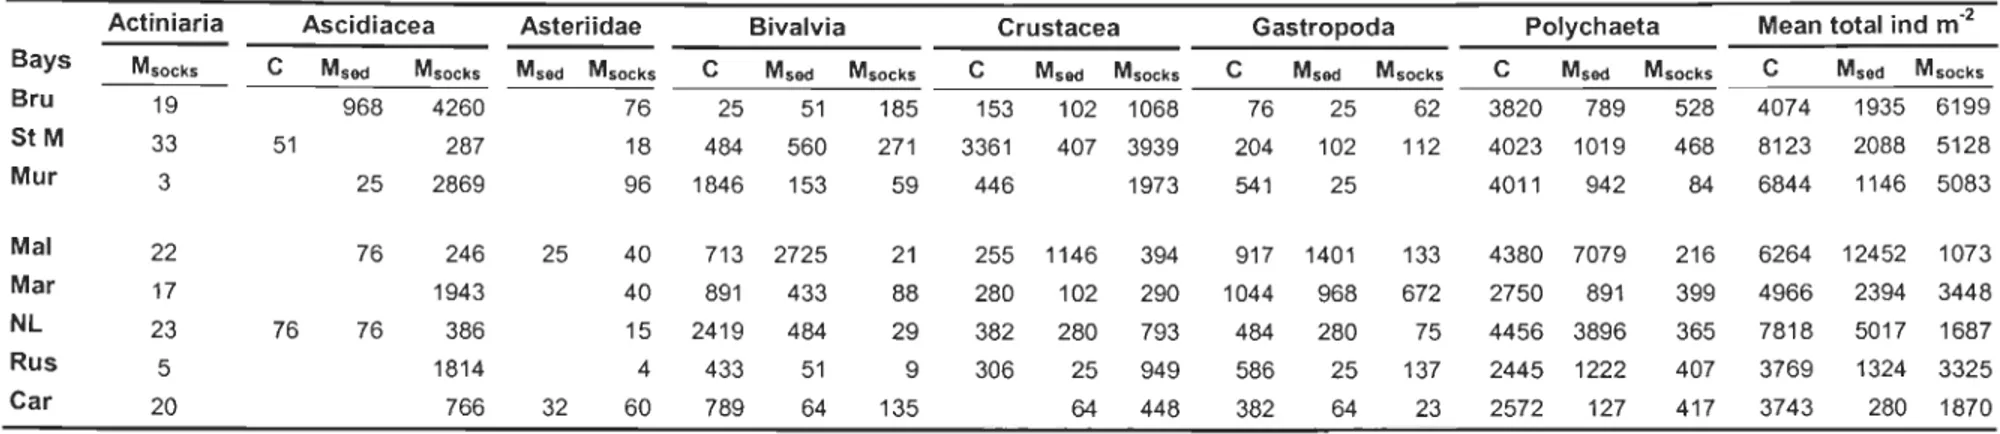
Averages (±SE) are indicated in bold ... 25 Table 3. Mean a) abundance, b) biomass and c) productivity ofmacroinvertebrates in 7
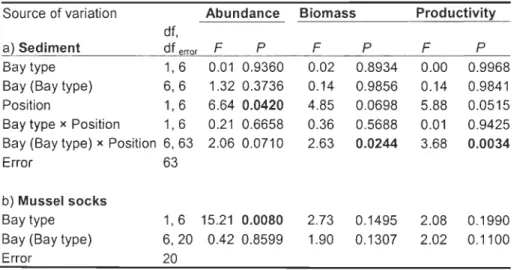
taxa, and me ans oftotals from sediment samples outside musselleases (C), sediment samples under musselleases (Msed), and mussel socks (Msocks). Bay abbreviations are as in Figure 1. Actinaria were absent from sediment samples (C and Msocks), Asteriidae were absent from sediment samples outside leases ... 33 Table 4. Results of ANOVAs to test fixed effects a) Bay type (with vs without Styela
clava) and Position (inside vs outside musselleases) on log (x+l) transformed sediment macroinvertebrate abundance, biomass and productivity, and b) Bay type on log-transformed mussel sock macroinvertebrate abundance, biomass and productivity. Random effects Bay (Bay type) and Bay (Bay type) x Position are also shown ... 36 Table 5. Results of ANOVA to test fixed effects Bay type (with vs without Styela clava)
and position (inside vs outside musselleases), on a) log-(x+ 1) transformed taxonomic richness of sediment macroinvertebrates and b) taxonomic richness of mussel sock macroinvertebrates. Random effects Bay (Bay type) and
Bay (Bay type) x Position are also shown ... 37
Table 6. DISTLM (Distance-based multivariate analysis) results testing fixed effects Bay type and Position on sediment macrobenthic assemblages using parameters a) abundance, b) biomass and c) productivity. Data for aIl 3 parameters were -V -transformed prior to analysis. Random effects Bay (Bay type) and
Bay (Bay type) x Position are also shown ... 38
Table 7. Results of SIMPER analysis of -V-transformed mussel sock macroinvertebrate abundance, indicating taxa contributing most to total dissimilarity between
assemblages in bays with and without Styela clava ...... .43 Table 8. Results of ANOV As with contrasts to test fixed effects Bay type (with vs
without Styela clava) and position (inside vs outside musselleases) on abundance, biomass and productivity of aIl macroinvertebrates sampled: sediment
+
mussel sock macroinvertebrates in musselleases, and sediment macroinvertebrates outside leases. Random effects Bay (Bay type) and Bay (Bay type) x Position are alsoshown. AlI data were log (x+ 1) transformed ... .44 Table 9. Number of taxa observed per 0.039 m2 ofbottom area inside and outside
LISTE DES FIGURES
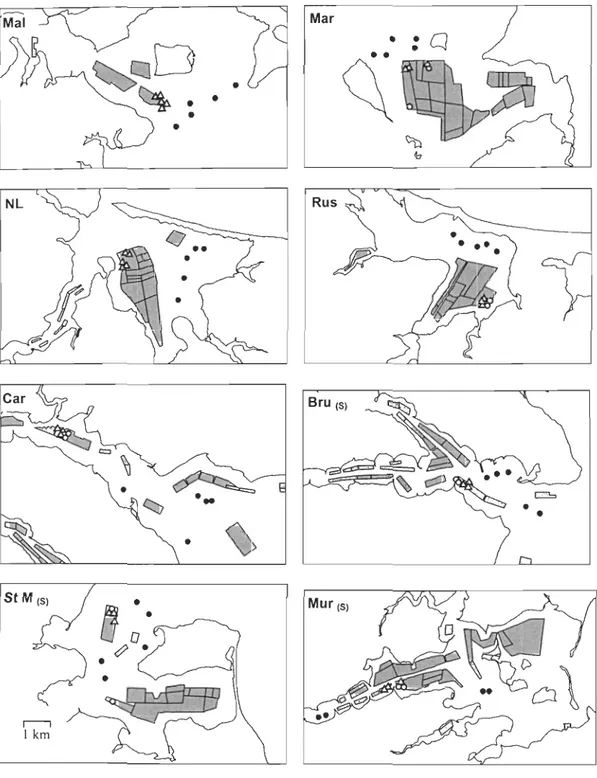
Figure 1 The Maritime Provinces of Canada, with insert of Prince Edward Island showing bays sampled. (S) indicates bays with Styela clava ........................ 21 Figure 2. Sampling locations in bays shown in Fig. 1. Shaded areas are musselleases.
e: control samples (sediment) 0: sediment sampI es inside leases.6.: sediment and mussel sock samples inside leases (separated by approximately 30 m). (S) indicates bays with Styela clava. Note that the sc ale is consistent throughout. ... 22 Figure 3. Mean (±SE) total abundance, biomass and productivity of sediment and
mussel sock macroinvertebrates in control sites (C) and musselleases (M) in 3 bays with Styela clava and 5 bays without S. clava (see Fig. 1 for bay
abbreviations). n=5 for sediment samples except Mur where n=4; n=3 for mussel sock samples except NL and Mal where n=5 ... 35 Figure 4. Taxonomie richness (±SE) of sediment macroinvertebrates sam pIed inside and outside musselleases in bays with and without Styela clava .... 37 Figure 5. nMDS plot of abundance of sediment macroinvertebrate assemblages in 8
bays on PEI. A zero-adjusted Bray-Curtis dissimilarity coefficient was used to ca1culate dissimilarity among samples. Data were -Y-transformed prior to analysis. Filled symbols indicate samples from bays infested by Styela clava, open symbols indicate samples from bays without S. clava. ® Indicates samples from inside musselleases. Multivariate patterns were similar for biomass and productivity of sediment macroinvertebrates and thus, for brevity, are not shown ... 39 Figure 6. Taxonomie richness (±SE) ofmussel sock macroinvertebrate samples from
musselleases in bays with and without Styela clava . ....... .41 Figure 7. nMDS plots ofabundance, biomass and productivity ofmussel sock
macroinvertebrate assemblages in 8 bays on PEI. All data were -Y-transformed prior to analysis. Filled symbols indicate bays infested by Styela clava, open symbols indicate bays without S. clava . ...... 42
LISTE DES ANNEXES
Annexe 1. Liste des taxons identifiés et leurs abondances par m2 dans les 3 positions échantillonnées dans 8 baies à l'Île-du-Prince-Édouard : Échantillons de sédiment à l'intérieur de sites mytilicoles (=sediment inside musselleases) et à l'extérieur de sites mytilicoles (=sediment outside musselleases) et échantillons prélevés des boudins de moules (=mussel socks) ... 75
contributions de cette industrie à la sécurité alimentaire et aux économies locales et rurales peuvent être importantes (Naylor et al. 2000, Shumway et al. 2003, Alain 2005). Généralement, les effets écologiques de la conchyliculture sont considérés moins importants que ceux de la pisciculture, notamment, car aucune nourriture additionnelle n'est ajoutée dans l'environnement pour nourrir les bivalves (Shumway et al. 2003). Néanmoins, la culture de bivalves est souvent extensive et peut exercer une grande influence sur les organismes pélagiques et benthiques ainsi que sur le fonctionnement
des écosystèmes (Cranford et al. 2003). La conchyliculture, comme les autres activités
aquacoles, représente donc une préoccupation environnementale, d'autant plus que les habitats côtiers où se déroule cette activité sont déjà modifiés par les activités humaines
de plusieurs façons (Simenstad et al. 2000). Afin de répondre à ces préoccupations, une
meilleure compréhension des effets de la culture de bivalves est nécessaire (Department ofFisheries and Oceans Canada 2006). Un aspect particulièrement méconnu est le rôle
des bivalves comme substrats et vecteurs pour les espèces envahissantes, ainsi que leurs
influences sur la structure des communautés benthiques (McKindsey et al. 2007). La
présente étude traite de l'influence de la mytiliculture et de l'ascidie envahissante Styela
clava sur les macroinvertébrés dites « benthiques» à l'Île-du-Prince-Édouard (ÎPÉ).
L'industrie mytilicole est en croissance à l'ÎPÉ depuis les années 1980 (Smith
2006) et en 2004 le total des débarquements à l'ÎPÉ était de 15,6 millions de kg (communication personnelle, Division des statistiques, Pêches et Océans Canada,
Région du Golfe). La culture de moules est l'industrie aquicole la plus développée à l'ÎPÉ et elle contribue de façon importante à la production totale de bivalves au Canada. À l'échelle nationale, les industries mytilicoles et conchylicoles dans les autres
provinces de l'Atlantique (Terre-Neuve-et Labrador, Nouvelle-Écosse, Nouveau-Brunswick), au Québec et en Colombie-Britannique continuent aussi à se développer (Department of Fisheries and Oceans Canada 2007).
Structure du mémoire
Ce mémoire est composé de 3 sections. La première section commence par une brève introduction suivie d'une revue de nos connaissances actuelles de l'influence de 1) la mytiliculture et 2) les ascidies sur les communautés de macroinvertébrés benthiques, et, étant donné l'importance des notions de la productivité secondaire pour ce travail, 3) une présentation de cette mesure et de son estimation. Cette revue est suivie d'une discussion des facteurs qui influencent la structure des communautés de moules. Dans la section suivante, je présente une expérience visant à évaluer les objectifs du mémoire et une interprétation des résultats obtenus. Dans la dernière section je présente une conclusion générale des travaux réalisés et une discussion de leur importance en lien avec l'état des connaissances actuel de l'influence de la conchyliculture sur
L'effet de la mytiliculture sur les macroinvertébrés
Au Canada, la plupart des moules (ainsi que les huîtres et les pétoncles dans
certains endroits) sont cultivées en suspension dans la colonne d'eau où ils se
nourrissent de phytoplancton, zooplancton, et de détritus. Les moules en culture représentent un lien entre les réseaux trophiques pélagiques et benthiques. Ils excrètent
une portion des particules qu'ils filtrent dans la colonne d'eau sous forme de fécès et pseudofécès, riches en matière organique, qui sédimentent rapidement au fond (Callier et al. 2006). En conséquence, des taux de sédimentation significativement plus élevés ont été observés sous les structures mytilicoles par rapport aux sites témoins (Dahlback & Gunnarsson 1981, Callier et al. 2006). La décomposition des biodépôts sur le sédiment dans les sites mytilicoles peut entraîner des changements géochimiques tels que l'ammonification et la réduction des sulfates (Dahlback & Gunnarsson 1981, Richard et al. 2007). Plusieurs auteurs ont étudié l'effet de la biodéposition sur les
communautés macrobenthiques en décrivant l'abondance, la biomasse, la diversité et la
structure des communautés benthiques dans les sites mytilicoles, par rapport à des sites témoins (voir revue dans Cranford et al. 2003). Parmi ces études, certaines ont
démontré des diminutions de l'abondance (Mattsson & Lindén 1983, da Costa & Na1esso 2006), de la biomasse (Stenton-Dozey et al. 1999), et de la diversité des communautés macrobenthiques (Mattsson & Lindén 1983) ainsi que des augmentations
d'espèces opportunistes (Mattsson & Lindén 1983, Callier et al. 2007) sous les moules en culture. Cependant, la mytiliculture semble avoir peu d'effet à certains sites
paramètres étudiés (Grant et al. 1995, Callier et al. 2007, Richard et al. 2007). Par
exemple, Grant et al. (1995) ont observé une augmentation de la biomasse des
macroinvertébrés benthiques dans un site mytilicole, qu'ils ont expliqué par l'apport de nourriture provenant de la chute de moules et de la matière organique des boudins de moules.
En plus des effets susmentionnés sur l'environnement benthique, l'effet des bivalves en culture est aussi lié à la structure biogénique qu'ils créent en tant qu'espèces « ingénieurs », qui modifient, maintiennent ou créent des habitats (Jones et al. 1994). Plus particulièrement, les coquilles de bivalves peuvent fournir une structure biogénique
complexe sur laquelle les macro invertébrés peuvent se fixer, et qui offre une protection
contre la prédation et les conditions environnementales défavorables (Gutiérrez et al.
2003). De plus, ces macroinvertébrés (comme ceux vivant sous les moules en culture)
peuvent consommer les moules ou les biodépôts qu'ils produisent (Tenore & Dunstan 1973, Tenore & Gonzalez 1975). Les bancs de moules naturels peuvent supporter une
communauté macrobenthique productive de forte biomasse et diversité (Nixon 1971, Tsuchiya & Nishihira 1985) et les moules envahissantes en eau douce semblent
également créer un habitat pour les macroinvertébrés. À la suite d'invasions de
bivalves dreissénidés en eau douce, on a observé une augmentation de la densité et de la diversité de macro invertébrés (Strayer et al. 1999, Ward & Ricciardi 2007). Par contre, Johannsson et al. (2000) ont observé que l'invasion de Dreissena spp. dans le lac Erie
De façon semblable, les bivalves en culture peuvent aussi offrir un bon habitat pour les macroinvertébrés (Shumway et al. 2003). Il a été suggéré que les structures utilisées pour la culture de bivalves peuvent agir comme des récifs artificiels et favoriser le développement de communautés de macro invertébrés (Tenore & Gonzalez 1975, Shumway et al. 2003) et de poissons et grands macro invertébrés, tel que le crabe et le homard (McKindsey et al. 2006, D'Amours et al. en révision). En effet, de nombreux macroinvertébrés vivent directement sur les bivalves suspendus en culture (Arakawa 1990, Khalaman 2001, LeBlanc et al. 2003a, O'Beim et al. 2004, Murray et al. 2007). Aussi, des études ont démontré que les structures employées pour la culture d'huîtres et de myes sur le fond offrent un meilleur habitat pour les macro invertébrés et les poissons que les fonds sablonneux (Dealteris et al. 2004, Ferraro & Cole 2007, Powers et al. 2007). Ces habitats pourraient même être utilisés de façon équivalente aux herbiers de zostère (Dealteris et al. 2004, Ferraro & Cole 2007).
Contrairement aux effets souvent perçus de façon négative qui sont associés aux communautés macrobenthiques sous les moules en culture, ces études démontrent un effet positif de la conchyliculture sur les macroinvertébrés qui vivent en association avec les bivalves. Ces macroinvertébrés occupent la même fonction que les
macroinvertébrés benthiques dans le sédiment et il est donc logique de les considérer avec les macro invertébrés benthiques dans le sédiment pour dresser un portrait réaliste quant à l'effet de la conchyliculture. Ainsi, pour la présente étude, une influence globale neutre ou positive de l'influence de la mytiliculture est prédite lorsque l'ensemble des macro invertébrés dans les sites mytilicoles est considéré: ceux qui
vivent sur les moules ainsi que ceux qui vivent dans le sédiment sous les structures myti1ico1es.
L'effet des ascidies sur les macroinvertébrés
Des espèces exotiques envahissantes, notamment les ascidies, font souvent partie des communautés de macro invertébrés qui vivent en association avec les bivalves en culture (Getchis 2005). Elles peuvent être introduites dans les sites conchylicoles de façon directe avec le transfert des stocks de bivalves, ou bien par d'autres vecteurs comme le transport maritime (Lambert 2007). Il est probable que la culture de bivalves facilite l'établissement des ascidies envahissantes (Locke et al. 2007, McKindsey et al. 2007) et celles-ci sont particulièrement nombreuses dans les sites mytilicoles à l'ÎPÉ, où au moins quatre espèces ont été introduites depuis 1998. Styela clava a été observé pour la première fois en 1998 et son arrivée a été suivi de Botryllus schlosseri en 2001, Botrylloides violaceus en 2002, et Ciona intestinalis en 2004 (Prince Edward Island Department of Fisheries and Aquaculture 2008).
Entre autres, l'ascidie plissée S. clava entraîne des conséquences économiques importantes, car la culture ainsi que la transformation des moules demande plus d'effort en sa présence (Department of Fisheries and Oceans Canada 2008). Cependant, la croissance et le rendement en chair des moules ne semblent pas être affectés par la présence de S. clava (Thompson & MacNair 2004). Colautti et al. (2006) ont estimé, à l'aide d'un modèle empirique, que les coûts associées à S. clava pourraient s'élever à plus de 88 000 000$ pour l'industrie conchylicole au Canada.
Les ascidies peuvent également créer des habitats pour les macro invertébrés. Paine et Suchanek (1983) ont souligné plusieurs similarités écologiques de l'ascidie
Pyura praeputialis et la moule Mytilus californianus dans les milieux intertidaux (e.g. taille, refuge de la prédation par la taille, formation de matrices complexes,
compétitivité supérieure) et ils ont aussi noté que ces deux espèces vivent en association avec des communautés macrobenthiques complexes. Plus récemment, certaines espèces envahissantes tels que les ascidies solitaires ont aussi été décrites comme des espèces « ingénieurs », qui peuvent augmenter l'abondance et la diversité des organismes indigènes, possiblement en augmentant la complexité ou l'hétérogénéité de l'habitat (Crooks 2002, Rodriguez 2006). En Afrique du Sud, Fielding et al. (1994) ont observé
une grande densité, biomasse et richesse d'espèces macrobenthiques dans des bancs intertidaux et subtidaux de l'ascidie Pyura stolonifera. Les auteurs ont suggéré que la récolte de ces ascidies peut entraîner une perte de la productivité secondaire de la communauté macrobenthique, car la période de rétablissement de P. stolonifera est longue. De plus, Monteiro et al. (2002) ont démontré que la structure des communautés macrobenthiques varie selon la configuration de l'habitat créé par P. stolonifera en Australie. Castilla et al. (2004) ont observé une augmentation de la diversité de macro invertébrés associée aux bancs de Pyura praeputialis au Chili.
En comparaison à ces ascidies, l'effet de S. clava sur les macroinvertébrés est
moins bien connu. À l'ÎPÉ, l'ascidie envahissante S. clava peut atteindre une taille de
14 cm et peut se fixer sur des boudins de moules et sur d'autres substrats en très hautes densités (Thompson & MacNair 2004). L'ascidie S. clava peut donc créer une structure
complexe et peut servir de substrat pour la fixation de certaines espèces
macrobenthiques (Whitlatch et al. 1995, Dijkstra et al. 2007, Locke et al. 2007). Il est possible que la structure produite par la présence de cette espèce sur les moules en culture puisse faciliter l'établissement et le maintien des populations de
macroinvertébrés benthiques. Il est donc prévu que l'influence de la mytiliculture sur les macroinvertébrés sera augmentée par la présence de S. clava sur les boudins.
Estimation de la productivité secondaire
L'influence de la conchyliculture sur la productivité des communautés benthiques est moins bien connue que l'influence de cette activité sur d'autres
paramètres tels que la diversité et l'abondance des organismes benthiques. Cependant, la productivité des communautés benthiques est d'une grande importance pour la compréhension des effets environnementaux et la gestion de cette industrie. La production secondaire est mesure de l'incorporation de la matière organique par les organismes hétérotrophiques par unité de surface et de temps (Cusson & Bourget 2005) et ce paramètre est souvent exprimé par un flux d'énergie, par exemple KJ m-2 année-I (Benke 1993). La production secondaire intègre plusieurs caractéristiques biologiques qui décrivent le succès d'une population: la densité, la biomasse, le taux de croissance, la reproduction, la survie et la période de développement (Benke 1993). Elle indique donc l'importance fonctionnelle d'une population au sein d'une communauté ou d'un écosystème (Odum 1968, Benke 1993). De plus, des modifications des flux d'énergie des populations ou des communautés peuvent affecter le fonctionnement de
Politique de gestion de l 'habitat du poisson vise à protéger la capacité de production de
l'habitat du poisson (Department ofFisheries and Oceans Canada 1986).
Les méthodes classiques employées pour estimer la production secondaire demandent un effort considérable (Crisp 1984) et il est particulièrement difficile de
mesurer la production totale d'une communauté à l'aide de ces méthodes. Plusieurs
auteurs ont donc élaboré des modèles empiriques pour faciliter l'estimation de la
productivité secondaire des macroinvertébrés (Edgar 1990, Tumbiolo & Downing 1994,
Brey 2001, Cusson & Bourget 2005). Les modèles sont basés sur la relation entre la
productivité et la biomasse ainsi que d'autres caractéristiques des populations (ex.
taxon, habitat) et des paramètres environnementaux. L'erreur associée aux estimations
de productivité réalisées à l'aide de modèles empiriques peut être considérable pour une
seule population (Benke 1993, Brey 2001). Cependant, cette erreur diminue beaucoup
lorsque la productivité d'une communauté entière est estimée (Brey 2001), car l'erreur
est distribuée de façon aléatoire. Ces modèles sont donc très utiles pour faire des
comparaisons de la productivité macrobenthique totale au sein de différents habitats et écosystèmes (ex. Taylor 1998, Bologna & Heck Jr 2002, Nilsen et al. 2006). Les
termes productivité secondaire et production secondaire sont souvent employés comme
synonymes. Cependant, le terme productivité secondaire est utilisé ici puisqu'il décrit des estimations de production potentielle pour des conditions spécifiées (Davis 1963 cité par, Crisp 1984).
Objectifs du mémoire
L'objectif de ce projet de maîtrise était de déterminer l'influence de la
mytiliculture et de l'espèce envahissante S. clava sur les communautés macrobenthiques qui vivent en association avec les moules cultivées en suspension, ainsi que celles associées au sédiment sous-jacent. Plus spécifiquement, pour tester l 'hypothèse que la culture de moules en suspension influence les communautés macrobenthiques qui vivent dans le sédiment, l'abondance, la biomasse, la productivité secondaire ainsi que la diversité et la structure des assemblages macrobenthiques ont été comparées à l'intérieur et à l'extérieur des sites mytilicoles. De plus, l'hypothèse suivante a été testée : une influence globale neutre ou positive sur l'ensemble des macroinvertébrés sera observée lorsque la communauté de macro invertébrés qui vit en association avec les moules en culture est incluse dans le calcul de paramètres benthiques. Cette hypothèse a été testée en combinant les données des échantillons prélevés dans le sédiment avec les données des échantillons de boudins de moules. De plus, des sites envahies par l'ascidie envahissante S. clava ont été échantillonnées pour tester l'hypothèse que la présence de cette espèce augmentera davantage l'effet de la
mytiliculture sur les macro invertébrés dans les sites mytilicoles (dans le sédiment et sur les boudins). L'influence de la mytiliculture sur les macro invertébrés a été observée dans 8 baies de l'ÎPE : 3 baies avec S. clava et 5 baies sans cette espèce.
CHAPITRE 1
INFLUENCE OF SUSPENDED MUSSEL AQUACULTURE AND AN
ASSOCIATED INVASIVE ASCIDIAN ON MACROINVERTEBRA TE COMMUNITIES
Lisa Robichaud a,b, Christopher W. McKindsey a,b,*, Philippe Archambault a, Gaston Desrosiers a
a Institut des Sciences de la Mer, Université du Québec à Rimouski, 310 allée des
Ursulines, PO Box 3300, Rimouski CQC) G5L 3Al, Canada
b Fisheries and Oceans Canada, Institut Maurice-Lamontagne, 850 route de la mer, PO
Box 1000, Mont- Joli CQC) G5H 3Z4, Canada
1.1 Abstract
The influence of mussel aquaculture on classic descriptors of benthic community
structure (e.g. abundance, diversity) is weIl known, but the influence of this activity on benthic productivity has not been studied, despite its importance for understanding
ecosystem dynamics and for fisheries management. As weIl, the macroinvertebrates living in association with bivalves in culture have generally been excluded from studies
on the environmental effects of bivalve aquaculture. As suspended bivalve aquaculture creates new macroinvertebrate habitat in the water column, this study tests the
hypothesis that mussel aquaculture increases overall macroinvertebrate productivity
when both sediment and mussel sock invertebrates are considered. Further, the presence of the invasive ascidian Styela clava was expected to increase this effect, by
adding additional structure to mussel socks.
Macroinvertebrates in the sediment and on mussel socks were thus sampled in 8
bays on Prince Edward Island, eastem Canada: 3 invaded by S. clava and 5 where S. clava was absent. The abundance, biomass, and productivity as weIl as the diversity
and structure of assemblages of sediment macroinvertebrates were compared inside and
outside musselleases. Sediment macroinvertebrates in areas inside leases were significantly less abundant and showed a trend towards decreased biomass and
productivity. Using these same parameters, mussel sock invertebrate communities were compared in bays with and without S. clava, showing greater abundance in bays with S. clava. When sediment and mussel sock macroinvertebrates were combined to
leases, these measures were greater inside musselleases than in areas outside. The presence of S. clava did not change this trend. Macroinvertebrates on suspended
mussels may offset negative impacts commonly observed with respect to
macroinvertebrates in the underlying sediments, and should be included in any attempts
1.2 Introduction
Multiple anthropogenic stressors in coastal aquatic ecosystems are of increasing
concem for the general public, habitat managers and ecologists alike. Along with direct habitat loss, aquaculture and invasive species are among those with the greatest
perceived impacts (Simenstad et al. 2000, Costa-Pierce & Bridger 2002, Kappel 2005). Bivalve aquaculture is expanding in many countries worldwide, inc1uding Canada, and Prince Edward Island's suspended long-line mussel industry is a major contributor to Canada's total production of bivalves.
This industry may influence the benthic environment, as bivalve feces and pseudofeces may accumulate on sediments below suspended bivalve aquaculture structures (Dahlback & Gunnarsson 1981). Increased organic loading under suspended
mussels may induce changes to sediment chemistry such as increased ammonification and sulphate reduction (Dahlback & Gunnarsson 1981, Richard et al. 2007). In particular, the influence of this practice on the abundance, biomass and diversity of macrobenthic communities under culture sites has been studied in coastal waters around
the world. This work has shown that suspended bivalve culture may negatively influence the abundance, biomass (Stenton-Dozey et al. 1999), diversity and structure (Mattsson & Lindén 1983, Chamberlain et al. 2001, Callier et al. 2007) of macrobenthic
communities. However, other studies have shown no change or positive influences on
benthic macroinvertebrate abundance (Richard et al. 2007, CaHier et al. 2007), biomass
assemblages (Chamberlain et al. 2001, Miron et al. 2005). In comparison, little effort has focused on the influence of suspended bivalve culture on the secondary productivity of these communities. This basic measurement ofbenthic community functioning de scribes energy flow through benthic macroinvertebrate communities, which provide an important link from primary producers to higher trophic levels and for the recycling ofsedimented organic matter (Crisp 1984, Tumbiolo & Downing 1994). Moreover, invertebrate and fish productivity form the basis for fisheries management in sorne jurisdictions, including Canada (Departrnent of Fisheries and Oceans Canada 1986, Minns 1997).
Furthermore, little work has concentrated on the influence of the structure created by bivalves suspended in the water column on benthic communities. In general, bivalves create important biogenic structure, and have been described as ecosystem engineers. In this way, bivalves growing in suspension may create favourable habitats for macroinvertebrates, as they can provide refuges from predation and adverse environmental conditions (Gutiérrez et al. 2003). Bivalve communities can also provide a direct source of food for other macroinvertebrates, as weIl as biodeposits that may be consumed by detrital organisms (Tenore & Dunstan 1973, Tenore et al. 1985). Indeed, both natural and cultivated mussel populations have been shown to support important macroinvertebrate communities. For example, high macroinvertebrate biomass and diversity has been observed in intertidal mussel beds (Nixon 1971, Tsuchiya & Nishihira 1985). However, following the invasion of Lake Erie by Dreissena spp., Johannsson et al. (2000) observed no change in biomass of
macroinvertebrates (exclu ding Dreissena spp.). Work has also shown that abundant
macrobenthic communities live in association with cultured bivalves, especially mussels
suspended in the water column (Tenore & Gonzalez 1975, LeBlanc et al. 2003a,
Murray et al. 2007), as weIl as with both on- and off-bottom oyster cultures (Dealteris et al. 2004, O'Beirn et al. 2004, Ferraro & Cole 2007). As such, structures used for
bivalve aquaculture appear to provide high-quality habitat for macroinvertebrates and are increasingly recognised as artificial reefs that may benefit macroinvertebrates as
weIl as megafauna and fish (Tenore & Gonzalez 1975, Shumway et al. 2003,
McKindsey et al. 2006, Powers et al. 2007, D'Amours et al. in revision).
As the macroinvertebrate communities associated with suspended bivalves are functionally part of the benthic environment, we suggest that consideration ofboth
sediment macroinvertebrates and mussel sock macroinvertebrates may be a more realistic way to evaluate the effect of bivalve aquaculture on benthic communities. As outlined above, many studies of the impact of suspended bivalve culture on benthic infaunal communities have shown either negative or neutral effects on commonly measured benthic parameters. We predict that the inclusion of the fraction of the benthic macroinvertebrate community associated with suspended bivalves in culture in the ca1culation of macrobenthic community parameters will change su ch relationships to show either neutral or positive influences of suspended bivalve culture on
Exotic ascidians are currently infesting suspended bivalve culture operations around the world (Lambert 2007). HistoricaIly, bivalve aquaculture has been a major vector for the spread of invasive species and has also suffered great losses due to the presence ofthese organisms (Getchis 2005, McKindsey et al. 2007). This is also true in Prince Edward Island (PEI), eastem Canada, where four exotic ascidians have appeared over the past decade including the clubbed tunicate, Styela clava. This ascidian has invaded multiple mussel culture sites since it was first identified in 1998 (Thompson & MacNair 2004). The structure provided by solitary ascidians in natural beds and in aquaculture sites, like the biogenic structure provided by cultured mussels, may also enhance the abundance and diversity of macroinvertebrates, possibly by increasing habitat complexity or heterogeneity (Paine & Suchanek 1983, Crooks 2002, Rodriguez 2006). For example, great abundance, biomass and diversity ofmacroinvertebrates has been reported from subtidal and intertidal beds of the solitary ascidian Pyura stolonifera in South Africa (Fielding et al. 1994) and from intertidal beds in Australia (Monteiro et al. 2002). In the context of suspended bivalve culture, Khalaman (2001) showed that in Russia, when large abundances of the ascidian Styela rustica were present on mussels, associated macroinvertebrate communities had greater average species richness than macroinvertebrate communities associated with mussels with fewer S. rustica.
In comparison to these ascidians, the habitat value of S. clava is less weIl known, but macroinvertebrates have been observed on surfaces colonised by S. clava (Whitlatch et al. 1995, Thompson & MacNair 2004, Dijkstra et al. 2007). Macroinvertebrates may thus be facilitated by the presence of S. clava, as these solitary ascidians grow up to 14
cm long (Thompson & MacNair 2004) and create a complex structure. Therefore, we also predict that the presence of solitary ascidians will create additional biogenic structure on bivalves in suspended culture, and thus further increase the positive
influence of suspended bivalve culture on macrobenthic community parameters, relative to macrobenthic communities living on mussel socks where this additional structure is absent.
The broad aim of this study was to determine the effect of suspended mussel aquaculture and the invasive ascidian S. clava on benthic macroinvertebrate
communities, including both those inhabiting the underlying sediments and those living in association with the cultured bivalves. Specifically, to test the hypothesis that suspended mus sel culture has an influence on benthic infaunal communities, we
compared the abundance, biomass, diversity and secondary productivity of infauna from sediments within mussel aquaculture sites to infauna from sediments ofnearby control sites. We also test the hypothesis that the inclusion of the macroinvertebrate
community living in association with cultured mussels in the calculation ofbenthic community parameters (i.e. combining data from sediment infauna and musselline fouling communities) will show that suspended bivalve culture has a positive influence on macrobenthic community parameters. This hypothesis is further extended by including sites fouled by the invasive ascidian S. clava to test the hypothesis that the presence of S. clava will further strengthen this promotion of benthic macroinvertebrate community parameters in aquaculture sites, relative to aquaculture sites not infested by this ascidian. These hypotheses were evaluated using an observational experiment by
sampling a series of eight embayments with suspended mussel culture, including sorne infested with S. clava, in Prince Edward Island.
1.3 Materials and methods .
1.3.1 Study site
This study was do ne in 8 bays used for mussel aquaculture on Prince Edward Island (PEI), eastem Canada (Figure 1). They were selected for the availability of control sites of similar depth and oceanographic conditions to culture sites (see below). On PEI, mussels are grown-out on traditional subsurface dropper lines (socks) in shallow bays and rivers (depth approximately 4 m; (Drapeau et al. 2006)), mainly on the north and east coasts. In addition to mussels, oysters are also cultured in many bays. Mussel aquaculture production has been increasing on PEI since the early 1980s and the majority of the bays studied have been used for mussel aquaculture since the early-mid 1980s. However, in Malpeque Bay (Bideford River) and Rustico, mussels have been cultured since the late 1980s and early 1990s respectively (personal communication cited in Shaw, 1998, personal communication D. Small).
In 2004, total mussellandings were 15.6 million kg, with musselleases covering a total area of approximately 43 km2 (Department of Fisheries and Oceans Canada, Gulf Region Statistics Division and Charlottetown). Bivalve aquaculture sites (leases) occupy a significant area of the 8 bays selected in this study: the mean area covered by musselleases was 2.57 km2 (± 1.06 SD), equivalent to a mean of 13.77% of total bay
surface area (Table 1). These values are similar to those for aIl 30 bays containing
mussel grow-out leases in 2005 (mean of 1.44 km2 ± 1.71 SD covered by musselleases, equivalent to a me an of 12.52% oftotal surface area). Maps of aIl areas 1eased for shellfish culture are available online from the Department of Fisheries and Oceans Canada (2008) (http://www.glf.dfo-mpo.gc.ca/ao-bl/pei-ipe/leasing-bauxlmaps-cartes -~). Drapeau et al. (2006) completed a survey of musselleases across PEI in 2003, and reported an average density of23.3 socks per 100 m2 within musselleases (n=111 ±
18.3 SD), with an average sock length of2 m (n=111 ±0.3 SD). These values will be used in subsequent ca1cu1ations.
Table 1. Estimated total bay area, area leased for mussel grow-out in 2005 and % ofbay leased for musse1 grow-out, for each bay samp1ed (data from Fisheries and Oceans Canada, Charlottetown, 2007). (S) indicates bays with Styela clava.
Area leased
% of bay area Bay area (km2) for mussel
Bay
grow-out leased for (km2) mussel grow-out
Malpeque (Bideford River) 133.06 4.34 3.26
Marchwater 7.84 1.51 19.29 New London 15.29 2.54 16.58 Rustico 12.16 2.05 16.87 Cardigan 55.70 2.33 4.18 Brudenell (S) 8.45 1.20 14.23 Saint Marys (S) 16.66 2.86 17.17 MurraZ' River (S) 19.95 3.71 18.60
68" 66" 64" 62" 60° 58" 56"
64'20' 64'00' 63'40'
10 r-__ 0 10 20 30 40 Kilomelers
N Prince Edward Island Bays
Mal: Malpeque (Bideford River)
Mar: Marchwater
W
~
E ~
S Q NL: New London Rus: Rustico Car: Cardigan Bru: Brudenell St M: Saint MarysMur: Murray River
~~~---Car ...::;;.~..-.--- Bru (S)
St M (S)
Figure 1. The Maritime Provinces of Canada, with in sert of Prince Edward Island showing bays sampled. (S) indicates bays with Styela clava,
,----, lkm
•
•
.
~
Mar Bru (S) Mur(s)Figure 2. Sampling locations in bays shown in Fig. 1. Shaded areas are musselleases. . :
control samples (sediment) 0: sediment samples inside leases ~: sediment and mussel sock
samples inside leases (separated by approximately 30 m). (S) indicates bays with Styela clava. Note that the scale is consistent throughout.
AIl bays included in this study had control sites at least 300 m from aquaculture sites and of similar depth. Control sites at this distance, while being of similar depth and having similar oceanographie conditions to culture sites, were not expected to be under the direct influence of sedimentation from mussel aquaculture (Grant et al. 2005, Callier et al. 2006, Callier et al. in press). The mean depth oflocations sampled inside leases was 4.58 m (±1.42 SD) vs a mean depth of 4.52 m (±1.64 SD) outside leases. The bays sampled included 3 bays where adult S. clava were observed in situ and were abundant during sampling (Bays with S. clava: BrudeneIl, Saint Marys, Murray River), and 5 bays where no adult S. clava were observed (Bays without S. clava: Malpeque (Bideford River), Marchwater, New London, Rustico, Cardigan) (Figure 1). Mean annual bottom temperature in aIl bays was estimated at 8.6°C, based on data collected over 1 year in Malpeque and Covehead bays on PEI (mean bottom temperature of 8.4°C and 8.9°C respectively; Fisheries and Oceans Canada Gulf Region, Aquatic Ecosystems Section, personal communication).
1.3.2 Field sampling methods
Sampling was done from August 16 to 25, 2005. Two types of macroinvertebrate communities were sampled 1) macroinvertebrates living in association with mussel socks (=mussel sock macroinvertebrates) and 2) macro invertebrates living in and on the sediment (=sediment macroinvertebrates). In each bay, 5 sediment samples were collected in si de of musselleases and a further 5 sediment samples were collected at least 300 m outside ofmusselleases. As weIl, in each bay 3-5 samples of 1
+
age class mussel socks were collected from leases of mus sel growersparticipating in this study (Figure 2). Mussels in this age class had typically been placed in socks for grow-out in autumn 2003. Sampling locations within each zone were randomly selected, as were sampling positions on mussel socks. Depths sampled ranged from approximately 1-2.7 m.
AlI sediment samples were collected by SCUBA divers using PVC sediment carers 10 cm in diameter, to a depth of 10 cm. Mussel socks were sampled using 50 cm mesh (1 mm) bags that seal on 3 sides with Velcro. These were sealed around a portion of the mussel socks in situ and the mussels and associated organisms were loosened by hand from the mussel sock within the bag. The bag and its contents were removed from the sock by, starting from one corner, simultaneously opening and resealing the sides of the bag until it was freed from the sock.
The mean length ofmussels per subsample ranged from 49.1-67.6 mm with an overall mean length of 56.7 mm (subsample n=1116, ±9.6 SD), excluding mussels
shorter than approximately 3 cm which was considered to be secondary set (i.e., to have settled on the socks). Styela clava collected in mussel sock samples were up to 145 mm long. The total number of S. clava per sample ranged from 25-658, while biomass
ranged from 1.92-334.83 g per sample (Table 2), although these measures ofbiomass are probably underestimated because large S. clava were frozen and became dehydrated after thawing. Although no adult S. clava were observed in Marchwater, 112 small S. clava individuals were observed in one sample upon processing (total biomass=1.24 g). Only socks containing S. clava were sampled in bays infested by this species. Water depths for individual sediment samples were estimafed from hydrographic charts using
GPS points taken in the field. Depths of mussel sock samples were estimated from their relative positions on the socks.
Table 2. Total number and biomass of Styela clava per 50 cm
mussel sock sample (totals calculated from subsamples of
juveniles and full samples ofadults). Averages (±SE) are indicated in boldo
Number of Biomass' of
S. clava S. clava
Bay per sample per sample (9)
Brudenell 237 117.88 25 2.1 352 63.07 205 (96) 61.02 (33.44) Murray River 170 28.08 60 28.89 658 334.83 296 (184) 130.60 (102.11) St Marys 128 7.04 517 5.03 54 1.92 233 (144) 4.67 (1.49)
IBiomass of large S. clava is underestimated as these individuals were frozen and became
1.3.3 Laboratory methods
AIl macroinvertebrate samples were sieved through a 1 mm mesh. Sorne
organisms, inc1uding Asteriidae and Cirripedia, were frozen because of their large size, while the rest were fixed in formaldehyde (4% in a buffered saline solution) and
transferred to 70% ethanol for conservation within the following month. Before sorting, samples of epifauna from mussel socks were split into subsamples using an aggregate sample splitter (Humboldt Materials Testing Solutions Model H-3985). Benthic macroinvertebrates were then sorted using a dissection microscope and identified to the
lowest taxonomic level possible. Ascidians, bivalves and gastropods were generally
identified to genus; echinoderms, polychaetes and crustaceans were generally identified to family (see Annex 1 for a list of taxa identified from each bay). The taxa Nemertea,
Nudibranchia and Oligochaeta were rare and were excluded from analyses. Colonial
organisms (hydrozoans and bryozoans) were also exc1uded from aIl analyses because they could not be enumerated and as su ch, their productivity could not be estimated using the method employed in this study (see below). Sediment macroinvertebrates weighing more than 2 g were exc1uded from analyses (excluded n=1 Nereidae weighing 2.46 g). Mussels and S. clava were exc1uded from aIl analyses. Note that the organisms exc1uded from the analyses were largely associated with mussel sock samples.
Abundance and biomass
Biomass was measured as blotted wet weight (with sheIls). Weight-to-weight
and Bourget (1998) were used to convert wet-weights to KJ. When reliable conversion factors for identified taxa were not available, factors for the closest taxonomie levels
were used. Abundances inc1uded heads of incomplete organisms. For biomass
ca1culations, for each taxon in each sample, the number of heads of incomplete
organisms was multiplied by the me an individual body mass (of complete individuals), and added to the total biomass of complete organisms. For each sample, the abundance and biomass of each taxon was standardized to 1 m2 and pooled to obtain total
macroinvertebrate abundance and biomass. Mussel sock samples were standardized to m2 ofbottom area using the average mussel sock length and density as given in Drapeau et al. (2006).
Productivity
Secondary productivity of each taxon identified in each sample was estimated using an empirical model proposed by Brey (2001) for benthic macroinvertebrate populations (based on global data from freshwater and marine populations).
LogP = 7.947
+
10gB -2.29410gWmean - 2409.856 *l/(T+
273)+
0.168 (l/D)+
0.194 Dsubt+
0.180 Dinf+ 0.277 Dmoti+
0.174 DM - 0.188 Dechi+
582.851 10gW mean * l/(T+
273),where ~ is mean annual biomass (KJ m-2); Rmean is mean body mass (KJ ind-');
l
is mean annual bottom temperature (oC); D is depth (m); and the remaining variablesare dummy variables (no
=
0, yes=
1) for: subtidal species (I1..J!!20; infauna (Di!lÔ; motile epifauna (Dmoti); Annelida or Crustacea (DM); Echinodermata (D~Dummy variables to de scribe ecological characteristics of families were determined using available literature (e.g. Ruppert & Bames 1995, Rouse & Pleijel 2001). Taxa not determined to be exc1usively infaunal or epifaunal were considered epifaunal if they were found on mussel socks and infaunal if they were found in sediment samples. Productivity estimates for each taxon in each sample were
standardized to 1 m2 ofbottom area. Mussel sock samples were standardized to m2 of bottom area using the average mussel sock length and density as given in Drapeau et al. (2006). Estimates of productivity of individual taxa were pooled to obtain total
macroinvertebrate productivity for each sample.
1.3.4 Statistical methods
Abundance, biomass and productivity of macroinvertebrates
A split-plot ANOV A model with 3 factors was used to analyse macroinvertebrate abundance, biomass and productivity: Bay type (fIxed with two levels, with and without
S. clava), Bay (random with 8levels, 3 with S. clava and 5 without, nested in Bay type) and Position (fIxed with two levels, inside and outside musselleases). Separate
analyses were done for sediment samples and mussel sock samples, and contrasts were used to compare macroinvertebrates sampled inside musselleases (mussel socks
+
x+ 1 transformed to meet assumptions of homogeneity and normality. Analyses on abundance, biomass and productivity of macroinvertebrates were done using SAS (MIXED procedure, SAS 1999).
Diversity
Taxonomic richness of sediment and mussel sock samples was evaluated using the ANOV A model described above. Sediment data were log (x+ 1) transformed to meet the assumptions of this test, whereas mussel sock data was not transformed. Because mussel sock samples were split into various fractions prior to laboratory
analysis, organisms were randomly resampled in order to compare the richness of a
standard fraction of each mussel sock sample. As such, taxonomic richness was calculated from V4 of each sample, with the exception of one mussel sock sam pIe from
New London, for whieh taxonomie riehness was ealculated from only Ys ofthe sample
(sample with extremely large abundance of organisms).
Total taxonomic richness ofmacroinvertebrates sampled inside leases (mussel soeks + sediment) was eompared to taxonomie riehness outside leases for the same unit bottom area, using a non-parametrie Wilcoxon paired-sample test with bays as
replieates. For this analysis, the number oftaxa inside leases was ealculated by pooling
sediment samples from inside leases (total bottom area sampled=O.039 m2, exeept
Murray River bottom area sampled=O.031 m2) and ad ding to this total anyadditional
species found in mussel soek samples of equivalent length, based on the average density of mus sel socks on PEI. However, the length of the mus sel sock samples collected was
greater than the length required for this analysis. Therefore, in addition to standardising musse! sock samp!es to 114 as described above, a reduced proportion of musse! sock
organisms were randomly selected for this analysis: a fraction equivalent to a 0.039 m2 area, based on average density of mussel socks on PEI (measured by Drapeau et al. (2006)). In bays where n=3, 1.3% of each mussel sock sample was selected. In bays where n=5, 0.78% of each mussel sock sample was selected. The number of taxa outside leases was calculated by pooling sediment samples taken outside leases.
Multivariate community structure
The multivariate structure of sediment macrobenthic assemblages was compared using Distance-Based Multivariate Analysis (DISTLM) (Anderson 2001). A z ero-adjusted Bray-Curtis coefficient (Clarke et al. 2006) was employed because of the presence ofblank samples. The Bray-Curtis coefficient was adjusted by adding a dummy taxon with equal abundance, biomass, and productivity in each sample (dummy taxon abundance=l ind. m-2
; dummy taxon biomass and productivity = 1.2732 xl 0-5 g
m-2 and 5.67 xl 0 -4 KJ m-2 yr-l respectively, corresponding to the lowest observed
values). To facilitate multivariate analyses, one missing control sediment sample replicate from Murray River was replaced by the average of remaining replicates at that treatrnent and location.
Non-metric multidimensional scaling (nMDS), analysis of similarities
(ANOSIM) and similarity percentages (SIMPER) analyses were done in PRIMER using the Bray-Curtis similarity measure (Clarke & Warwick 2001). For aIl multivariate
analyses, data were square-root transfonned to decrease the influence of dominant taxa (Clarke & Warwick 2001).
1.4 Results
1.4.1 Sediment macroinvertebrates
When sediment macroinvertebrates were classified into general taxonomic groups (see Table 3), Polychaeta had the highest abundance, biomass and productivity both inside and outside musselleases. Inside musselleases, Polychaeta accounted for up to 92.3%, 90.9% and 96% ofmean total abundance, biomass and productivity per bay, respectively. Outside leases, Polychaeta accounted for up to 93.8%, 63.5% and 83.4% of mean total abundance, biomass and productivity per bay, respectively. A full list of taxa identified from sediment samples from each bay is included in Annex 1.
Mean total abundance ranged from 280-12452 ind. m-2 inside musselleases and from 3743-8123 ind. m-2
outside ofleases, and was significantly lower inside mussel leases (Fig. 3, Table 4). Although ANOVA results comparing biomass and productivity inside vs outside leases were marginally not statistically significant (Table 4), biomass and productivity were lower inside musselleases in 7 of 8 bays (Fig. 3). The taxonomic richness and the structure of assemblages did not differ significantly by position (inside vs outside of leases) (Fig 4, Table 5; Table 6).
Abundance, biomass and productivity of sediment macroinvertebrates did not
differ significantly between bays with and without S. clava or as a function of Position
x Bay type (Fig. 3, Table 4). As weIl, the diversity (number of taxa) and structure of
assemblages of sediment macroinvertebrates did not differ significantly for these factors
Table 3. Mean a) abundance, b) biomass and c) productivity ofmacroinvertebrates in 7 taxa, and means oftotals from sediment samples
outside musselleases (C), sediment samples under musselleases (Msed), and mus sel socks (Msocks). Bay abbreviations are as in Figure 1.
Actinaria were absent from sediment samples (C and Msocks), Asteriidae were absent from sediment samples outside leases. a) Abundance (ind. m-2)
Actiniaria Ascidiacea Asteriidae Bivalvia Crustacea Gastropoda Polychaeta Mean total ind m-2
Bays MSOCks C Msoo MSOCkS MSGd Msocks C Msoo Msocks C Msoo MsockS C Msoo Msocks C Msoo MsockS C MSGd Msocks
Bru St M Mur Mal Mar NL Rus Car 19 33 3 22 17 23 5 20 b) Biomass (g m-2) Bays Bru St M Mur Mal Mar NL Rus Car Actiniaria MSOCkS 1.85 11.41 0.08 0.25 0.28 1.15 0.14 0.27 51 76 968 25 76 76 4260 287 2869 246 1943 386 1814 766 Ascidiacea 76 25 51 18 484 560 96 1846 153 25 40 713 2725 40 891 433 15 2419 484 4 433 51 32 60 789 64 Asteriidae Bivalvia 185 153 102 1068 271 3361 407 3939 59 446 1973 21 88 29 9 135 255 1146 394 280 102 290 382 280 793 306 25 949 64 448 Crustacea 76 25 62 204 102 112 541 25 917 1401 1044 968 484 280 586 25 382 64 133 672 75 137 23 Gastropoda 3820 789 4023 1019 4011 942 4380 7079 2750 891 4456 3896 2445 1222 2572 127 528 4074 1935 6199 468 8123 2088 5128 84 6844 1146 5083 216 399 365 407 417 6264 12452 1073 4966 2394 3448 7818 5017 1687 3769 1324 3325 3743 280 1870
Polychaeta Mean total 9 m-2
C MSGd Msocks Msoo Msocks C MSGd Msocks C MSGd Msocks C MSGd Msocks C MSGd Msocks C Msoo Msocks 4.38 73.47 0.98 6.20 0.01 55.67 1.96 2.42 25.14 0.60 0.27 0.93 19.08 7.02 5.01 0.11 0.86 4.06 4.22 0.07 1.03 3.86 2.26 3.23 1.56 6.32 3.34 5.73 10.50 8.96 2.38 3.22 0.27 0.93 2.93 1.69 3.07 5.83 3.47 0.55 2.02 0.18 7.28 3.45 3.41 0.05 6.94 8.13 6.56 13.09 10.48 95.07 6.34 17.39 12.05 35.28 1.49 19.59 10.57 71.89 0.28 4.86 1.05 6.61 0.12 0.16 1.01 0.23 5.42 2.28 0.48 11.53 8.86 3.24 18.16 20.99 11.61 2.32 4.11 1.07 0.85 0.20 0.04 0.14 5.47 2.26 3.25 13.07 7.17 3.51 22.85 10.54 35.48 10.01 11.63 4.64 0.34 0.42 0.22 0.37 3.94 3.82 0.11 16.64 10.94 11.19 33.24 19.89 24.10 36.46 4.20 0.29 0.11 0.15 0.01 23.27 3.28 0.04 3.55 5.04 3.37 11.18 12.68 3.70 93.78 0.42 5.41 3.82 0.02 4.66 0.21 1.46 9.07 0.12 3.61 18.32 3.41 31.20 0.77 25.84
Table 3. (continued)
c) Productivity (KJ m-2 yr-I)
Actiniaria Ascidiacea Asteriidae Bivalvia Crustacea Gastropoda Polychaeta Mean total KJ m-2 y(1 Bays M.ock. C M.ad M.ock. M.ad M.ock. C M.ad M.ock. C M.ad M.ock. C M.ad M.ock. C M.ad M.ock. C M.ad M.ock. Bru 2.53 3.48 44.84 14.10 0.23 1.33 6.21 25.36 0.87 8.43 9.81 4.95 1.94 61.83 28.75 53.69 97.23 39.38 131.74 St M 12.27 1.03 2.87 8.01 4.97 6.23 2.16 78.70 18.17 48.22 2.92 8.05 1.41 68.67 26.36 46.66 156.30 58.81 121.60 Mur 0.17 0.03 34.35 28.81 19.14 3.18 4.81 3.38 10.93 15.54 0.35 64.64 40.67 8.94 102.70 44.22 88.01 Mal 0.56 1.95 1.80 1.01 11.60 2.98 15.89 0.25 1.62 12.06 2.53 15.29 13.42 2.11 100.20 76.78 21.95 120.09 121.10 40.80 Mar 0.58 19.12 6.17 9.02 2.52 1.70 2.56 0.41 1.58 25.96 13.55 16.85 77.18 37.40 28.86 114.73 53.88 74.85 NL 1.72 0.80 0.23 0.93 13.83 26.02 12.17 0.59 3.68 2.41 4.05 17.30 15.44 0.81 115.88 95.38 42.02 163.68 125.62 63.95 Rus 0.28 16.24 34.66 6.28 0.77 0.24 1.06 0.07 36.12 16.27 0.28 13.36 44.72 27.10 71.99 68.34 28.22 172.90 Car 0.57 5.37 1.36 12.56 7.56 0.07 5.36 1.19 4.86 28.72 0.70 1.35 113.74 36.27 150.03 3.33 66.34
16000 ~ 14000 N 'E 12000
-g
10000 ~ 8000 c ro 6000 "0 § 4000 .0«
2000 _ Sedimentc::::J
Mussel socks O-L.uL-.u __ ~ __ ~~L-.uL-~ __ ~~ 140 120 -<:' 100 E .9 80 fi) fi) 60 ro E .Q 40 CO 20 0 250 ';" .... >. 200 <:' E -, 150 ~ .è;-S 100 t5 ::J "0 50 0 .... e... 0 CM CM CM Bru StM MurWith S. clava Without S. clava
Figure 3. Mean (±SE) total abundance, biomass and productivity of sediment and mussel sock macroinvertebrates in control sites (C) and musselleases (M) in 3 bays with Styela clava and 5 bays without S. clava (see Fig. 1 for bay abbreviations). n=5 for sediment samples except Mur where n=4; n=3 for mussel sock samples except NL and Mal where n=5.
Table 4. Results of ANOVAs to test fixed effects a) Bay type (with vs without Styela clava) and Position (inside vs outside musselleases) on log (x+ 1) transfonned sediment macroinvertebrate abundance, biomass and productivity, and b) Bay type on log-transfonned mussel sock macroinvertebrate abundance, biomass and productivity. Random effects Bay (Bay type) and
Bay (Bay type) x Position are also shown.
Source of variation Abundance Biomass Productivity
df,
a} Sediment df errar F p F P F P
Bay type 1,6 0.01 0.9360 0.02 0.8934 0.00 0.9968
Bay (Bay type) 6,6 1.32 0.3736 0.14 0.9856 0.14 0.9841
Position 1,6 6.64 0.0420 4.85 0.0698 5.88 0.0515
Bay type x Position 1,6 0.21 0.6658 0.36 0.5688 0.01 0.9425 Bay (Bay type) x Position 6,63 2.06 0.0710 2.63 0.0244 3.68 0.0034
Error 63
b) Mussel socks
Bay type 1,6 15.21 0.0080 2.73 0.1495 2.08 0.1990
Bay (Bay type) 6,20 0.42 0.8599 1.90 0.1307 2.02 0.1100
25
20
15
10
MM
ControlMIR
Mussel leasesNu m ber o f taxa
Bru StM Mur Mal Mar NL Rus Car With S. clava Without S. clava
Figure 4. Taxonomie richness (±SE) of sediment macroinvertebrates sampled inside and outside mussel leases in bays with and without Styela clava.
Table 5. Results of ANOVA to test fixed effects Bay type (with vs without Styela clava) and position (inside vs outside mussel leases), on a) log- (x+1) transformed taxonomie richness of sediment macroinvertebrates and b) taxonomie richness of mussel sock macroinvertebrates. Random effects Bay (Bay type) and Bay (Bay type) X Position are also shown. Source of variation a) Sediment Number of taxa df, df error F Bay type 1, 6 0.61 0.4623
Bay (Bay type) 6, 6 0.95 0.5236
Position 1, 6 1.92 0.2149
Bay type x Position 1, 6 0.04 0.8419 Bay (Bay type) x Position 6, 63 3.72 0.0032 Error
b) Mussel socks
63
Bay type 1, 6 3.09 0.1291
Bay (Bay type) 6, 20 1.73 0.1665
Error 20 C'il x 25 20 !9 15 Ci Qi
E
10 :l Z 5o
_ Control _ MusselleasesBru StM Mur Mal Mar NL Rus Car With S. clava Without S. clava
Figure 4. Taxonomie riehness (±SE) of sediment maeroinvertebrates sam pied inside and
outside musselleases in bays with and without Styela clava.
Table 5. Results of ANOVA to test fixed effeets Bay type (with vs without Styela clava) and position (inside vs outside musselleases), on a) log-(x+ 1) transfonned taxonomie
riehness of sediment maeroinvertebrates and b) taxonomie riehness of mussel soek maeroinvertebrates. Random effeets Bay (Bay type) and Bay (Bay type) x Position are
aiso shown.
Source of variation Number of taxa df,
a} Sediment df errar F p
Bay type 1,6 0.61 0.4623
Bay (Bay type) 6,6 0.95 0.5236
Position 1,6 1.92 0.2149
Bay type x Position 1,6 0.04 0.8419 Bay (Bay type) x Position 6, 63 3.72 0.0032
Error 63
b) Mussel socks
Bay type 1,6 3.09 0.1291
Bay (Bay type) 6,20 1.73 0.1665
Bay type and Position on sediment macrobenthic assemblages using parameters a) abundance, b) biomass and c) productivity. Data for a11 3 parameters were ,,-transformed prior to analysis. Random effects Bay (Bay type) and
Bay (Bay type) x Position are also shown.
a)
Abundance df,
Source of variation df error MS Pseudo-F Permutation P
Bay type 1,6 7897.82144 1.08196 0.30450
Bay (Bay type) 6,64 7299.54653 2.39036 0.00010
Position 1,6 4652.66779 0.88776 0.52320
Bay type x Position 1,6 2903.65398 0.55403 0.75770 Bay (Bay type) x Position 6,64 5240.92445 1.71623 0.00240
Error 15,64 6032.97326
b)
Biomass df,
Source of variation df error MS Pseudo-F Permutation P
Bay type 1,6 7258.22714 1.06136 0.32300
Bay (Bay type) 6,64 6838.59488 1.93065 0.00040
Position 1, 6 6532.76881 1.50263 0.17030
Bay type x Position 1,6 3130.04306 0.71995 0.66610 Bay (Bay type) x Position 6,64 4347.56690 1.22739 0.11830
Error 15,64 5589.38594
c)
Productivit}' df,
Source of variation df error MS Pseudo-F Permutation P
Bay type 1, 6 7520.04269 1.06731 0.32540
Bay (Bay type) 6,64 7045.78492 1.96716 0.00040 Position 1, 6 5490.66495 1.21915 0.30220 Bay type x Position 1,6 3295.25327 0.73168 0.65440 Bay (Bay type) x Position 6,64 4503.66677 1.25741 0.09070