Any correspondence concerning this service should be sent to the repository administrator: [email protected]
DOI:10.1088/1757-899X/33/1/012062
Official URL:
http://dx.doi.org/10.1088/1757-899X/33/1/012062
This is an author-deposited version published in: http://oatao.univ-toulouse.fr/ Eprints ID: 8766To cite this version:
Lacaze, Jacques and Eiken, Janin and Hazotte, Alain Resampling technique
applied to statistics of microsegregation characterization. (2012) IOP
Conference Series: Materials Science and Engineering, Vol. 33 (Conf. 1). pp.
1-8. ISSN 1757-899X
O
pen
A
rchive
T
oulouse
A
rchive
O
uverte (
OATAO
)
OATAO is an open access repository that collects the work of Toulouse researchers and makes it freely available over the web where possible.
Resampling technique applied to statistics
of microsegregation characterization
Jacques Lacaze1, Janin Eiken2, Alain Hazotte3
1 - CIRIMAT, Université de Toulouse, BP 44362, 31030 Toulouse, France 2 - ACCESS e.V., Aachen, Germany
3 - LETAM, Université Paul Verlaine, Metz, France E-mail: [email protected]
Abstract. Characterization of chemical heterogeneities at the dendrite scale is of practical importance for understanding phase transformation either during solidification or during subsequent solid-state treatment. Spot analysis with electron probe is definitely well-suited to investigate such heterogeneities at the micron scale that is relevant for most solidified products. However, very few has been done about the statistics of experimental solute distributions gained from such analyses when they are now more and more used for validating simulation data. There are two main sources generating discrepancies between estimated and actual solute distributions in an alloy: i) data sampling with a limited number of measurements to keep analysis within a reasonable time length; and ii) uncertainty linked to the measurement process, namely the physical noise that accompanies X-ray emission. Focusing on the first of these sources, a few 2-D composition images have been generated by phase field modelling of a Mg-Al alloy. These images were then used to obtain "true" solute distributions to which to compare coarse grid analyses as generally performed with a microanalyser. Resampling, i.e. generating several distributions by grid analyses with limited number of picked-up values, was then used to get statistics of estimates of solute distribution. The discussion of the present results deals first with estimating the average solute content and then focuses on the distribution in the primary phase.
1. Introduction
In a previous work [1], a review of the basic understanding of microsegregation build-up and its effects on cast products was made, together with a description of the most usual ways to characterize it. At present time, this characterization of solutes distribution at the scale of dendritic grains makes most often use of automatic energy (EDX) or wave-length (WDX) dispersive micro-analyzers. The procedure generally followed consists in recording N spot analyzes along a regular grid on a metallographic section of the material to be characterized. In multicomponent alloys, correlation between the contents in different alloying elements (wi) should be analyzed to highlight the presence of minor phases [1-4] and separate primary phase from secondary phases as there can be non-monotonous evolution for some solutes during multiphase deposits [3]. Then, data are sorted and a cumulative distribution may be plotted as the fraction of points fN giving a solute count lower (or higher) than a specified value wi for each of the identified phases.
It is quite a usual practice in the solidification field to compare the function wi(fN) to the so-called Scheil's model or to profiles calculated accounting for solute diffusion during solidification [5-7]. doi:10.1088/1757-899X/33/1/012062
Solute distributions could as well be useful means to follow the effect of solid-state diffusion during heat treatments in the solid state that are generally designed to smooth out microsegregation [8, 9].
Very few has however been made concerning the confidence that can be put on the experimental distribution curves. Gungor [10] considered that each composition range used to sort the data could define an individual phase and applied "usual" statistics to the volume fraction estimate of each of these "virtual" phases. Actually, investigation of the statistical quality of any characterization methodology of chemical heterogeneities should best be checked on simulated images for which the distributions are known. Such studies have been performed first on very simple simulated microstructures [11-13]. Recently, more realistic images were obtained by phase field modelling on which systematic resampling was used to characterize statistics of grid analysis [14]. Since then, the proposed resampling technique has been used by Zollinger and Daloz on experimental chemical mapping of a ternary alloy [15]. The present work complements the previous study [14], it presents image generation and results from resampling, and finally discusses the best practice for microsegregation characterization.
2. Image generation
The image generation procedure is the same as previously [14], i.e. 2-D images were calculated using the phase field software Micress [16, 17] applied to the solidification of a Mg-3Al (wt.%) alloy [18]. The only difference is that the number of grain nuclei was increased from 400 to 900. As before, the grains were implemented within a calculation domain of 6000x6000 cells with a cell size ∆x set at 2
µm, thus leading to an average grain size of 400 µm. Periodic conditions were assumed at the outer boundaries of the domain.
Calculations were started at 904 K for a liquidus temperature equal to 904.41 K. Temperature evolution was modelled averaged over the calculation domain by the balance between heat extraction and latent heat release. The specific heat was set to 2.8 J.K-1.cm-3 for the liquid and 1.9 J.K-1.cm-3 for the (Mg) solid solution. A constant heat extraction rate of -30 J.cm-3 combined with a latent heat of 650 J.cm-3 resulted in an initial decrease in temperature followed by a distinct recalescence during about 4 seconds. Driving force for growth ∆g (J.cm-3.K-1) was extrapolated from a thermodynamic calculation performed for the initial composition based on Calphad data [19]:
T
0.842
{
T
T
(
w
0)
}
dT
g
d
g
liq liq−
⋅
=
∆
⋅
∆
=
∆
(1) where T [K] stands for temperature and the subscript "liq" for liquidus. The liquidus temperature Tliq is expressed as:
(
)
=
liq(
0)
+
liq⋅
(
l−
0)
=
904
.
407
−
5
.
215
⋅
(
l−
3
.
0
)
lliq
w
T
w
m
w
w
w
T
(2)where w0 and wl are the nominal and liquid aluminium contents (wt.%), and mliq is the liquidus slope. Solute partitioning at the interfaces was extrapolated from the same thermodynamic calculation by:
(
3
.
0
)
626
.
17
215
.
5
819
.
0
)
(
0 0 ,−
−
−
+
=
−
+
=
l l sol liq s sw
w
w
m
m
w
w
(3)where ws and ws,0 stand for solute content in the solid in equilibrium with liquid at, respectively, wl and the nominal content w0. The partition coefficient between (Mg) and liquid is equal to 0.273 at the time of nucleation and increases slightly during solidification. Diffusion of Al was simulated with a constant coefficient in the liquid (10-5 cm2.s-1) and temperature dependent in the solid phase (Dso=12 cm2.s-1 and Qs=144000 J.mol-1) giving a diffusion coefficient of 5.6 10-8 cm2.s-1 at the liquidus temperature. In order to have a significant change in solute concentration within the final images, all simulations were stopped after a solidification time of 14 s, the solid fraction being about 0.7. The Al concentration fields were then written out to generate images.
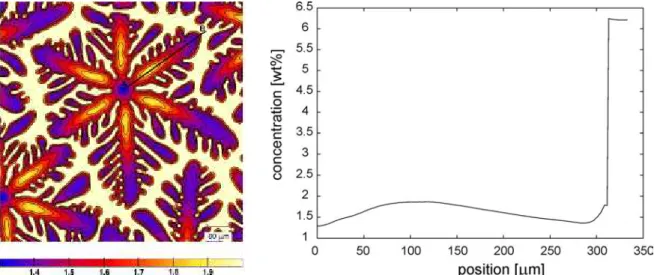
Figure 1a shows the composition map for one grain and figure 1b the composition profile along the line A-B in figure 1a. When a nucleus has formed at the given undercooling, it grows with solute
piling up away from the liquid/solid interface. This leads to the increase in the solid concentration from zero to about 100 µm in figure 1b. After some time, the growth rate decreases due to the recalescence and so does the pile-up, this corresponds to the solute decrease from 100 to 290 µm. Finally, when neighbouring solute fields in the liquid start interacting with each other, the concentration in the liquid increases and so does again the concentration in the solid, from 290 to 310 µm.
Figure 1. Mapping of the aluminium distribution in one grain (left column) and aluminium profile
along the dendrite arm AB (right column).
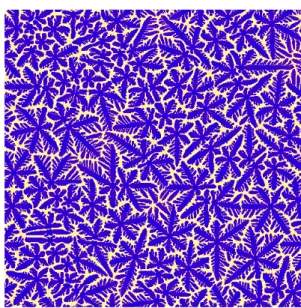
Interfacial energies and mobilities of the solid phase were defined with hexagonal anisotropy [18] and grain orientations were set randomly. Figure 2-a shows an image for which the nuclei have been implemented with a minimal distance (320 µm) between them leading to grains with nearly equal size (the image will be referred as ES for equal-size). Figure 2b presents a zoom on a second image when the nuclei have been implemented at random (labeled RM for random in the following). A zoom of each image is presented in figure 3. In both images, the liquid in the interdendritic areas is enriched in aluminium. It could as well be considered as a eutectic with unresolved microstructure.
Figure 2. Images generated with 900 grains implemented: a) with geometrical constraint (left
column); or b) randomly (right column). Note that the colour scale is not the same as in figure 1a. The side length is 1.2 mm.
Figure 3. Zoom of the images in figure 2. Note that the colour scale is not the same as in figure 1a.
The side length is 350 µm.
The chemical composition distribution of each image (6000x6000 cells) was drawn using classes 0.1 wt.% Al in size. Figure 4a compares the distributions of the ES and RM images. They are quite similar with two main peaks corresponding to the primary and liquid phases at low and high aluminium contents respectively. The fact that the peak at low solute contents is doubled is somehow fortuitous with the side-peak at higher Al contents being related to the upper part of the recalescence stage in figure 1b. 0 5 10 15 20 25 30 0 1 2 3 4 5 6 7 equal-size ES random RM F re q u e n c y (% ) Aluminium content (wt.%) a 0 0.2 0.4 0.6 0.8 1 0 1 2 3 4 5 6 7 equal-size ES random RM Scheil Cumulative fraction A lu m in iu m c o n te n t (w t. % ) b
Figure 4. Distribution (a) and cumulative distribution (b) of aluminium. Solid and interrupted lines
correspond to ES and RM images.
The dotted line in (b) is the profile calculated according to Scheil's model.
The corresponding cumulative distributions are plotted in figure 4b. As expected, they show very limited difference between each other in agreement with the distribution in figure 4a. The peak associated to the primary phase is slightly narrower for the RM image in figure 4a, leading to a
Solute distributions could as well be useful means to follow the effect of solid-state diffusion during heat treatments in the solid state that are generally designed to smooth out microsegregation [8, 9].
Very few has however been made concerning the confidence that can be put on the experimental distribution curves. Gungor [10] considered that each composition range used to sort the data could define an individual phase and applied "usual" statistics to the volume fraction estimate of each of these "virtual" phases. Actually, investigation of the statistical quality of any characterization methodology of chemical heterogeneities should best be checked on simulated images for which the distributions are known. Such studies have been performed first on very simple simulated microstructures [11-13]. Recently, more realistic images were obtained by phase field modelling on which systematic resampling was used to characterize statistics of grid analysis [14]. Since then, the proposed resampling technique has been used by Zollinger and Daloz on experimental chemical mapping of a ternary alloy [15]. The present work complements the previous study [14], it presents image generation and results from resampling, and finally discusses the best practice for microsegregation characterization.
2. Image generation
The image generation procedure is the same as previously [14], i.e. 2-D images were calculated using the phase field software Micress [16, 17] applied to the solidification of a Mg-3Al (wt.%) alloy [18]. The only difference is that the number of grain nuclei was increased from 400 to 900. As before, the grains were implemented within a calculation domain of 6000x6000 cells with a cell size ∆x set at 2
µm, thus leading to an average grain size of 400 µm. Periodic conditions were assumed at the outer boundaries of the domain.
Calculations were started at 904 K for a liquidus temperature equal to 904.41 K. Temperature evolution was modelled averaged over the calculation domain by the balance between heat extraction and latent heat release. The specific heat was set to 2.8 J.K-1.cm-3 for the liquid and 1.9 J.K-1.cm-3 for the (Mg) solid solution. A constant heat extraction rate of -30 J.cm-3 combined with a latent heat of 650 J.cm-3 resulted in an initial decrease in temperature followed by a distinct recalescence during about 4 seconds. Driving force for growth ∆g (J.cm-3.K-1) was extrapolated from a thermodynamic calculation performed for the initial composition based on Calphad data [19]:
T
0.842
{
T
T
(
w
0)
}
dT
g
d
g
liq liq−
⋅
=
∆
⋅
∆
=
∆
(1) where T [K] stands for temperature and the subscript "liq" for liquidus. The liquidus temperature Tliq is expressed as:
(
)
=
liq(
0)
+
liq⋅
(
l−
0)
=
904
.
407
−
5
.
215
⋅
(
l−
3
.
0
)
lliq
w
T
w
m
w
w
w
T
(2)where w0 and wl are the nominal and liquid aluminium contents (wt.%), and mliq is the liquidus slope. Solute partitioning at the interfaces was extrapolated from the same thermodynamic calculation by:
(
3
.
0
)
626
.
17
215
.
5
819
.
0
)
(
0 0 ,−
−
−
+
=
−
+
=
l l sol liq s sw
w
w
m
m
w
w
(3)where ws and ws,0 stand for solute content in the solid in equilibrium with liquid at, respectively, wl and the nominal content w0. The partition coefficient between (Mg) and liquid is equal to 0.273 at the time of nucleation and increases slightly during solidification. Diffusion of Al was simulated with a constant coefficient in the liquid (10-5 cm2.s-1) and temperature dependent in the solid phase (Dso=12 cm2.s-1 and Qs=144000 J.mol-1) giving a diffusion coefficient of 5.6 10-8 cm2.s-1 at the liquidus temperature. In order to have a significant change in solute concentration within the final images, all simulations were stopped after a solidification time of 14 s, the solid fraction being about 0.7. The Al concentration fields were then written out to generate images.
Figure 1a shows the composition map for one grain and figure 1b the composition profile along the line A-B in figure 1a. When a nucleus has formed at the given undercooling, it grows with solute
the average grain size (400 µm) for both the RM and ES images. It is seen that σgrid decreases rapidly for ∆L/D varying from 0.1 to 0.25, and then presents oscillations which level off slowly as the grid spacing increases, i.e. as the "measurements" get less and less correlated. At that stage, i.e. when ∆L/D is higher than 1.5-2, the curves have more or less reached the expected random value σ0=0.22. Although the differences between ES and RM curves are not pronounced, they confirm the spatial correlations that can exist between grid spacing and microstructure size [13, 14]. In order to avoid bias due to such correlations, the grid spacing to be used should be at least twice as large as the grain size.
0 0.05 0.1 0.15 0.2 0.25 0.3 0.35 0.4 0 0.5 1 1.5 2 2.5 equal-size ES random RM S ta b d a rd d e v ia ti o n ( % ) ∆L/D
Figure 5. Evolution with grid spacing of the standard deviation of the average aluminium content
estimated from 1000 grids of 100 points each.
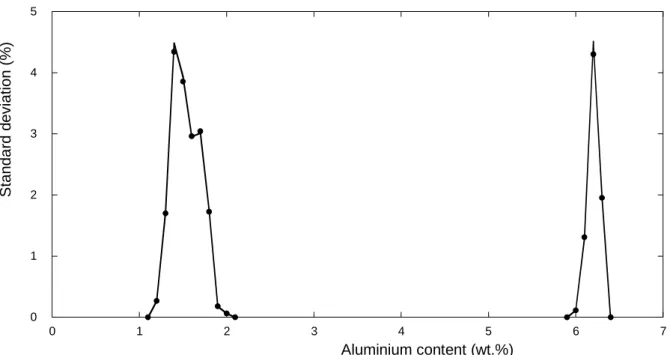
In a second step, it appeared of interest to characterize the standard deviation for each class of solute values. Figure 6 presents the standard deviation of the number of pixel values in each class (dots) evaluated again from 1000 grids of 100 points each obtained with a grid size equal to 800 µm. It is seen that its average value for each peak is of the same order as the standard deviation for the estimate of the phase fraction VV, either solid or liquid, namely VV.(1-VV).N-2, giving 4.6% for a grid of N=100 points.
The same calculation was applied to each of the solute classes using the distribution values in figure 4a. This results in the estimates of the standard deviation shown with dots in figure 6. Such a procedure, which is exactly that suggested by Gungor [10] is seen to reproduce fairly well the standard deviation calculated by resampling.
Finally, it is worth recalling that it has been noted previously that the observed scattering in the data associated with each solute class has little effect on the cumulative distribution estimated for either the primary or liquid phase [14]. In other words, the cumulative distribution in the primary phase may be fairly well established by recording as low as 100 values along a grid with an appropriate step size. The, most of the variance in the estimate of the average solute content is related to the variance in the estimate of the liquid (or solid) fraction.
0 1 2 3 4 5 0 1 2 3 4 5 6 7 S ta n d a rd d e v ia ti o n ( % ) Aluminium content (wt.%)
Figure 6. Standard deviation of the number of values in each solute class estimated from 1000
grids of 100 points each (solid line). Dots are the standard deviation using the distribution in figure 4a and assuming fully random distribution.
4. Discussion - conclusion
Using resampling, it has been shown that analysis along regular grids gives better results than random sampling according to the variance estimate of the measurements [13,15]. However, the variance depends on the grid spacing, and Gungor [10] was the first to stress the need to use a large grid spacing, preferably much larger than the size of the grains. Such a condition relates to the need for measurements to be independent from each other on a statistical point of view. In particular, any microstructure space periodicity may induce correlation in the measurement that could strongly bias the results. This has been discussed previously [13] and it was found that such correlations are sufficiently smoothed out when the grid spacing is 2-3 times the grain size as illustrated again in figure 5. In practice, a rough estimation of grain size or grain density can easily be obtained by quantitative optical or electron-scanning image analysis.
The classical tools for statistical analysis can be then used when measurement points are uncorrelated. For instance, the variance of estimation of the volume fraction VV of a “phase” (liquid or eutectic areas, or regions within a given composition class) is obtained as VV.(1- VV).N-2, where N is again the total number of measurement points. Applied to the present work where VV=30%, the estimate of the liquid (eutectic) fraction from a grid of 100 points could vary in between 21 and 39 % at a 95% confidence level. For the same conditions, the estimate of the average solute content may vary in between 2.56 and 3.44 wt.% when the true value is 3 wt.%. These ranges of possible variation due to statistics appear quite large and much more measurements would be needed for accurate evaluation of such integral quantities.
In contradistinction, the results presented above show it is quite feasible to estimate solute distribution in dendritic alloys by means of a limited number of local composition measurements, typically 100 measurement points, in agreement with previous works [11, 15]. This is certainly due to compensating effects between countings made on neighbour solute classes. However, physical noise is present in real microanalysis, that can be simulated by adding a noise following a normal distribution to each composition value picked up from the image [14]. As expected, this noise also exacerbates the
negative curvature of the curve at low aluminium content that is already present in the original curve as a result of the size distribution of secondary and tertiary arms [6].
2-D cuts of real structures or of 3-D simulations should certainly lead to some slight increase of the variance, for both the average solute content and solute distribution [20]. However, these effects are not expected to change significantly the conclusions of this work as the unit cells for chemical heterogeneities will remain the grains.
A last note should be made which is that, whatever the sorting method used, the present results show that cumulative distributions could at best indicate the solute segregation behavior, i.e. positive or negative segregation, but should definitely not be used for estimating partition coefficients.
References
[1] Lacaze J and Lesoult G 1991 Proc. Nature and Properties of Semi-Solid Material (San Diego) (Warrendale, USA: TMS) p 105
[2] Feest E A 1983 Proc. Solididfication technology in the foundry and casthouse (London: The Institute of Metals) p 188.
[3] Siredey N and Lacaze J 1992 Le Vide, les Couches Minces suppl. 261 149
[4] Mirkovic D and Schmid-Fetzer R 2010 Proc. Int. Conf. Magnesium alloys and their
applications (Weimar) (Weinheim, Germany: Wiley-VCH) p 1231
[5] Lacaze J and Lesoult G 1993 Materials Science and Engineering A173 119 [6] Lacaze J and Lesoult G 1995 ISIJ International 35 658
[7] Yan X, Chen S, Xie F and Chang Y A 2002 Acta materialia 50 2199
[8] Grosdidier T, Hazotte A and Simon A 1990 Proc. Euromat'89 (Oberursel, Germany: DGM Informationgesellschaft mbH) p 395
[9] Hermann W, Lacaze J and Oquab D 2003 Advanced Engineering Materials 5 32 [10] Gungor M N 1989 Metall. Trans. A 20A 2529
[11] Yang W, Chen W, Chang K M, Mannan S and DeBarbadillo J 2000 Metall. Mater. Trans. A
31A 2569
[12] Hazotte A, Lecomte J S and Lacaze J 2005 Mater. Sci. Eng. A 413-414 223. [13] Hazotte A and Lacaze J 2007 Trans. Indian Inst. Met. 60 267
[14] Hazotte A, Eiken J and Lacaze J 2010 Proc. Int. Conf. Magnesium alloys and their applications
(Weimar) (Weinheim, Germany: Wiley-VCH) p 398
[15] Zollinger J and Daloz D 2011 Materials Characterization 62 1058 [16] www.micress.de
[17] Eiken J, Boettger B and Steinbach I 2006 Physical review E 73 066122 [18] Eiken J 2010 Int. J. Mater. Res. 4 503
[19] Schmid-Fetzer R, Janz A, Gröbner J and Ohno M 2005 Advanced Engineering Materials 7 1142 [20] Lacaze J, Benigni P and Howe A 2003 Advanced Engineering Materials 5 37