HAL Id: halshs-00224987
https://halshs.archives-ouvertes.fr/halshs-00224987
Submitted on 30 Jan 2008HAL is a multi-disciplinary open access archive for the deposit and dissemination of sci-entific research documents, whether they are pub-lished or not. The documents may come from teaching and research institutions in France or abroad, or from public or private research centers.
L’archive ouverte pluridisciplinaire HAL, est destinée au dépôt et à la diffusion de documents scientifiques de niveau recherche, publiés ou non, émanant des établissements d’enseignement et de recherche français ou étrangers, des laboratoires publics ou privés.
Southern France: a model integrating individual
decisions and spatial constraints
Christina Aschan-Leygonie, Hélène Mathian, Lena Sanders, Kalle Mäkilä
To cite this version:
Christina Aschan-Leygonie, Hélène Mathian, Lena Sanders, Kalle Mäkilä. A spatial microsimulation of population dynamics in Southern France: a model integrating individual decisions and spatial constraints. Ballot G., Weisbuch G. Applications of Simulation to Social Sciences, Hermes, pp.109-125, 2000. �halshs-00224987�
A spatial microsimulation of population
dynamics in Southern France: a model
integrating individual decisions and spatial
constraints
C.Aschan-Leygonie*, H.Mathian*, L.Sanders*, K.Mäkilä**
*UMR-Géographie-cités (P.A.R.I.S)., CNRS-Universités Paris I et Paris 7-ENS 13, rue du fourF-75006 Paris
aschan, mathian, [email protected]
**University of Umeå
Department of Social and Economic Geography SE-901 87 Umeå
ABSTRACT: The aim is to model the spatial distribution of the population dynamics in Southern France. First the philosophical differences between a micro-level approach and a meso-level approach are presented and their respective advantages are briefly compared from a general point of view. Then the model is presented. It is a microsimulation model but it has some rules defined at the aggregate level of the communes. Change occur through events as birth, death and migration, that depend on probabilities that are linked to different individuals characteristics as sex, age etc. Four scenarios of development are tested and some future improvements are proposed.
RESUME: L'objectif est de modéliser la distribution spatiale de la dynamique de population dans les départements du Gard et de l'Hérault. Après une discussion préliminaire sur les questions d'échelle de la modélisation, un modèle de microsimulation intégrant à la fois des règles définies au niveau des individus et des agrégats spatiaux est présenté. Le moteur du changement est déterminé par des événements tels que les naissances, les décès, les migrations dont les probabilités sont tabulées par rapport à des caractéristiques individuelles (sexe, âge,…). Quatre scénarios d'évolution sont testés, et enfin des prolongements sont proposés.
KEY-WORDS: dynamic modelling – microsimulation – settlement system – spatial analysis MOTS-CLES: modélisation dynamique - microsimulation - système de peuplement - analyse spatiale.
1. Introduction
This presentation focuses on the application of a microsimulation model to the dynamics of the population in a region in Southern France. The purpose is both theoretical and methodological. From a theoretical point of view the aim is to discuss at what level to formalise a model of population dynamics. From a thematic point of view, the question is to get a better understanding of the spatial re-distribution of the population in a region with a population increase and to test the effects in the future of different scenarios on this redistribution.
The region of Languedoc-Roussillon belongs to the more attractive in France if one considers the importance of in-migration [BRU 94]. The main purpose here is not to propose an estimation of the population in the coming years, but to focus on where the new inhabitants will settle and how the existing population is likely to re-distribute through space in coming decades. The main purpose is then to simulate the spatial redistribution of the population between the communes1 in the region according to different scenarios of regional development. The results of the model are given at a meso-level, but the core of the modelling could be defined either at the level of the individuals, or at the level of the communes. In the first case one focuses on the determinants of individuals preferences and choices [CLA 87], [CLA 96], [HOL 2000] in the second on the factors that define the communes’ attractivity, that is the result of a collective behaviour [ALL 97]. Each level makes sense and the choice of one approach or the other depends mostly on the philosophical perspective of the modeller [SAN 99].
2. Basic principles of the MICDYN model
In the microsimulation approach, the hypothesis is that the diversity and the interdependency of individual decisions are of such an importance that they must be taken into account in order to simulate the change at an upper aggregate level. It is therefore necessary to reproduce the individual biographies and to simulate the series of events that might lead to spatial changes. The determinant variables are age, sex, family composition, education and activity, and the changes are modelled through ageing, transition probabilities, and logical rules. The passage to the meso-level is then done by simple counting. A complete description of a microsimulation model can be found in [VEN 99]. In the case of a spatial aggregated approach one defines the mechanisms of change directly at the level of the communes. The decision process of the individuals is then ignored and replaced by simplifying hypotheses as inter-individual homogeneity at the commune level and the independence of the individuals’ decisions [HAA 89], [PUM 89], [SAN 92]. The idea is that there are regularities at the level of the communes’ dynamics that refer to the relative position and to the relative attractivity of the communes in a spatial
1
French communes are small, around 12 km² in average, therefor they allow the observation of the spatial dynamics on a very fine level.
A spatial microsimulation of population dynamics 3
system of interactions [PUM 98]. Determinant variables are the social and demographic profile of each commune, the different types of amenities that are present and its spatial properties (accessibility, position in a network, property of the neighbourhood, distance to structuring poles etc.).
Of course there is a strong interdependency between these two levels of functioning. The results of a set of individual decisions can modify existing spatial patterns and structures within the region, and in return the spatial structures play an important role in the individual behaviours. In this experiment we are both interested in observing structures on the macro-geographical level emerging from individual behaviours and in identifying the meso-level rules which act as constraints on the individual’s choices.
2.1.The individuals behaviour: based on an event logic2
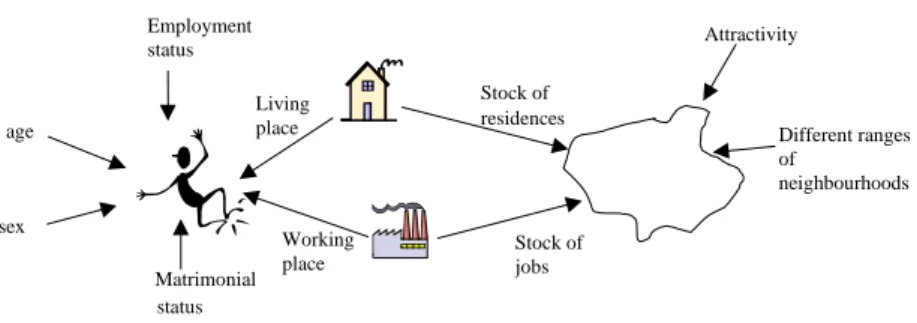
The model, called MICDYN, has been built up starting from a core which has been elaborated in order to model the dynamics of the Swedish population [VEN 99]. This core is essentially based on demographic events and the principal parameters refer to probabilities of birth, death, migration according to the characteristics of the individuals. This core has then been progressively adapted and completed in order to fit the French context. Two kinds of objects are handled in the model. On the one hand individuals with their personal attributes, their location and the location of their workplace. On the other hand the communes whose attributes are stocks (population, housing, workplaces) and the characteristics of neighbourhoods of different ranges (figure 1). At each time-step the stocks are actualised at the level of the communes, summarising all changes at the individuals’ level.
Each individual has a certain probability to face events as birth, death, getting married, losing job, etc. but the probability is much higher in some situations. Some of these events induce a migration and contribute to the changes in the spatial pattern of the regional population. Indeed, the tendency to move varies according to the stage in the life cycle of the potential migrants. The individual mobility increases highly between the age of 18 and 30, and is naturally due to migration linked to employment seeking or to the choice of studying at the university or in colleges. Table 1 gives an individual’s potentials of moving according to its attributes, and table 2 summarises which events might result in a decision to migrate in the model.
It should be noted that an intention to move does not necessarily result in a migration, as it depends on the opportunities offered to the concerned person or family. Indeed, in a microsimulation model there are processes at three levels. The first level concerns the intentions to do something, the second level concerns the search procedures and the corresponding opportunities, that makes possible
2
The model that is presented has been developed in the framework of ARCHAEOMEDES II, directed by Sander van der Leeuw. It is an European project that has been subsided by the DG12. The model has been developed through a collaboration with Einar Holm and Urban Lindgren from the University of Umeå and Denis Gautier from INRA.
something which is wanted. Finally there are the actual changes that only constitute a fraction of the initial intentions.
Figure1: The elements (objects and attributes) of the MICDYN model.
The level of individuals The level of the communes
age sex Matrimonial status Employment status Living place Working place Stock of residences Stock of jobs Different ranges of neighbourhoods Attractivity
Table 1: A simplified representation of an individuals’ potential of moving according to its personal attributes.
Combination of attributes causing changes Associated random Potential Attributes Value Other attribute
involved
events change of residence
Age 15-31 years Housing situation
- Employment status
Matrimonial status
Leave their parents Start high education
Get a job Get a partner Death High High High High Low
Sex female Age Give birth Low
Matrimonial status Single Married Married Age - - Get a partner Separation Widower/hood High High Low Employment status Unemployed Employed Employed Age - Age Get a job Lose the job
Retirement
High Low Low
Very schematically, the model functions as following: the destination of the individuals that decide to move is determined by housing vacancies in the communes and job vacancies in the hinterland of the communes. To start with potential movers look for a new place of residence and if one is found - there must in general be a job vacancy in the right occupation within an acceptable commuting distance. The search is limited to a "spatial context". This context always includes
A spatial microsimulation of population dynamics 5
the nearest neighbours, the nearest of the two metropoles in the area (Nîmes or Montpellier) and a set of “local labour market towns”. These are restricted by means of a maximum distance, usually somewhat larger than the maximum acceptable commuting distance. We have assimilated this distance to 40 kilometres, as the radius of 40 km corresponds to the distance from work, within which 90 % of the active population in the Languedoc-Roussillon region live. It should be pointed out that there is also a small probability for individuals to move, even though the change of residence will lead to unemployment. This is justified by the existence of non labour market related migration. For a specific individual the model defines a sample of possible destinations. The communes are ranked according to the number of appropriate jobs: the more jobs the higher attraction. In this general framework, the relative proximity between the places thus plays a central role.
Table 2: Different events leading to the decision to move in the MICDYN model.
Causes of moving Type of event Need to find a job Need to find a dwelling
Household change Leaving parents Finding a partner Separation Death of partner Yes or No Yes or No No No Yes No Yes Yes or No Labour market related changes Immigrant Unemployed Leaving school Yes or No Yes Yes Yes Yes or No Yes
No specific reason Yes Yes
According to the different contexts of the migration (as defined in table 1), it is possible to define various categories of people, that follow the general procedure after having taken the decision to try to migrate.
-A first category are those who have no job and no dwelling in the region. Indeed the system is open and immigrants will arrive from outside the region. They will have to be generated and given suitable attributes and combined into families.
-A second category are those that have no job, but that have a dwelling. In this group we find both young people living with their parents (students having finished their studies) and unemployed. To this category adds also 5 % of the active population that yearly loose their jobs in the model. These people will try to find a job every year in the surroundings of their residential commune. If they do not succeed, they will try to move in order to find a job somewhere else, and the same research procedure is run all over once a new dwelling has been found.
-A third group is formed by those who have a job and a dwelling, but who want to move anyway. People having found a partner, young people living with their parents and that have a job and finally the group that we might qualify as “free” people without particular constraints, i.e. the part of the population that wants to move for no economical or demographic reason (quality of life, family rapprochement…). The pensioners belong to this last subgroup.
In each time step of the microsimulation, i.e. every year, all the individuals are successively examined. According to its situation in terms of age, sex, matrimonial
status, and employment status, the occurrence or not of an event will be determined by random, using the associated parameters.
2.2. Introduction of some meso-level rules in the model
The calibration of the model is rather qualitative, based both on comparisons of the estimated values with the first results of the census of 1999, and using intuition for previsions at 2020. Simulations using only previously described classical rules of the microsimulation lead to an overpopulation in the centres of the bigger cities and in remote rural areas as well as an underestimation of the growth of the periurban areas. So in a second step two major meso-level rules have been introduced.
The first concerns the process of periurbanisation and the spatial diffusion of urban growth. The trend is particularly heavy in this region. In order to cope with this phenomena in the model, we have introduced a spatial rule that implements a diffusion of the population around urban communes that have reached a maximum threshold of population density. The diffusion concerns a limited set of communes near the central commune. Both the limit for the search of those communes and the density threshold are given as input parameters. Eventually the border communes also get crowded (there is one more parameter giving the threshold for the population density, usually a little lower than the threshold for the centre). When this second threshold has been passed, the search for potential growth communes will go further away from the central commune for the next year and so on. In future versions of this model it will be possible to refine the direction of the growth on the basis of information on land use, transport network and local housing policy rules in the concerned communes.
The second meso-level rule concerns the growth rates of workplaces. The evolution of the dwelling stocks is determined in most scenarios through mechanisms of adequacy between supply and demand and theoretically the same kind of endogeneous mechanism should work for the workplaces. A small feedback has effectively been introduced from population to jobs. The communes that have a significant population growth get proportional increase in jobs (corresponding to some elementary local service needed everywhere). But this mechanism of induction is not sufficient and the evolution of the workplaces is completed through a simple growth rate, applied at the level of the commune according to its size, smaller and even negative in some scenarios for smaller communes, higher for the more populated.
3. More or less sustainable futures: projections for 2020 3.1. An attractive region with spatial reorganisation
The region that we have chosen as a geographical setting for the microsimulation model is composed of the two eastern departments of the region of Languedoc-Roussillon (figure 23). Their evolutions are highly linked through a long history of
3
A spatial microsimulation of population dynamics 7 A spatial microsimulation of population dynamics 7
competition between their two chiefs-towns: Nîmes (Gard) and Montpellier (Hérault), with respectively about 130 000 and 200000 inhabitants. Montpellier represents today the major driving force in the regional population dynamics. The population growth is particularly spectacular around the two main urban poles, and along the coast.
The issues of this spreading out of the urban areas, are the resulting land use conflicts, on the one hand, with the main agricultural production that is the winegrowing and, on the other hand, with the tourism activities that are concentrated mainly on the coastline, as today this region is one of the foremost tourist areas in France. The weight of the different land uses, such as urbanisation, tourism and agriculture, and their pressure on the regional territory are different according to the type of biophysical environments. Therefor, it was important to distinguish four sub-regions in the model (figure 2b), according to natural characteristics that mark the population evolution, the capacity of resistance of the agriculture and the potentiality of tourism development.
Many questions arise concerning the future evolution of the spatial organisation within the region. In what way will the urbanisation continue and spread ? Which communes are likely to be the most affected ? To attempt to answer this kind of questions, different scenarios of regional development have been run.
3.2. The potential future spatial organisation as illustrated by 4 scenarios
In the basic scenario the parameters values reproduce as much as possible the same tendency as the one observed during the last ten years. In order to use the model in a comparative perspective, alternative scenarios have been developed. They deviate from the basic scenario and are highly differentiated from each other. Three of them are presented in this paper.
Table 3: A selection of model parameters that are common to all scenarios
Some model parameters Fixed values
Demographic
Adjustment factor for fertility rates 1.1
Adjustment factor for mortality rates 0.9
Migration
Proportion of immigrants that are female 0.47
Probability to try migration without labour market reasons 0.04
Probability to try a long distance random move when all others failed 0.55
Probability to migrate within the two departments 0.25
Employment
Probability to find a job after having lost one 0.49
Probability to lose a job 0.03
Level of the commune
Proportion of new born that are girls 0.49
Proportion of adults actively searching for a partner 0.35
Proportion of unemployed amongst those not working 0.31
A spatial microsimulation of population dynamics 9
Table 3 gives a selection of the parameters that are maintained through all the simulations presented here. The selection has been chosen in order to illustrate the diversity of the different fields taken into consideration in the model. The parameters are determined on the individual or the communal level.
At this stage of the modelling we have used the alternative scenarios for testing the effects of some exogenous changes. First we have varied the immigration level, as to observe the impacts of a greater number of immigrants on the spatial organisation of the population within the two departments. Secondly, the distribution of the growth rate of the workplaces has been modified. Indirectly these variations have generated a territorial redistribution of the growth of the dwelling stock, as it is automatically adjusted within the model according to the adequate level between supply and demand. The variation of the increase of the stock of working places is interesting in the sense that it is one major driving force of the mobility of the population and influences therefor directly the distribution of the population and the socio-professional profiles in the communes.
3.2.1.The basic scenario
In the basic scenario ( scenario 1) that is simply the prolongation of the recent demographic and mobility trends in the region, all parameters have been given their current values. The number of yearly immigrants corresponds to the observed values in the recent past and the different growth rates for working places are naturally simplified, but close to reality (table 4).
The model presents several types of outputs that are essential tools in order to evaluate the impacts of the parameter variations, both upon the statistical distributions and upon the spatial distributions. Firstly, the most obvious output are maps that visually summarise very well the results of the model:
- the distribution of the population at the end of each simulation (figure 3a); - the change of population between the beginning and the end of the simulation
(figure 3b).
The results of the simulation of this basic scenario are quite predictable as it simply prolongs the recent tendencies. Thus as the figures 2a and 3a show, there are no structural changes between 1990 and 2020, the only visible change is the general population increase. Indeed, the relative positions of the different communes have been kept during the whole period. There is however a reinforcement of the local tendencies, such as a relatively important growth and diffusion of the population around the urban centre of Montpellier and other larger towns such as Bézier, as well as a certain abandonment in the communes that were already declining between 1982 and 1990.
Another type of outputs illustrate the statistical distribution of attributes more generally summarised at the level of the commune. The population dynamics can be represented by the evolution of the quantities of population of different spatial or social categories. These representations reveal the fundamental spatial or social processes, that is homogenisation or differentiation. The mere description of the general tendency towards a decrease or an increase of the spatial and the social differences is an important step in the analysis (figure 4).
A spatial microsimulation of population dynamics 11
Another territorial division used in the model outputs is the sub-regions as described above (figure 2), in which Nîmes and Montpellier have been isolated. Figure 5 illustrates the territorial differenciations associated to the average commuting distance for the population within each geographical division. These model outputs are particularly interesting as they allow to focus on the importance of the interactions within the region. The scenario 1 shows, for example, that the average commuting distance for the population living in the Montpellier area is stable during the whole period of simulation. It is thus possible to assume that there is a strong autonomy within this area with rather strong and short distance interactions, compared to for example the mountainous area where the average distance of the commuters is sensibly growing. Clearly, at the end of the simulation the commuting active population living in this area often work outside the mountainous region. The very high increase of the average commuting distance in the mountainous region, as well as on the coast-line, expresses an increase of the urban attraction areas.
Figure 4:- Basic scenario : Evolution of the socio-economic categories in Hérault and Gard between 1990 and 2040.
0 50000 100000 150000 200000 250000 300000 199 0 1993199 6 1999 20022005 2008 2011201 4 2017202 0 2023 2026 20292032 20352038 Farmers
Craftsmen & Managers in small companies Civil Servants Proffs White Collar Blue Collar year num
ber of workers in categor
y
Intermediate professions
Figure 5 - Basic scenario : Evolution of the average commuting distance per sub-area 0 5 10 15 20 25 30 35 40 45 50 1990 1994 1998 2002 2006 2010 2014 2018 2022 2026 2030 2034 2038 Montpellier Montpellier area Nimes Nimes area the Beach the Inland the Mountains year in kilomet e rs the coastline
3.2.2. The alternative scenarios
We have chosen to test three alternative scenarios, that have been run from 1990 to 2020. They are based on a future settlement system that is more open to the outside as the yearly immigration is twice as high as in the basic scenario (table 4). Such an hypothesis is slightly exaggerated but this choice has been done in order to amplify the consequences of the parameter changes.
Table 4: Changes in the parameters in the different scenarios
Scenario 1
(basic)
Scenario 2 Scenario 3 Scenario 4
Emigration ratio (%) 0.5 0.5 0.4 0.1
Immigrant level (inh.) 20 000 40 000 40 000 40 000
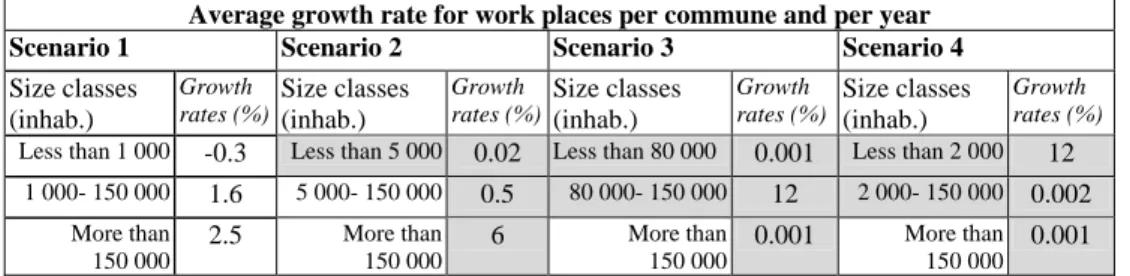
Average growth rate for work places per commune and per year
Scenario 1 Scenario 2 Scenario 3 Scenario 4
Size classes (inhab.) Growth rates (%) Size classes (inhab.) Growth rates (%) Size classes (inhab.) Growth rates (%) Size classes (inhab.) Growth rates (%)
Less than 1 000 -0.3 Less than 5 000 0.02 Less than 80 000 0.001 Less than 2 000 12
1 000- 150 000 1.6 5 000- 150 000 0.5 80 000- 150 000 12 2 000- 150 000 0.002 More than 150 000 2.5 More than 150 000 6 More than 150 000 0.001 More than 150 000 0.001
In the second scenario we have affected a very strong growth to workplaces within the urban centre of Montpellier. It corresponds to an hypothesis of economic dynamics concentrated to the city centre. Between 1982 and 1990 the observed annual average growth of jobs in this commune was 2.5%. What might happen if we increase this growth rate in a significant manner and simultaneously double the immigration in the two departments? This scenario will exaggerate the role of Montpellier as an employment pole in the region and its attraction on the migrants will significantly grow.
The third scenario creates an important amount of new jobs in Nîmes, contributing thus to the reinforcement of this second regional pole. After a long period of marginal situation and decline in relative terms, this city appears to renew its population and economical dynamics. What effect could be expected if the growth rate of workplaces is much higher than during the last census?
The fourth scenario is quite different as literally all the job increase has been allocated to the small rural communes. It corresponds to an hypothesis of attitude changes of the economic actors and expresses a tendency of loss of concentration of the economical activities.
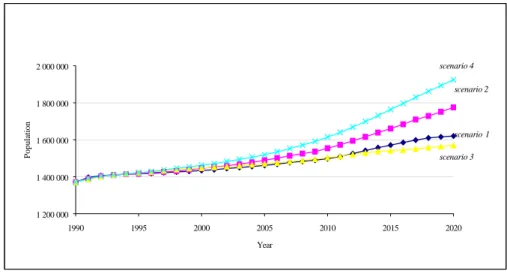
Naturally the choices of parameter values in those scenarios generate a strong population growth in the two departments. However, according to the different
A spatial microsimulation of population dynamics 13
scenarios this growth is variable as we can see in the figure 6. It is interesting to note that it is not the growth of Montpellier that generates the most important population increase, but the fourth scenario, that is based on a growth of the smallest rural communes (less than 2 000 inhabitants). The rural location of the new activities give a larger range of choices for the potential immigrants.
Figure 6: Population increase between 1990 and 2020 in Hérault and Gard according to four scenarios
1 200 000 1 400 000 1 600 000 1 800 000 2 000 000 1990 1995 2000 2005 2010 2015 2020 Year P opulation scenario 4 scenario 2 scenario 3 scenario 1
As shown in the maps representing the population distribution at the end of the three alternative scenarios (figures 7a,b,c), the changes in the workplaces within the region certainly have an influence on the respective rhythms of growth and spatial extension of the urban units, as well as on the « urbanisation » within the rural areas. The outputs of the second scenario show a remarkable growth in the surroundings of Montpellier, especially towards the south-west along the coastline. The urban diffusion is such that Montpellier shows a tendency to merge with Sète, a smaller urban centre 30 kilometres South-West. There is also a strong urban diffusion towards the North (figures 7a and 8a). This concentrated growth should be compared to a more even distribution of the population growth between the largest urban poles in the two departments that is the result of the scenario 1 (figure 3b).
In the third scenario, the growth of the Nîmes area is sensibly amplified. There is a notable difference in the spatial distribution of the relative population increase in this scenario compared to the second one (figure 8b). Clearly, the growth of Nîmes does not inhibit the growth of smaller communes in the mountainous areas. This evolution may be explained by the relatively low diversification of the economical activities around Nîmes. A large part of the immigrated population seems to have
been forced to move somewhere else as the labour market is too specialised around Nîmes.
The fourth scenario shows a totally different image of the distribution of the population in the region and of its relative growth (figure 8c). The general spatial structure is maintained, but there is a certain tendency to a geographical homogenisation in terms of population (figure 7c). Indeed, the smaller communes have grown in a significant manner and the larger communes have stagnated or even declined as it is the case for Montpellier, Nîmes and Béziers for example. However, in the surroundings of these urban centres the population has increased (figure 7c).
4. Future developments
The purpose of this modelling has been to study the evolutionary dynamics of settlement systems at a microscopic level of observation. The ambition was to obtain emerging spatial regularities from the individual behaviour, but the application of the model has shown that some meso_level rules are necessary in order to take into account the constraints the the spatial dimensions involve. The model has been able to reproduce correctly the decision to move as well as the approximate area of choice of living. But it fails in the choice of the commune itself. At that local level differences in attractivity between the communes and their surroundings plays a fundamental role. In an aggregated model such attractivities are classically defined according to general accessibility, amenities of different kinds, beauty of the site etc. In order to maintain the spirit of the microsimulation, such attractivities should be defined from the point of view of the individuals. For example, the presence of a school is attractive to families with younger children, whereas medical linked amenities are more attractive to retired people etc. The individual sensitivity to accessibility also varies. Therefor, the introduction of an indicator of attractivity defined at the aggregate level of the commune, but as a function of the individuals’ perception, would improve the model.
A spatial microsimulation of population dynamics 15 A spatial microsimulation of population dynamics 15
A spatial microsimulation of population dynamics 17
Bibliography
[ALL 97] ALLEN P., Cities and regions as self-organizing systems; models of complexity, Gordon
and Breach Science Publishers, 1997,275p.
[BRU 94] BRUNET R., 1994. Le Languedoc dans l'ensemble méditerranéen. C.R. Acad. Agric. Fr., 80, 9, 111-122
[CLA 87] CLARKE M., HOLM E., Microsimulations methods in spatial analysis and planning,
Geografiska Annaler, 69B, n°2, 1987,p145-164.
[CLA 96] CLARKE G. (ed.), Microsimulation in policy model and planning, London, Pion, 1996.
[HAA 89] HAAG G., Dynamic Decision Theory: Applications to urban and regional topics,
Kluwer Academic Publishers, 1989, 256p.
[HOL 99] HOLM E., LINDGREN U., MÄKILÄ, ASCHAN-LEYGONIE C., BAUDET-Michel S., MATHIAN
H., SANDERS L., GAUTIER, Micro-simulation of the population dynamics in a region with a strong urban growth, in A multiscalar investigation into the dynamics of land abandonment in Southern France, vol5, t1, 1999 (contract ENV4-CT95-0159, DGX11 of the European Commission)
[HOL 2000] HOLM E., LINDGREN U, MALMBERG G., Dynamic microsimulation, in Spatial Models
and GIS; New Potential and New Models, FOTHERINGHAM S. and WEGENER M. (eds), Gisdata 7, Taylor and Francis, p143-165
[PUM 89] PUMAIN D., SANDERS L., SAINT-JULIEN Th., Villes et auto-organisation, Paris, Economica, 191p.
[PUM 98] PUMAIN D., Urban Research and Complexity, in C. BERTUGLIA, G. BIANCHI, A. MELA
(eds.), The city and its science, Springer, Physical Verlag, Heidelberg, 1998, p323-361. [SAN 92] SANDERS L., Système de villes et synergétique, Paris, Anthropos, 274 p.
[SAN 99] SANDERS L., 1999, Modelling within a self-organising or a .microsimulation
framework: opposite or complementary approaches? CYBERGEO, No. 90.
[VEN 99] VENCATASAWMY C., HOLM E., REPHANN T., ESKO J., SWAN N., ÖHMAN M., ASTRÖM
M., ALFREDSSON E., HOLME K., SIIKAVAARA J., 1999, Building a spatial microsimulation