HAL Id: hal-03100462
https://hal.archives-ouvertes.fr/hal-03100462
Submitted on 7 Jan 2021HAL is a multi-disciplinary open access archive for the deposit and dissemination of sci-entific research documents, whether they are pub-lished or not. The documents may come from teaching and research institutions in France or abroad, or from public or private research centers.
L’archive ouverte pluridisciplinaire HAL, est destinée au dépôt et à la diffusion de documents scientifiques de niveau recherche, publiés ou non, émanant des établissements d’enseignement et de recherche français ou étrangers, des laboratoires publics ou privés.
A two-phase sequential approach to design bioenergy
supply chains under uncertainty and social concerns
Sobhan Razm, Alexandre Dolgui, Ramzi Hammami, Nadjib Brahimi, Stefan
Nickel, Hadi Sahebi
To cite this version:
Sobhan Razm, Alexandre Dolgui, Ramzi Hammami, Nadjib Brahimi, Stefan Nickel, et al.. A two-phase sequential approach to design bioenergy supply chains under uncertainty and social concerns. Comput-ers & Chemical Engineering, Elsevier, 2021, 145, pp.107131. �10.1016/j.compchemeng.2020.107131�. �hal-03100462�
1
A Two-Phase Sequential Approach to Design of Bioenergy Supply Chains
under Uncertainty and Social Concerns
Sobhan Razm
PhD candidate of IMT Atlantique, France
[email protected]
IMT Atlantique, LS2N-CNRS, La Chantrerie, 4, rue Alfred Kastler, 44307 Nantes, France
Alexandre Dolgui
Full Professor,
FranceHead of the Department of Automation, Production and Computer Sciences (DAPI), IMT Atlantique IMT Atlantique, LS2N-CNRS, La Chantrerie, 4, rue Alfred Kastler, 44307 Nantes, France
[email protected] (corresponding author)
Ramzi Hamammi
Full Professor,
FranceDepartment of Supply Chain Management and Information Systems, Rennes School of Business Director of the Area of Excellence on Green, Digital and Demand-Driven Supply Chain Management
Rennes School of Business, 2 Rue Robert d'Arbrissel, 35065 Rennes, France
[email protected]
Nadjib Brahimi
Associate Professor, department of supply chain management, Rennes School of Business, France Director of MSc Data and Business Analytics
Rennes School of Business, 2 Rue Robert d'Arbrissel, 35065 Rennes, France
[email protected]
Stefan Nickel
Full Professor, Germany
Chair in Discrete Optimization and Logistics, Karlsruhe Institute of Technology (KIT),
Director at Forschungszentrum Informatik (FZI), KIT,
Director at Karlsruhe Service Institute (KSRI), KIT.
[email protected]
Hadi Sahebi
Assistant Professor of Industrial Engineering at Iran University of Science and Technology, Iran
[email protected]
2 Abstract:
The use of renewable energies has become very attractive, because it protects the environment and boosts regional development. In this paper, a sustainable two-phase sequential approach is proposed for the design of bioenergy SCs under uncertainties. The first phase, integrating geographical information, social aspects, and multi-criteria decision-making techniques, helps find appropriate locations for the bio-refineries. High rates of unemployment, and high vulnerability to the variation in the markets in an economic crisis are considered as social concerns. Integrating these factors filters the areas for the second phase. The first phase reduces complexity in the computation of the problem, and helps set up sustainable development in the supply chain. In the second phase, to cope withthe uncertainties in the bioenergy supply network, a robust model is introduced. It reduces the sensitivity to inaccurate input data, and the obtained solutions stay optimal when the parameters change slightly. In order to validate this two-phase sequential approach, a case study is investigated. The results of tests show that integrating the concepts of uncertainties and sustainability with geographical information of the area in a two-phase sequential approach outperforms the traditional models, and leads to the creation of 262 jobs. The jobs have a high impact on the surrounding area. Keywords
:
Sustainable development; Bioenergy supply chains; Biomass; Uncertainty; Geographical information; Social sustainability.1. Introduction
The increase in greenhouse gas (GHG) emissions has led to an abnormal increase of the earth’s temperature, to climate changes, and, subsequently, to an increase in natural disasters. The photographs sent by emission measurement satellites have shown increasing greenhouse gas emissions and have provoked considerable concern. It caused the representatives of more than 100 countries participating in the 2015 United Nations Climate Change Conference in Paris to sign the Paris Agreement with the aim of reducing these emissions. The concerns were related to energy demand, and theenvironmental, economic, and social problems generated by using fossil fuels. These issues have led researchers to develop sources of renewable energy, which can augment regional development and protect the environment while still meeting the energy demand. Sources of renewable energy, bioenergy (heat and electricity) and biofuel (bioethanol, bio-oil, biodiesel, pellets) can be obtained from biomass in various ways. These renewable sources of energy can be used as substitutes for fossil fuels. Bioenergy and biofuel can decrease greenhouse gas (GHG) emissions [1] and create new jobs and more vitality in the areas concerned [2, 3]. One source of biomass is the feedstocks made from agricultural and forest residues. Forest residues contain: a) sawmill wastes: shavings, sawdust, hog fuel, chips; b) branches, leaves, tree tops, non-merchantable stems emanating from forest operations [4]. The agricultural residues contain wheat straw, sugarcane bagasse, corn stover, etc., which are not used as food, and originate from the wastes made from agriculture [5, 6]. Bioenergy, biofuel, and other bio-based products (chemicals, plastics, etc.) are the direct resultof converting these residues through biochemical, chemical, and thermochemical basic processes [7-9]. The methods used to convert the forest/agricultural biomass into bioenergy/biofuel are thermochemical (combustion, pyrolysis, and gasification) and biochemical (producing ethanol through hydrolysis and fermentation) [8, 10].
In recent years, the importance of the design, implementation, and management of bioenergy SC has increased. One of the significant obstacles to development of a bioenergy supply chain is the cost of
3
the bioenergy supply network. For instance, high costs could be incurredby supplying biomass to the biorefinery due to the economic and environmental implications of gathering and transporting biomass feedstock from the biomass supply site. The location of the biorefinery is fundamental in terms of reducing costs and GHG emissions (e.g. due to transportation). The location of the biorefinery is also important, because it can generate new jobs and sustainable development in the surrounding area [11].
When a wide geographic area is considered for planning, identifying the candidate locations of bio-refineries is a complex process requiring accurate assessments on the ground, so geographic information of the area is important. These locations should suit the possible environmental, economic and social interactions of the area. They should also have access to the biomass, resources and power required for the conversion technologies throughout the year [14, 15]. There is also a need to consider the uncertainties related to biomass availability, demand, transportation, operation, and costs in the design of the bioenergy SC. Uncertainties could make the design of the SC unfeasible, or render its performance suboptimal [12, 13]. Accordingly, it is important to integrate the concepts of sustainability and uncertainties as well as geographical information about the area into the planning and design of the bioenergy SC. Thus, the specific questions this study is seeking to answer are as follows:
Which location strategy could be applied in order to design a bioenergy supply chain network in a large geographic area?
What procedure could be adopted in order to achieve sustainable development in the supply network?
Which approach could be followed in order to improve the stability of the bioenergy supply network under uncertain conditions?
In this paper, a sustainable two-phase sequential approach is proposed in order to design bioenergy SCs under uncertainties. The first phase tries to find the appropriate locations for the bio-refineries by integrating the geographic information system, the social aspects, and the multi-criteria decision-making techniques. In this phase, high rates of unemployment, and the high vulnerability of the areas to variations in the markets in an economic crisis, are considered as social concerns. Integrating these factors (the geographic information system, and the social sustainability) by using the multi-criteria decision-making techniques filters the areas to obtain appropriate locations as input for the second phase. The first phase augments the practicality of the supply network design, reduces complexity in the computation of the problem, and helps set up sustainable development. In the second phase, in order to cope with the uncertainties in the bioenergy supply network, a robust model is introduced to reduce the sensitivity to inaccurate input data. It means that the obtained optimal solutions are still optimal when the parameters changeslightly.
In the remainder of this paper, a review of bioenergy supply chain network design is given in Section 2. The integrated two-phase approach is explained in Section 3. Section 4 formulates the deterministic and robust models of this approach. A case study is described in Section 5. Evaluation of the performance of the proposed method is presented in Section 6. Section 7 concludes and makes suggestions for future research.
4
2. Literature review
Modeling and optimization of bioenergy supply chains (SCs) have been attracting a great deal of attention from researchers recently. In bioenergy SC literature, from one point of view, many models only considered the economic aspect of the SC when designing the network. For instance, in the studies based on a bioenergy SC with agricultural and forest (AF) biomass, some researchers focused on geographical dispersion to find the sources and supply capacities [16-18]. Others worked on decisions related to the locations of bio-refinery and production capacity [19], and another group concentrated on the design of the supply chain (network) that generates biofuel from various types of AF biomass [4, 20, 21].
Bairamzadeh et al. [22] investigated the strategic and tactical decision levels of the biofuel supply chain based on AF biomass. The authors considered agricultural residues such as corn stover, wheat straw, barley straw and rice straw as feedstock biomass and proposed an MILP model to minimize the total cost of the SC by selecting the capacity, location, and technology of the biorefineries, as well as the amounts of production, inventory, allocation, and transportation. A hybrid robust optimization approach was suggested to cope with the uncertainties. Santibañez-Aguilar et al. [23] proposed an approach for optimal planning of the biomass residues obtained from crops such as sugar cane, corn, agave, palay rice in a processing system. The authors suggested a mathematical programming model involving mass balances to achieve the interconnections among different nodes of the supply chain. They considered constraints for the technologies in terms of capital investment and cost of production. The objective was to maximize the annual profit obtained from the revenue of selling products, minus the transportation cost, manufacturing cost, and raw material cost. They did not consider the related uncertainties in the model that may lead to a design for the SC network which is not feasible. Mohseni et al. [24] developed a mixed-integer linear programming model (MILP) model to minimize the total cost of the biodiesel supply chain. The study focused on third-generation biofuel, so the proposed mathematical model and approach are specific to a microalgae biomass supply chain. These studies only considered economic aspects of the supply chain, and social concerns or the concepts of sustainability related to the microalgae-based biodiesel SC were not investigated. In terms of sustainable development, in [25] the authors proposed an MILP model to design a sustainable bioenergy supply chain network for switchgrass-based biomass. The model included economic, environmental and social objectives and aimed to find the maximum capacity in the biomass centers, the location and capacity of the power plants, and the amount of the collected and stored switchgrass. The authors used a hybrid method involving augmented ε-constraint and TOPSIS approach to consider preferences of decision-makers. The study did not consider any uncertainty. According to [26], designing a new biofuel supply chain can create jobs for localpeople in the area and protect the environment [2]. However, in the bioenergy supply chain literature, most of the studies just considered economic aspects of the supply chain, and less attention was given to the sustainability of the bioenergy SC, especially social aspects. Nevertheless, it is crucial to consider sustainability when designing bioenergy supply chains. Thus, there is a gap in the literature and a need to take into account, at the design stage, sustainability aspects, alongside economic effects [27]. Considering social criteria, in the article [26], the authors designed a bioethanol supply chain network using corn stover and wheat straw (lignocellusic biomass). They considered job opportunities as a social objective in a multi-objective MILP model to determine the location and capacity level of the facilities used in the biorefineries, inventory levels, and material flows. There are other studies in the literature which
5
considered social aspects [28, 29]. Bijarchiyan and Sahebi [29] used the Guidelines for the Social Life Cycle Assessment of a Product (GSLCAP) method to find the social impact of a bioenergy supply chain network, and Carter and Rogers [28] introduced job creation as a social objective.
In terms of uncertainty, stochastic programming (two-stage) has been used in a large number of models. For example, a stochastic MILP model to design a biofuel SC under uncertainties of product price and cost of the feedstocks was proposed in [30]. The authors considered the net present value and the conditional value at risk as two objective functions in their model. A stochastic programming model under price and demand uncertainties which were solved by simulation and a Benders decomposition algorithm was proposed in [12] for the planning of a biofuel SC. A bioethanol SC considering demand as uncertainty was modeled by a stochastic MILP and solved with two-stage method in [31]. The sample average approximation method was used in that study in order to provide a set of configurations for facing uncertainty. Chen and Fan [32] presented a stochastic programming (two stage) model for resource allocation and strategic planning of a biofuel SC under uncertainty related to demand and supply. The authors solved it by using a decomposition algorithm based on Lagrange relaxation. In order to maximize the profit and decrease the carbon emissions with price, demand and supply uncertainties in a bioethanol supply chain, a two-stage stochastic MILP was proposed in [33].
When a large geographic area is considered for a bioenergy SC network, identifying the locations where the bio-refineries may be installed is very important, because the network structure, costs, social performance, and environment are affected by these decisions. The methods used in the existing publications are not always clearly out. For instance, some researchers considered sets of locations which were as large as possible, covering most of the desired territory, to obtain more opportunities. Some others considered a continuous territory in their facility location models by assuming that the facilities could be placed anywhere [17]. These methods present some problems such as: 1) they cannot guarantee that optimal places are chosen in the whole of the desired territory, 2) those that considered continuous territory in their facility location models [17] usually restricted their models to a limited number of levels and parts, 3) also when the planning space increases, not only the computational complexity is significantly increased, but functionality is also severely limited [34]. What is why, the conventional agricultural and forest (AF) biomass SC models [19, 35, 36] usually focused on limited and predetermined candidate locations. In this case, simultaneously considering geographical information and social sustainability of the wide geographical territory is very important to select such candidate locations. Nevertheless, the existing models usually did not take them into account. By embracing the Geographic Information System (GIS) and the sustainability, and by using the multi-criteria decision-making techniques it is possible to consider more map layers in order to determine more appropriate places for bio-refineries. Moreover, if the bioenergy SC decisions do not take uncertainties sufficiently into account, the design model will not be trustworthy nor feasible. These are the factors which motivate this paper versus the state of the art.
Table 1 shows the outcomes of the literature review concerning the bioenergy SC problem. It shows that there is an essential research gap to optimize bioenergy supply chains by considering a two-phase sequential approach containing the geographical information, sustainability, multi-criteria decision-making techniques and uncertainty conditions. This study makes an effort to fill this gap.
6
Consequently, this paper includes the following contributions: 1) it develops a model for designing and planning the agricultural/forest residues-to-bioenergy supply chains; 2) it proposes a two-phase approach to solve the introduced SC model; 3) it integrates geographical information, social sustainability, and the multi-criteria decision-making techniques to find appropriate locations for bio-refineries; 4) it uses robust optimization to hedge against uncertainty; and 5) it validates the developed two-phase approach by applying it to a case study.
3. Problem definition
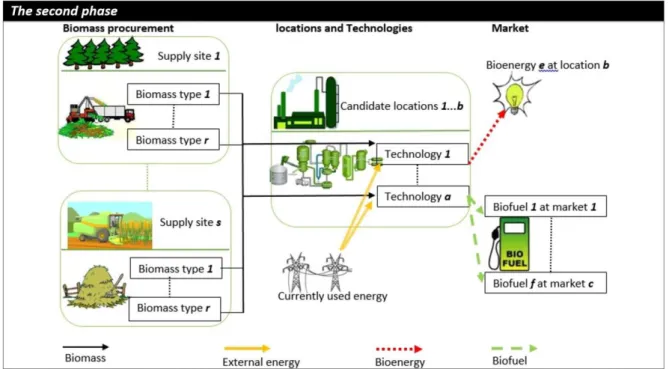
The bioenergy SC of AF residues is a complex multi-phase supply network that starts with the supply of raw materials (biomass) for bio-refineries and finishes with the market end-products. In such a network, the bio raw materials contain non-merchantable AF residues usually collected from piles left at the roadsides of the harvesting blocks and from plants that produce AF products. Next, these raw materials are sent to bio-refineries installed as independent units or set up near plants that produce AF products. Proximity reduces biomass transport/management costs [14]. In this paper, it is considered that bio-refineries can also act as suppliers of renewable energy for AF plants. Different biochemical, chemical, and thermochemical processes can change the biomass into biofuel, pellets, heat, electricity, etc. The biomass type and the features of the desired products determine type of technology [8]. The bioenergy produced (electricity/heat) is either used in the bio-refinery or sold to local heat grids/system. The biofuel products are sent to various markets.
Figure 1 shows the studied structure of the SC that obtains bioenergy from agricultural and forest residues. In this figure, S is the biomass supply site, R represents the various types of AF biomass, and B are the candidate locations for bio-refineries. Conversion technology A can be used at any candidate location and these technologies produce the following products: 1) bioenergy E for local use such as supplying power for the biofuel conversion technologies, forest product plants, electricity grids, etc.; and 2) different product types of biofuel F which are traded in market C. If it is economical, the heat and electricity needed for conversion technologies can be obtained from the currently used energy.
7
Table 1: This study vs. the bio-energy supply chain literature
Article Approach (Modeling) G eo grap h ic al i n fo rmati o n O b je cti ve fun cti o n Decisions (Strategic) Decisions (Tactical) So ci al s u stai n ab ili ty MCD M te ch n iq u es Uncertain parameters Uncertainty modelling approach Final products Mathematical Programming So u rcin g Facilities Bio mass all o cati o n Bio fu el p ro d u cti o n Tran sp o rt ati o n In ve n to ry p la n n in g Bio mass s u p p ly De man d o f pr o d u ct s Price o f pr o d u cts Co sts El ec tr ic ity Pel le t H eat Bio fu el ( b io eth an o l, b io -o il, b io d ie se l) Mo MIL P MIL P MIN LP Lo cati o n Cap ac ity Te ch n o lo gy (Dal-Mas et al., 2011) X X 3,4 X X X X X X X Scenario-based stochastic programming X (Gonela et al., 2015) X 2 X X X X X X X X X X X Scenario-based stochastic
programming
X
(Kostin et al., 2012) X 3,4 X X X X X X X X Two-stage stochastic
programming X (Saghaei et al., 2020) X 1 X X X X X X X Two-stage stochastic programming X (Balaman and Selim,
2015)
X 2-7 X X X X X X X X Fuzzy multi-objective
modeling approach
X (Awudu and Zhang,
2013) X 2 X X X X X X Stochastic programming X (Santibañez-Aguilar et al., 2019) X X 2 X X X X X X X X X - X X X (Mohseni et al., 2016)
X X 1 X X X X X X X X X X X Robust convex Programming
(Bertsimas & sim’s approach)
X (Chen and Fan,
2012)
X X 1 X X X X X X X Two-stage stochastic
programming
X
(Marvin et al., 2012) X X 3 X X X X X X X Sensitivity analysis X
(Razm et al., 2019b) X 3 X X X X X X X X Two-stage stochastic
programming
X X X X
(Osmani and Zhang, 2013)
X 2 X X X X X X X X X Two-stage stochastic
programming
X
(Khishtandar, 2019) X 1 X X X Fuzzy chance-constrained
programming
X
Proposed model X X 1 X X X X X X X X X X X X X Robust convex Programming
(Bertsimas & sim’s approach)
8
Figure 1: Configuration of the bioenergy supply chain network.
3.1. The proposed two-phase approach
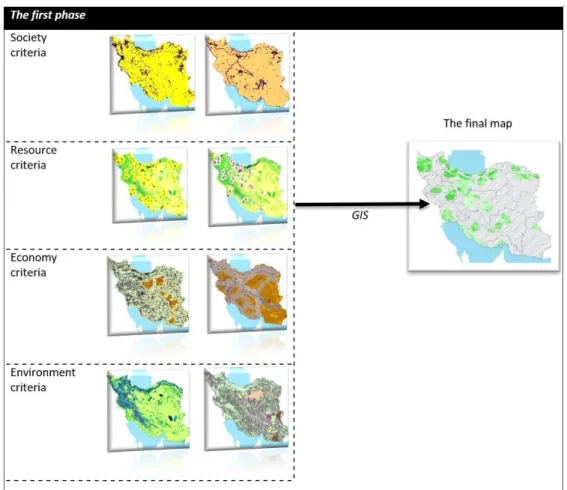
The design process for the SC network that converts AF biomass to bioenergy involves two phases. In the first phase, as shown in Figure 2, the appropriate locations that could be candidates for bio-refineries are selected based on geographical information and social concerns by using multi-criteria decision-making techniques. These locations are then used as inputs in the model for the second phase to yield the final locations of the bio-refineries and the entire supply network minimizing costs.
3.1.1. The first phase of the proposed two-phase approach
Identifying the candidate locations to set up bio-refineries is a complex process requiring accurate assessments over a wide geographic area. These locations should conform to the regions' possible environmental, economic and social interactions, and should have access to biomass/resources, and the power required for conversion technologies all through the year [14, 15]. Accordingly, a set of criteria grouped into those related to resources, environment, society, and economy is determined to find the location of bio-refineries according to the information existing in literature [42-45] and also quantitative/ qualitative information which can be obtained from consulting the experts of the national mapping agency of each country.
In the first phase, with experts of the national mapping agency of each country as decision-makers, the AHP method as a well-known Multi-Criteria Decision Making (MCDM) technique [46] can be used to weight every map layer and the specific criteria to select candidate locations. The layers are then overlaid on the base map using GIS overlay analysis. Each layer's allocated importance weight is multiplied by the value of each digital cell considered on the base map. Then, all of them come together using a summation in order to generate the digital cells’ total suitability scores on the base map [47]. Next, a suitability index is calculated that divides the area studied into a range between high suitability and low suitability. Finally, the first phase achieves its goal by proposing high-suitability, favorable locations in the considered geographical area.
9
Figure 2: Different aspects of geographical information in the bioenergy supply chain.
3.1.1.1 The social dimension of the bioenergy supply network (BE-SN)
For example, given the research done by Isfahan University of Technology’s college of agricultural engineering, Iran's Ministry of Economic Affairs and Finance prepared a vulnerability index 𝛯 for agriculture and forest, that withstands the variations in the markets of AF products. The economic variety in the territory is introduced by the 𝑣𝑎𝑟𝑖𝑒𝑡𝑦 𝑖𝑛𝑑𝑒𝑥 𝛱, which varies between 0 and 100. Value 0 means the territory relies totally on one section, whereas 100 means the territory relies identically on each section. A portion of the recruitment income that is earned from forest and agricultural sections in the territory is shown by the 𝑑𝑒𝑝𝑒𝑛𝑑𝑒𝑛𝑐𝑦 𝑖𝑛𝑑𝑒𝑥 𝛥 which is in between 0 and 1. Thus, the index 𝛯 is introduced as the 𝑖𝑛𝑑𝑒𝑥 𝑜𝑓 𝑓𝑜𝑟𝑒𝑠𝑡 𝑎𝑛𝑑 𝑎𝑔𝑟𝑖𝑐𝑢𝑙𝑡𝑢𝑟𝑒 𝑣𝑢𝑙𝑛𝑒𝑟𝑎𝑏𝑖𝑙𝑖𝑡𝑦 of the different territories (e.g. different states of a country), scoring from 0 until 100 after normalizing:
𝛯 = 𝛥 × (100 − 𝛱).
The value 100 means the territory is the most vulnerable. For instance, the values of 𝛯 for some regions are shown in Table 3 (www.amar.org.ir), they can be obtained from each country’s statistics office.
10 Table 3:
Concentrating on the territories with high level of unemployment and with high vulnerability can lead to social advantages. In other words, if jobs with higher levels of employment are offered in the territories with high level of vulnerability, more social advantages can be obtained [48].
Depending on the job losses in the other production facilities for residents of territories due to the economic crisis, various job categories are proposed in the SC of bio-refineries that are relevant to the skills of the individuals in these territories.
For instance, the farmers lost jobs can be replaced by work in the combustion stations, and the pyrolysis technology stations can provide jobs for individuals previously working in the corporations relating to oil. For example, according to the Iranian statistics office ( www.amar.org.ir), a large number of farming jobs were destroyed in the last economic crisis, so their unemployment rate is high (equal to 11.23%). These farmers could be used in the combustion centers. If the social impact of the jobs created for local people is developed in this way, there will be social advantages.
After consulting the Renewable Energy and Energy Efficiency Organization (www.satba.gov.ir), the jobs created for local people by installing the bio-refinery are classed into three main categories depending on the average unemployment rate (𝛬𝑤). There are jobs related to combustion, pelletizing, and the pyrolysis section (w), (see Table 4).
It should be mentioned that these unemployment rates can be obtained from the statistics office of each country, so Table 4 can be adapted to other case studies or countries.
Given the vulnerability and unemployment rate in the bio-refineries’ territory, the social impact of the jobs created in the category w in the territory b could be obtained as follows:
𝛹𝑤,𝑏=𝛬𝑤×𝛯𝑏 (S1)
Therefore, in order to maximize the social impact in the territories where bio-refineries will be established, the areas with high vulnerability indexes are considered using the statistics office of each country. These areas are used as input (digital map) for GIS. Then, by using the ring buffers as defined in the ArcGIS Software at different distances (e.g., 1.5, 4, 5, 17, 70, and 100 km from the central locations), the areas being analyzed are limited and those outside the ring buffers (spaces) are omitted. This method is also used for the areas with high rates of unemployment in order to obtain the second digital map layer of society criteria.
11 Table 4
The job class and its average unemployment.
Average unemployment rate (
𝛬
𝑤) Description Class (w) 11.23% This class of jobs has a revenue between $50,000 and $55,000per year. The revenue is able to change in the specific range considering the technologies’ capacities and the requested variable and fixed work hours. For example, jobs related to burning of agriculture and forest biomass to generate heat and electricity, or periodic maintenance of combustion technology like the biomass boiler and steam turbine.
1. Combustion
6.55% This class of jobs has a revenue between $55,000 and $60,000
per year. The revenue is able to change in the specific range considering the technologies’ capacities and the requested variable and fixed work hours. For example, working with technologies which are specific to generate pellets, or preprocesses which are requested in each period before performing the main process of generating pellets.
2.Pelletizing
12.35% This class of jobs has a revenue more than $60,000 per year. The
revenue is able to change in the specific range considering the technologies’ capacities and the requested variable and fixed work hours. For example, the hourly jobs for the generating process with pyrolysis technologies or the jobs with fixed hours for constant presence of the experts beside the facilities in each period.
3.Pyrolysis
3.1.1.2. The resources of the bioenergy supply network (BE-SN)
The resources required include forest residues and agricultural remains. The former involves harvesting residues such as non-merchantable, small diameter, low quality logs, tree tops, and branches (not suitable for either pulp production or lumber) and sawmill waste. The latter includes agricultural waste and non-food crops like corn stover and wheat straw.
These raw materials (biomass) could usually be gathered from many aggregated cutting blocks and agricultural lands. One of the signs of biomass availability is the presence of procurement centers/ forest product mills. Obviously, the farther the location of a bio-refinery is from the procurement centers/forest product mills, the higher the biomass accessibility cost will be. Accordingly, the proposed method can use the ring buffers at different distances (e.g., of 3, 12, 25, 75, and 100 km) around the existing procurement centers/forest product mills to make the biomass accessibility less expensive. It is worth mentioning that these residues ordinarily have no use in any other industry, and are usually disposed by burning or in landfill [49, 50].
Supplying energy from resources is another issue for biomass conversion technologies in the bio-refineries. The required energy can be supplied either by the bioenergy generated in the bio-refineries or from the electricity of the power plants that are the current energy sources.
Transferring electricity and energy from remote areas is costly. If energy sources are far from bio-refineries, they will induce heavy energy costs for the SC [50]. Hence, using the ring buffers (spaces) at different distances (e.g. 1.5, 4, 5, 17, 70, and 100 km) from the energy sources limits the areas being analyzed, and those outside the ring buffers (spaces) are omitted.
12
3.1.1.3. The economic criteria in the locations of bio-refineries
The total transportation cost in the bioenergy/biofuel SC is quite high. Connecting bio-refineries to the country roadways/railways networks is a significant problem that imposes a high cost on the SC which can make it economically unprofitable. To solve this problem, different spaces are used around the country's main roadways and railways to exclude areas outside these spaces [51].
3.1.1.4. The environmental criteria of BE-SN
Land use: Considering environmental issues and other features of bio-refineries, lands that have less usage problems should be selected [15, 42]. For example, agriculture is an important element in the economy of many countries. Conversion of agricultural lands can be not allowed according to the laws of the country. Therefore, bio-refineries cannot be built on these lands. Hence, other remaining regions (barren lands, woodlands, pastures, shrubs, herbaceous) will have priority. Note that these laws may differ from country to country, so by considering new conditions the remaining regions and their weights on the map layers may be changed.
Land slope: Sloping surfaces are not suitable for building bio-refineries because they increase construction problems due to the costs of such activities as cutting, filling, earthwork and erosion prevention [52]. To reduce these costs, the study of suitable locations could be limited to land with less slopes (e.g. less than 5 degrees), the digital elevation model and the ''surface'' command in the ArcGIS Software can be used in this part.
3.1.2. The second phase of the proposed two-phase approach
The second phase is aimed at designing an optimal SC network (SCN) that produces bioenergy from biomass to ensure that all the SC decisions, from supplying biomass to the end products (biofuel and bioenergy) received by customers, are made and integrated optimally. The decisions made at this phase are:
Determining the raw material flow between the suppliers and bio-refineries and that of the bioenergy and biofuels between bio-refineries and customers.
Selecting biomass suppliers.
Determining the optimal locations of bio-refineries from the appropriate locations identified in the first phase.
Determining the type/capacity of the biomass conversion technologies used in each bio-refinery. Proposing the biofuel production rate and inventory planning for production during the year.
These decisions are affected by uncertainties such as variable access to biomass due to seasonal variations, and uncertain cost factors due to large-scale bioenergy/biofuel production [30, 31]. Stochastic programming or robust optimization (RO) can be used in order to cope with these kinds of uncertainties in the optimization problems [53]. Although stochastic programming (SP) is a powerful tool for dealing with uncertainties, it suffers from some obvious flaws such as: 1) it needs the probability distribution information for values of the parameters under uncertainty, but in real life, it is not usually possible to determine this distribution accurately because of the shortage of historical data; 2) it generally leads to complexity in the computations for models in real world problems because it needs many scenarios to model uncertainties [54]. Conversely, RO, which is capable of preserving the primary model's computational tractability [55], is a free distribution method aimed at
13
finding the solution (worst case) according to a predetermined set of uncertainties. It could be used to prevent input data uncertainty in the problem, and stays robust against any perturbations. Furthermore, besides the lack of information to find the probability distributions for uncertain parameters considered in this study, there also are different fluctuating factors that can affect these uncertain parameters such as seasonality of biomass or different cost factors due to the large scale of the network. The nature of uncertainty for these parameters is characterized by deep uncertainty. This means for each uncertain parameter, a known interval is expressed. The interval is expressed without assuming a specific distribution of probabilities [22].
The interval uncertainty in robust optimization was first presented in [56]. The author considered all the uncertain parameter values in the worst case to provide maximum protection against uncertainties. Nevertheless, this is not realistic, because at the same time the whole set of uncertain parameters may result in the worst value, so the idea was excessively over-conservative. This theory was then developed in [57, 58] and, under an ellipsoid uncertainty set, a robust counterpart formulation to control the solution’s conservatism level was presented. The authors developed a robust optimization methodology in which the linear program (LP) is changed to a convex nonlinear program (NLP), which is more complicated as regards the computations. Next, in [59] an approach was developed that can control the conservatism level and preserve the linearity of the model as well. It will be used in this study, i.e. for the design of the bio-energy SC, the two-phase approach proposed in this paper is based on a robust model adopting the Bertsimas-Sim ideas [59].
3.2. Analytical Hierarchy Process (AHP)
The Analytical Hierarchy Process is a decision-making technique for extracting the weights of criteria in the problems involving competitive and multiple objectives (a complex decision-making problem). It generally involves three phases [60]: 1) the problem is broken down into a descending hierarchical structure where the objective stands at the upper level, the criteria lie below it, and then sub-criteria are categorized; 2) the paired comparison matrix is computed for this hierarchy at each level, in such a way that, based on the 9-point scale, each element lies in a 1 to 9 interval (from the importance of the row criterion in relation to its column criterion), 1 means equal preference and 9 means strongly preferred; and, finally, 3) the principal eigenvalue and also the corresponding normalized eigenvector of the matrix are calculated to derive the relative importance weights of the criteria being compared [68].
It is necessary to justify the consistency of the judgments in order to ensure the results of the weighting process. For a paired comparison matrix, the consistency index is obtained using the following equation:
𝐶𝐼 =(𝜆𝑚𝑎𝑥− 𝑛)
(𝑛 − 1) ⁄ 𝐶𝑅 = 𝐶𝐼 𝑅𝐼⁄
where CI is the consistency index, 𝜆𝑚𝑎𝑥 is the largest matrix eigenvalue, and n is the matrix order. CR (the acronym of consistency rate) compares CI with RI (the acronym of random index). CR is used
14
reliability of the calculated weights. Otherwise, reformation, from the beginning, of the pair-wise comparison matrix would be necessary.
3.3. Robust optimization approach
To briefly describe the Bertsimas-Sim's approach [59], let us examine the following LP:
𝑀𝑖𝑛 𝑐𝑥
𝑠𝑡: ∑ 𝑎̃𝑖𝑗𝑥𝑗 ≥ 𝑏𝑖 𝑗
∀ 𝑖 (R1)
𝑥 ∈ 𝑋
where 𝑎̃𝑖𝑗 can be uncertain and 𝐽𝑖 is the set of uncertain parameters of row i. The 𝑎̃𝑖𝑗 is a random variable on a support [𝑎𝑖𝑗− 𝑎̂ , 𝑎𝑖𝑗 𝑖𝑗+ 𝑎̂ ] where 𝑎𝑖𝑗 𝑖𝑗 is the nominal value and 𝑎̂ is the perturbation 𝑖𝑗 amplitude. The parameter 𝛤𝑖 (uncertainty budget), that may not be integer, can be used in each constraint i in order to make a trade-off for the solution’s conservatism level and the model’s robustness. It takes values between [0, |𝐽𝑖|] where|𝐽𝑖| shows the cardinality of set 𝐽𝑖, and aims at forcing ⌊𝛤𝑖⌋ parameters to acquire their values at worst case, then goes for next one (𝑎̃𝑖𝑡) and moves the next one to its worst value from its nominal value by (𝛤𝑖− ⌊𝛤𝑖⌋)𝑎̂ . Hence, the following form, 𝑖𝑡 which is nonlinear, can be considered as the model’s robust counterpart mentioned in (R1):
𝑀𝑖𝑛 𝑐𝑥 𝑠𝑡: ∑ 𝑎𝑖𝑗𝑥𝑗− {𝑆 𝑚𝑎𝑥 𝑖∪{𝑡𝑖}|𝑆𝑖⊆𝐽𝑖,|𝑆𝑖|=⌊𝛤𝑖⌋, 𝑡𝑖∈𝐽𝑖\𝑆𝑖} {∑ 𝑎̂𝑖𝑗 𝑗∈𝑆𝑖 𝑥𝑗+ (𝛤𝑖− ⌊𝛤𝑖⌋)𝑎̂ 𝑥𝑖𝑡𝑖 𝑗} ≥ 𝑏𝑖 𝑗 ∀ 𝑖 (R2) 𝑋 ≥ 0
where 𝑆𝑖 shows coefficients which take the worst value and 𝑡𝑖 demonstrates the one that varies if 𝛤𝑖 is not an integer.
The constraint i’s protection function, (𝑚𝑎𝑥{𝑆𝑖∪{𝑡𝑖}|𝑆𝑖⊆𝐽𝑖,|𝑆𝑖|=⌊𝛤𝑖⌋,𝑡𝑖∈𝐽𝑖\𝑆𝑖}{∑𝑗∈𝑆𝑖𝑎̂𝑖𝑗|𝑥𝑗
∗| + (𝛤 𝑖− ⌊𝛤𝑖⌋)𝑎̂ |𝑥𝑖𝑡𝑖 𝑗∗|}), considering 𝑥𝑗∗ as optimal solution could be rewritten in the linear form as follows:
𝑀𝑎𝑥 ∑ 𝑎̂ |𝑥𝑖𝑗 𝑗∗|𝜐𝑖𝑗 𝑗∈𝐽𝑖 𝑠𝑡: ∑ 𝜐𝑖𝑗≤ Γ𝑖 𝑗∈𝐽𝑖 ∀ 𝑖 (R3) 0 ≤ 𝜐𝑖𝑗≤ 1 ∀ 𝑖, 𝑗 ∈ 𝐽𝑖
15
Due to the feasibility of the problem (R3), and also because it is bounded for all 𝛤𝑖, its dual pair is also bounded and feasible with the identical objective value according to the strong duality property. If 𝜚𝑖 and 𝛶𝑖𝑗 (dual variables) are defined, the dual problem for (R3) can be shown as follows:
𝑀𝑖𝑛 𝛤𝑖
𝜚
𝑖+ ∑ 𝛶𝑖𝑗 𝑗∈𝐽𝑖𝑠𝑡:
𝜚
𝑖+ 𝛶𝑖𝑗≥ 𝑎̂𝑖𝑗|𝑥𝑗∗| ∀ 𝑖, 𝑗 ∈ 𝐽𝑖 (R4)𝛶𝑖𝑗 ≥ 0 ∀ 𝑖, 𝑗 ∈ 𝐽𝑖
𝜚
𝑖 ≥ 0 ∀ 𝑖Substituting (R4) in (R2), the linear robust counterpart will be as follows:
𝑀𝑖𝑛 𝑐𝑥 𝑠𝑡: ∑ 𝑎𝑖𝑗 𝑗 𝑥𝑗 −𝛤𝑖
𝜚
𝑖− ∑ 𝛶𝑖𝑗 𝑗∈𝐽𝑖 ≥ 𝑏𝑖 ∀ 𝑖 (R5) 𝛶𝑖𝑗,𝜚
𝑖, 𝑥𝑗≥ 0 ∀ 𝑖, 𝑗 ∈ 𝐽𝑖To apply the robust equation to constraints where uncertainties only affect the right-hand side (RHS), consider that of (R1). Here, also, there is the interval [𝑏𝑖− 𝑏̂ , 𝑏𝑖 𝑖+ 𝑏̂ ] meaning that the distribution 𝑖 of each uncertain parameter is symmetric and bounded, but 𝛤𝑖′ (uncertainty budget) takes values between 0 and 1. Considering these definitions, problem (R1)'s robust counterpart can be written as follows: 𝑀𝑖𝑛 𝑐𝑥 𝑠𝑡: ∑ 𝑎̃𝑖𝑗 𝑗 𝑥𝑗 ≥ 𝑏𝑖+ 𝑚𝑎𝑥 𝑏̂ 𝜐𝑖 𝑖 ∀ 𝑖 (R6) 0 ≤ 𝜐𝑖 ≤ 𝛤𝑖′ ∀ 𝑖 𝑥 ≥ 0
The equivalent of equation (R6) is the following linear optimization problem:
𝑀𝑖𝑛 𝑐𝑥
𝑠𝑡: ∑ 𝑎̃𝑖𝑗𝑥𝑗 ≥ 𝑏𝑖 𝑗
+ 𝛤𝑖′𝑏̂ 𝑖 ∀ 𝑖 (R7)
16
It is worth noting that when 𝛤𝑖′ = 0, there is no protection against uncertainty, and when 𝛤𝑖′ = 1, there is full protection against uncertainty. When 𝛤𝑖′ varies between 0 and 1, it can control the solution’s conservatism level. Bertsimas and Sim [59] suggest that if decision makers change the value of 𝛤𝑖 by considering an upper bound for the constraint violation’s probability [𝑒𝑥𝑝(−𝛤𝑖2⁄2|𝐽𝑖|)], they can adjust constraint i's conservatism/reliability level.
4. Model formulation
This section has two objectives. Firstly, it shows the development of a deterministic mixed integer linear programming model (MILP) to optimize the strategic design of the bioenergy SC. Secondly, it presents the MILP robust model considering uncertain parameters. Before formulating the problem, a verbal description is presented to understand the model better.
4.1. Deterministic Bioenergy Supply Network (DBE-SN) model
Using Table 2, the following DBE-SN model is formulated.4.1.1. Objective function
The objective function (1) minimizes the total costs of the SC throughout the planning horizon, including costs of supplying biomass (purchasing/collecting), transportation of biomass to bio-refineries, transportation of biofuel from bio-refineries to markets, fixed costs (annual investments), variable production costs, and energy costs for launching technologies, i.e. that part of the energy required by the bio-refinery supplied by the available energy sources. Also, the inventory holding costs of different biofuel types are also considered in the objective function. It is worth noting that the biomass is not stocked in this case to prevent its deterioration and dehydration from one year to another. Bioenergy storage is also dismissed because it is either impossible or not economical.
𝑀𝑖𝑛 𝑇𝑜𝑡𝑎𝑙 𝐶𝑜𝑠𝑡 = ∑ ∑ ∑ ∑ 𝜍̃𝑟,𝑠,𝑡𝐵 𝑡∈𝑇 𝑏∈𝐵 𝑠∈𝑆 𝑟∈𝑅 . 𝑈𝑟,𝑠,𝑏,𝑡 + ∑ ∑ ∑ ∑ 𝜍̃𝑟,𝑠,𝑏,𝑡𝐵,𝑇 𝑡∈𝑇 𝑏∈𝐵 𝑠∈𝑆 𝑟∈𝑅 . 𝑈𝑟,𝑠,𝑏,𝑡 + ∑ ∑ ∑ ∑ 𝜍𝑓,𝑏,𝑐,𝑡̃𝐵,𝑇 𝑡∈𝑇 𝑐∈𝐶 𝑏∈𝐵 𝑓∈𝐹 . 𝑃𝑓,𝑏,𝑐,𝑡𝑀 + ∑ ∑ ∑ 𝜍̃ 𝑎,𝑏,𝑡𝐹 𝑡∈𝑇 𝑏∈𝐵 𝑎∈𝐴 . 𝑌𝑏,𝑎,𝑡
17 + ∑ ∑ ∑ ∑ 𝜍̃𝑏,𝑎,𝑡𝑉 𝑡∈𝑇 𝑎∈𝐴 𝑏∈𝐵 𝑟∈𝑅 . 𝑈𝑟,𝑏,𝑎,𝑡𝑈 + ∑ ∑ ∑ 𝜍̃ 𝑒,𝑏,𝑡𝐸 𝑡∈𝑇 𝑏∈𝐵 𝑒∈𝐸 . 𝐽𝑒,𝑏,𝑡𝐶 + ∑ ∑ ∑ 𝜍̃ 𝑓,𝑏𝐻 𝑡∈𝑇 𝑏∈𝐵 𝑓∈𝐹 . 𝐼𝑓,𝑏,𝑡𝐵 (1)
4.1.2. Constraints
Constraints (2) ensure that amount of the biomass r coming from supplier s could not be more than the available biomass.
∑ 𝑈𝑟,𝑠,𝑏,𝑡≤ 𝛽̃𝑟,𝑠,𝑡 𝑏∈𝐵
∀𝑟 ∈ 𝑅, 𝑠 ∈ 𝑆, 𝑡 ∈ 𝑇 (2)
Constraints (3) ensure that the total biomass shipped from various resources is equal to that used by all conversion technologies at any location and in any period.
∑ 𝑈𝑟,𝑠,𝑏,𝑡 = ∑ 𝑈𝑟,𝑏,𝑎,𝑡𝑈 𝑎∈𝐴 𝑠∈𝑆
∀𝑟 ∈ 𝑅, 𝑏 ∈ 𝐵, 𝑡 ∈ 𝑇 (3)
Constraints (4) ensure the type of biomass required for each technology.
𝑈𝑟,𝑏,𝑎,𝑡𝑈 ≤ 𝜑 . 𝜓𝑟,𝑎 ∀𝑟 ∈ 𝑅, 𝑏 ∈ 𝐵, 𝑡 ∈ 𝑇 (4)
Constraints (5) and (6) guarantee that the total bioenergy and biofuel produced by each technology is equal to its conversion efficiency. Types of technologies and biomass are considered in this conversion efficiency because, depending on the quality and amount of energy involved, various biomass types have different efficiencies and can be converted through different conversion methods.
𝑃𝑓,𝑏,𝑎,𝑡= ∑ 𝛾𝑓,𝑟,𝑎 𝑟∈𝑅 . 𝑈𝑟,𝑏,𝑎,𝑡𝑈 ∀𝑓 ∈ 𝐹, 𝑏 ∈ 𝐵, 𝑎 ∈ 𝐴, 𝑡 ∈ 𝑇 (5) 𝐺𝑒,𝑏,𝑎,𝑡 = ∑ 𝛾𝑒,𝑟,𝑎 𝑟∈𝑅 . 𝑈𝑟,𝑏,𝑎,𝑡𝑈 ∀𝑒 ∈ 𝐸, 𝑏 ∈ 𝐵, 𝑎 ∈ 𝐴, 𝑡 ∈ 𝑇 (6)
Constraints (7) and (8) ensure the maximum throughout for final products producing by different technologies in each period, and show that production will continue in bio-refinery b if technology a is installed and works there(𝑌𝑏,𝑎,𝑡= 1).
18
𝑃𝑓,𝑏,𝑎,𝑡≤ 𝜉𝑎,𝑓𝑀 . 𝑌𝑏,𝑎,𝑡 ∀𝑓 ∈ 𝐹, 𝑏 ∈ 𝐵, 𝑎 ∈ 𝐴, 𝑡 ∈ 𝑇 (7) 𝐺𝑒,𝑏,𝑎,𝑡 ≤ 𝜉𝑎,𝑒𝑀 . 𝑌𝑏,𝑎,𝑡 ∀𝑒 ∈ 𝐸, 𝑏 ∈ 𝐵, 𝑎 ∈ 𝐴, 𝑡 ∈ 𝑇 (8)
Constraints (9) and (10) permit that, in each period, biofuel and bioenergy should exceed a minimum utilization capacity and prevent the installation of idle technologies.
𝑃𝑓,𝑏,𝑎,𝑡≥ 𝜉𝑎,𝑓𝑀 . 𝑌𝑏,𝑎,𝑡 . 𝜇̃ 𝑓𝑚 ∀𝑓 ∈ 𝐹, 𝑏 ∈ 𝐵, 𝑎 ∈ 𝐴, 𝑡 ∈ 𝑇 (9) 𝐺𝑒,𝑏,𝑎,𝑡 ≥ 𝜉𝑎,𝑒𝑀 . 𝑌𝑏,𝑎,𝑡 . 𝜇̃ 𝑒𝑚 ∀𝑒 ∈ 𝐸, 𝑏 ∈ 𝐵, 𝑎 ∈ 𝐴, 𝑡 ∈ 𝑇 (10)
Constraints (11) make sure that the biofuel’s amount for the markets should be equal to the amount produced at location b in any period.
∑ 𝑃𝑓,𝑏,𝑐,𝑡𝑀 = ∑ 𝑃𝑓,𝑏,𝑎,𝑡 𝑎∈𝐴 𝑐∈𝐶
∀𝑏 ∈ 𝐵, 𝑓 ∈ 𝐹, 𝑡 ∈ 𝑇 (11)
Constraints (12) ensure that the bioenergy used by the technology installed in each bio-refinery, plus the amount sold to customers (outside of the bio-refinery), should equal the total amount produced in the bio-refinery in each period.
𝐺𝑒,𝑏,𝑡𝑆 + 𝐺𝑒,𝑏,𝑡𝑈 = ∑ 𝐺𝑒,𝑏,𝑎,𝑡 𝑎∈𝐴
∀𝑒 ∈ 𝐸, 𝑏 ∈ 𝐵, 𝑡 ∈ 𝑇 (12)
Constraints (13) and (14) show the demand limitations for bioenergy and biofuel products. 𝛿̃ . 𝑀 𝑓,𝑐,𝑡𝑚 𝑓,𝑐≤ ∑ 𝑃𝑓,𝑏,𝑐,𝑡𝑀 𝑏∈𝐵 ≤ 𝛿̃ . 𝑀 𝑓,𝑐,𝑡𝑀 𝑓,𝑐 ∀𝑓 ∈ 𝐹, 𝑐 ∈ 𝐶, 𝑡 ∈ 𝑇 (13) 𝛿̃ ≤ 𝐺𝑒,𝑏,𝑡𝐸,𝑚 𝑒,𝑏,𝑡𝑆 ≤ 𝛿𝑒,𝑏,𝑡 𝐸,𝑀 ̃ ∀𝑒 ∈ 𝐸, 𝑏 ∈ 𝐵, 𝑡 ∈ 𝑇 (14)
Constraints (15) guarantee that the energy required for conversion technologies in each bio-refinery is equal to the energy that can be met by the bioenergy produced in the bio-refinery plus that supplied from other currently used sources of energy at that location.
∑ ∑ 𝜗𝑒,𝑟,𝑎𝐼,𝐶 𝑎∈𝐴 𝑟∈𝑅
19
Constraints (16) ensure that all the biofuel distributed to the markets throughout each period (i.e. ∑𝑐∈𝐶𝑃𝑓,𝑏,𝑐,𝑡𝑀 ) , plus the biofuel inventory at the end of period t (i.e. 𝐼𝑓,𝑏,𝑡𝐵 ) should not exceed the biofuel produced by technology a in period t (i.e. ∑𝑎∈𝐴𝑃𝑓,𝑏,𝑎,𝑡) plus the inventory at the end of period t-1 (i.e. 𝐼𝑓,𝑏,(𝑡−1)𝐵 ). ∑ 𝑃𝑓,𝑏,𝑎,𝑡 𝑎∈𝐴 + 𝐼𝑓,𝑏,(𝑡−1)𝐵 ≥ ∑ 𝑃𝑓,𝑏,𝑐,𝑡𝑀 𝑐∈𝐶 + 𝐼𝑓,𝑏,𝑡𝐵 ∀𝑓 ∈ 𝐹, 𝑏 ∈ 𝐵, 𝑡 ∈ 𝑇 (16)
Constraints (17) indicate that the total biofuel produced in all bio-refineries in each period should be at least equal to the total targeted demand in each period (throughout the considered country or geographical area).
∑ ∑ 𝑃𝑓,𝑏,𝑐,𝑡𝑀 𝑐∈𝐶 𝑏∈𝐵
≥ 𝜛̃ 𝑓,𝑡𝑇 ∀𝑓 ∈ 𝐹, 𝑡 ∈ 𝑇 (17)
Constraints (18) ensure persistence in the conversion processes after the bio-refineries are installed.
𝑌𝑏,𝑎,𝑡 ≥ 𝑌𝑏,𝑎,(𝑡−1) ∀𝑎 ∈ 𝐴, 𝑏 ∈ 𝐵, 𝑡 ∈ 𝑇 (18)
Constraints (19) and (20) are to prevent the model from selecting more than one technology for generating any kind of biofuel and bioenergy. Index 𝑎𝑒 presents a subset of the technologies which can produce the bioenergy of type e, index 𝑎𝑓 presents one that can produce type f bioenergy. It is worth noting that,when the installed technologies’ numbers are limited to the available biomass or to the demand for products, constraints (19) and (20) could be eliminated. Therefore, when the objective function does not consider such limiting factors as high costs, the total number of technologies installed in each bio-refinery may not be limited for samples with large available biomass and high product demand.
∑ 𝑌𝑏,𝑎,𝑡 ≤ 1 𝑎𝑒∈𝐴 ∀𝑒 ∈ 𝐸, 𝑏 ∈ 𝐵, 𝑡 ∈ 𝑇 (19) ∑ 𝑌𝑏,𝑎,𝑡 ≤ 1 𝑎𝑓∈𝐴 ∀𝑓 ∈ 𝐹, 𝑏 ∈ 𝐵, 𝑡 ∈ 𝑇 (20)
Finally (21) and (22) are binary and non-negativity constraints of the model. 𝑈𝑟,𝑠,𝑏,𝑡, 𝑈𝑟,𝑏,𝑎,𝑡𝑈 , 𝐽𝑒,𝑏,𝑡𝐶 , 𝑃𝑓,𝑏,𝑎,𝑡, 𝐼𝑓,𝑏,𝑡𝐵 , 𝑃𝑓,𝑏,𝑐,𝑡𝑀 , 𝐺𝑒,𝑏,𝑎,𝑡 , 𝐺𝑒,𝑏,𝑡𝑆 , 𝐺𝑒,𝑏,𝑡𝑈 ≥ 0 ∀ 𝑟 ∈ 𝑅, 𝑠 ∈ 𝑆, 𝑏 ∈ 𝐵, 𝑎 ∈ 𝐴, 𝑓 ∈ 𝐹, 𝑐 ∈ 𝐶, 𝑡 ∈ 𝑇 (21) 𝑌𝑏,𝑎,𝑡 , 𝑀 𝑓,𝑐 ∈ {0,1} (22)
20
4.2. Robust Bioenergy Supply Network (RBE-SN) model
Costs, amount of resources, production, and the demand for bioenergy/biofuel products are considered as uncertain parameters. Then, by developing the DBE-SN model into its robust counterpart, these parameters are considered as random variables that acquire value from a symmetric distribution according to a nominal value. For instance, 𝛽̃ belongs to the𝑟,𝑠,𝑡 interval [𝛽𝑟,𝑠,𝑡− 𝛽̂ , 𝛽𝑟,𝑠,𝑡 𝑟,𝑠,𝑡+ 𝛽̂ ] , where 𝛽𝑟,𝑠,𝑡 𝑟,𝑠,𝑡 is its nominal value and 𝛽̂ is the variation amplitude. 𝑟,𝑠,𝑡 Accordingly, the following robust method is proposed.
4.2.1. Objective function
The objective function presented in (1) is converted to (23) and (24). Since the model looks for the worst case, the whole expression (1) is considered equal to the maximum possible value (i.e. value of Z). Then, (1) is converted to the robust counterpart model presented in (23) to (31) by defining dual vectors 𝛲𝑍, 𝑎𝑟𝑠𝑏𝑡1 , 𝑏𝑟𝑠𝑏𝑡1 , 𝑐𝑓𝑏𝑐𝑡1 , 𝑑𝑎𝑏𝑡1 , 𝑒𝑟𝑏𝑎𝑡1 , 𝑔𝑒𝑏𝑡1 , 𝑙𝑓𝑏𝑡1 and a budget parameter𝛤𝑍. It is worth mentioning here that 𝛤𝑍 acquires values in the range 0 to the sum of the number of uncertain parameters in (24).
𝑀𝑖𝑛 𝑍 (23) St: ∑ ∑ ∑ ∑ 𝜍𝑟,𝑠,𝑡𝐵 𝑡∈𝑇 𝑏∈𝐵 𝑠∈𝑆 𝑟∈𝑅 . 𝑈𝑟,𝑠,𝑏,𝑡 + ∑ ∑ ∑ ∑ 𝜍𝑟,𝑠,𝑏,𝑡𝐵,𝑇 𝑡∈𝑇 𝑏∈𝐵 𝑠∈𝑆 𝑟∈𝑅 . 𝑈𝑟,𝑠,𝑏,𝑡 + ∑ ∑ ∑ ∑ 𝜍𝑓,𝑏,𝑐,𝑡𝐵,𝑇 𝑡∈𝑇 𝑐∈𝐶 𝑏∈𝐵 𝑓∈𝐹 . 𝑃𝑓,𝑏,𝑐,𝑡𝑀 + ∑ ∑ ∑ 𝜍𝑎,𝑏,𝑡𝐹 𝑡∈𝑇 𝑏∈𝐵 𝑎∈𝐴 . 𝑌𝑏,𝑎,𝑡 + ∑ ∑ ∑ ∑ 𝜍𝑏,𝑎,𝑡𝑉 𝑡∈𝑇 𝑎∈𝐴 𝑏∈𝐵 𝑟∈𝑅 . 𝑈𝑟,𝑏,𝑎,𝑡𝑈 + ∑ ∑ ∑ 𝜍𝑒,𝑏,𝑡𝐸 𝑡∈𝑇 𝑏∈𝐵 𝑒∈𝐸 . 𝐽𝑒,𝑏,𝑡𝐶 + ∑ ∑ ∑ 𝜍𝑓,𝑏𝐻 𝑡∈𝑇 𝑏∈𝐵 𝑓∈𝐹 . 𝐼𝑓,𝑏,𝑡𝐵 + ∑ ∑ ∑ ∑ 𝑎𝑟,𝑠,𝑏,𝑡1 𝑡∈𝑇 𝑏∈𝐵 𝑠∈𝑆 𝑟∈𝑅 + ∑ ∑ ∑ ∑ 𝑏𝑟,𝑠,𝑏,𝑡1 𝑡∈𝑇 𝑏∈𝐵 𝑠∈𝑆 𝑟∈𝑅 + ∑ ∑ ∑ ∑ 𝑐𝑓,𝑏,𝑐,𝑡1 𝑡∈𝑇 𝑐∈𝐶 𝑏∈𝐵 𝑓∈𝐹
21 + ∑ ∑ ∑ 𝑑𝑎,𝑏,𝑡1 𝑡∈𝑇 𝑏∈𝐵 𝑎∈𝐴 + ∑ ∑ ∑ ∑ 𝑒𝑟,𝑏,𝑎,𝑡1 𝑡∈𝑇 𝑎∈𝐴 𝑏∈𝐵 𝑟∈𝑅 + ∑ ∑ ∑ 𝑔𝑒,𝑏,𝑡1 𝑡∈𝑇 𝑏∈𝐵 𝑒∈𝐸 + ∑ ∑ ∑ 𝑙𝑓,𝑏,𝑡1 𝑡∈𝑇 𝑏∈𝐵 𝑓∈𝐹 + 𝛤𝑍 . 𝛲𝑍 ≤ 𝑍 (24) 𝛲𝑍+ 𝑎𝑟,𝑠,𝑏,𝑡1 ≥ 𝜍̂ . 𝑈𝑟,𝑠,𝑡𝐵 𝑟,𝑠,𝑏,𝑡 ∀𝑟 ∈ 𝑅, 𝑠 ∈ 𝑆, 𝑏 ∈ 𝐵, 𝑡 ∈ 𝑇 (25) 𝛲𝑍+ 𝑏𝑟,𝑠,𝑏,𝑡1 ≥ 𝜍̂ . 𝑈𝑟,𝑠,𝑏,𝑡𝐵,𝑇 𝑟,𝑠,𝑏,𝑡 ∀𝑟 ∈ 𝑅, 𝑠 ∈ 𝑆, 𝑏 ∈ 𝐵, 𝑡 ∈ 𝑇 (26) 𝛲𝑍+ 𝑐𝑓,𝑏,𝑐,𝑡1 ≥ 𝜍𝑓,𝑏,𝑐,𝑡 𝐵,𝑇 ̂ . 𝑃𝑓,𝑏,𝑐,𝑡𝑀 ∀𝑓 ∈ 𝐹, 𝑏 ∈ 𝐵, 𝑐 ∈ 𝐶, 𝑡 ∈ 𝑇 (27) 𝛲𝑍+ 𝑑𝑎,𝑏,𝑡1 ≥ 𝜍̂ . 𝑌𝑎,𝑏,𝑡𝐹 𝑏,𝑎,𝑡 ∀𝑎 ∈ 𝐴, 𝑏 ∈ 𝐵, 𝑡 ∈ 𝑇 (28) 𝛲𝑍+ 𝑒𝑟,𝑏,𝑎,𝑡1 ≥ 𝜍̂ . 𝑈𝑏,𝑎,𝑡𝑉 𝑟,𝑏,𝑎,𝑡𝑈 ∀𝑟 ∈ 𝑅, 𝑏 ∈ 𝐵, 𝑎 ∈ 𝐴, 𝑡 ∈ 𝑇 (29) 𝛲𝑍+ 𝑔𝑒,𝑏,𝑡1 ≥ 𝜍̂ . 𝐽𝑒,𝑏,𝑡𝐸 𝑒,𝑏,𝑡𝐶 ∀𝑒 ∈ 𝐸, 𝑏 ∈ 𝐵, 𝑡 ∈ 𝑇 (30) 𝛲𝑍+ 𝑙 𝑓,𝑏,𝑡1 ≥ 𝜍̂ . 𝐼𝑓,𝑏𝐻 𝑓,𝑏,𝑡𝐵 ∀𝑓 ∈ 𝐹, 𝑏 ∈ 𝐵, 𝑡 ∈ 𝑇 (31)
4.2.2. Constraints:
According to Section 3.2 (Robust optimization approach) into each of the constraints (2), (9), (10), (13) –(14), and (17), the budget parameters are introduced, and these constraints are changed to constraints (32), (39), (40), (43)–(46), and (49), respectively. It can be observed that when perturbations are larger, these constraints become tighter.
∑ 𝑈𝑟,𝑠,𝑏,𝑡≤ 𝛽𝑟,𝑠,𝑡− 𝛤𝑟,𝑠,𝑡 . 𝛽̂ 𝑟,𝑠,𝑡 𝑏∈𝐵 ∀𝑟 ∈ 𝑅, 𝑠 ∈ 𝑆, 𝑡 ∈ 𝑇 (32) ∑ 𝑈𝑟,𝑠,𝑏,𝑡 = ∑ 𝑈𝑟,𝑏,𝑎,𝑡𝑈 𝑎∈𝐴 𝑠∈𝑆 ∀𝑟 ∈ 𝑅, 𝑏 ∈ 𝐵, 𝑡 ∈ 𝑇 (33) 𝑈𝑟,𝑏,𝑎,𝑡𝑈 ≤ 𝜑 . 𝜓𝑟,𝑎 ∀𝑟 ∈ 𝑅, 𝑏 ∈ 𝐵, 𝑡 ∈ 𝑇 (34) 𝑃𝑓,𝑏,𝑎,𝑡= ∑ 𝛾𝑓,𝑟,𝑎 𝑟∈𝑅 . 𝑈𝑟,𝑏,𝑎,𝑡𝑈 ∀𝑓 ∈ 𝐹, 𝑏 ∈ 𝐵, 𝑎 ∈ 𝐴, 𝑡 ∈ 𝑇 (35) 𝐺𝑒,𝑏,𝑎,𝑡 = ∑ 𝛾𝑒,𝑟,𝑎 𝑟∈𝑅 . 𝑈𝑟,𝑏,𝑎,𝑡𝑈 ∀𝑒 ∈ 𝐸, 𝑏 ∈ 𝐵, 𝑎 ∈ 𝐴, 𝑡 ∈ 𝑇 (36)
22 𝑃𝑓,𝑏,𝑎,𝑡≤ 𝜉𝑎,𝑓𝑀 . 𝑌𝑏,𝑎,𝑡 ∀𝑓 ∈ 𝐹, 𝑏 ∈ 𝐵, 𝑎 ∈ 𝐴, 𝑡 ∈ 𝑇 (37) 𝐺𝑒,𝑏,𝑎,𝑡 ≤ 𝜉𝑎,𝑒𝑀 . 𝑌𝑏,𝑎,𝑡 ∀𝑒 ∈ 𝐸, 𝑏 ∈ 𝐵, 𝑎 ∈ 𝐴, 𝑡 ∈ 𝑇 (38) 𝑃𝑓,𝑏,𝑎,𝑡≥ 𝜉𝑎,𝑓𝑀 . 𝑌𝑏,𝑎,𝑡 . 𝜇𝑓𝑚+ 𝛤𝑓,𝑏,𝑎,𝑡 . 𝜉𝑎,𝑓𝑀 . 𝑌𝑏,𝑎,𝑡 . 𝜇̂ 𝑓𝑚 ∀𝑓 ∈ 𝐹, 𝑏 ∈ 𝐵, 𝑎 ∈ 𝐴, 𝑡 ∈ 𝑇 (39) 𝐺𝑒,𝑏,𝑎,𝑡 ≥ 𝜉𝑎,𝑒𝑀 . 𝑌𝑏,𝑎,𝑡 . 𝜇𝑒𝑚+ 𝛤𝑒,𝑏,𝑎,𝑡 . 𝜉𝑎,𝑒𝑀 . 𝑌𝑏,𝑎,𝑡 . 𝜇̂ 𝑒𝑚 ∀𝑒 ∈ 𝐸, 𝑏 ∈ 𝐵, 𝑎 ∈ 𝐴, 𝑡 ∈ 𝑇 (40) ∑ 𝑃𝑓,𝑏,𝑐,𝑡𝑀 = ∑ 𝑃𝑓,𝑏,𝑎,𝑡 𝑎∈𝐴 𝑐∈𝐶 ∀𝑏 ∈ 𝐵, 𝑓 ∈ 𝐹, 𝑡 ∈ 𝑇 (40) 𝐺𝑒,𝑏,𝑡𝑆 + 𝐺𝑒,𝑏,𝑡𝑈 = ∑ 𝐺𝑒,𝑏,𝑎,𝑡 𝑎∈𝐴 ∀𝑒 ∈ 𝐸, 𝑏 ∈ 𝐵, 𝑡 ∈ 𝑇 (42) 𝛿𝑓,𝑐,𝑡𝑚 . 𝑀 𝑓,𝑐+ 𝛤𝑓,𝑐,𝑡1 . 𝛿̂ . 𝑀 𝑓,𝑐,𝑡𝑚 𝑓,𝑐 ≤ ∑ 𝑃𝑓,𝑏,𝑐,𝑡𝑀 𝑏∈𝐵 ∀𝑓 ∈ 𝐹, 𝑐 ∈ 𝐶, 𝑡 ∈ 𝑇 (43) ∑ 𝑃𝑓,𝑏,𝑐,𝑡𝑀 𝑏∈𝐵 ≤ 𝛿𝑓,𝑐,𝑡𝑀 . 𝑀 𝑓,𝑐− 𝛤𝑓,𝑐,𝑡2 . 𝛿̂ . 𝑀 𝑓,𝑐,𝑡𝑀 𝑓,𝑐 ∀𝑓 ∈ 𝐹, 𝑐 ∈ 𝐶, 𝑡 ∈ 𝑇 (44) 𝛿𝑒,𝑏,𝑡𝐸,𝑚 + 𝛤𝑒,𝑏,𝑡1 . 𝛿𝑒,𝑏,𝑡 𝐸,𝑚 ̂ ≤ 𝐺𝑒,𝑏,𝑡𝑆 ∀𝑒 ∈ 𝐸, 𝑏 ∈ 𝐵, 𝑡 ∈ 𝑇 (45) 𝐺𝑒,𝑏,𝑡𝑆 ≤ 𝛿𝑒,𝑏,𝑡 𝐸,𝑀 − 𝛤𝑒,𝑏,𝑡2 . 𝛿𝑒,𝑏,𝑡 𝐸,𝑀 ̂ ∀𝑒 ∈ 𝐸, 𝑏 ∈ 𝐵, 𝑡 ∈ 𝑇 (46) ∑ ∑ 𝜗𝑒,𝑟,𝑎𝐼,𝐶 𝑎∈𝐴 𝑟∈𝑅 . 𝑈𝑟,𝑏,𝑎,𝑡𝑈 = 𝐺𝑒,𝑏,𝑡𝑈 + 𝐽𝑒,𝑏,𝑡𝐶 ∀𝑒 ∈ 𝐸, 𝑏 ∈ 𝐵, 𝑡 ∈ 𝑇 (47) ∑ 𝑃𝑓,𝑏,𝑎,𝑡 𝑎∈𝐴 + 𝐼𝑓,𝑏,(𝑡−1)𝐵 ≥ ∑ 𝑃𝑓,𝑏,𝑐,𝑡𝑀 𝑐∈𝐶 + 𝐼𝑓,𝑏,𝑡𝐵 ∀𝑓 ∈ 𝐹, 𝑏 ∈ 𝐵, 𝑡 ∈ 𝑇 (48) ∑ ∑ 𝑃𝑓,𝑏,𝑐,𝑡𝑀 𝑐∈𝐶 𝑏∈𝐵 ≥ 𝜛𝑓,𝑡𝑇 + 𝛤𝑓,𝑡 . 𝜛̂ 𝑓,𝑡𝑇 ∀𝑓 ∈ 𝐹, 𝑡 ∈ 𝑇 (49) 𝑌𝑏,𝑎,𝑡 ≥ 𝑌𝑏,𝑎,(𝑡−1) ∀𝑎 ∈ 𝐴, 𝑏 ∈ 𝐵, 𝑡 ∈ 𝑇 (50) ∑ 𝑌𝑏,𝑎,𝑡 ≤ 1 𝑎𝑒∈𝐴 ∀𝑒 ∈ 𝐸, 𝑏 ∈ 𝐵, 𝑡 ∈ 𝑇 (51) ∑ 𝑌𝑏,𝑎,𝑡 ≤ 1 𝑎𝑓∈𝐴 ∀𝑓 ∈ 𝐹, 𝑏 ∈ 𝐵, 𝑡 ∈ 𝑇 (52) 𝑈𝑟,𝑠,𝑏,𝑡, 𝑈𝑟,𝑏,𝑎,𝑡𝑈 , 𝐽𝑒,𝑏,𝑡𝐶 , 𝑃𝑓,𝑏,𝑎,𝑡, 𝐼𝑓,𝑏,𝑡𝐵 , 𝑃𝑓,𝑏,𝑐,𝑡𝑀 , 𝐺𝑒,𝑏,𝑎,𝑡 , ∀ 𝑟 ∈ 𝑅, 𝑠 ∈ 𝑆, 𝑏 ∈ 𝐵, 𝑎 ∈ 𝐴, 𝑓 ∈ 𝐹, c ∈ 𝐶, 𝑒 ∈ 𝐸, 𝑡 ∈ 𝑇 (53)
23 𝐺𝑒,𝑏,𝑡𝑆 , 𝐺𝑒,𝑏,𝑡𝑈 ≥ 0 𝑌𝑏,𝑎,𝑡 , 𝑀 𝑓,𝑐 ∈ {0,1} (54) 𝛲𝑍, 𝑎 𝑟𝑠𝑏𝑡 1 , 𝑏 𝑟𝑠𝑏𝑡1 , 𝑐𝑓𝑏𝑐𝑡1 , 𝑑𝑎𝑏𝑡1 , 𝑒𝑟𝑏𝑎𝑡1 , 𝑔𝑒𝑏𝑡1 , 𝑙𝑓𝑏𝑡1 ∈ 𝑅+ ∀ 𝑟 ∈ 𝑅, 𝑠 ∈ 𝑆, 𝑏 ∈ 𝐵, 𝑎 ∈ 𝐴, 𝑓 ∈ 𝐹, 𝑐 ∈ 𝐶, 𝑒 ∈ 𝐸, 𝑡 ∈ 𝑇 (55)
5. Case study
To illustrate how this approach can be used in practice, a case study from Iran is considered. Due to high climate diversity across the Iranian territory, there are many AF areas where the residues are left idle and sometimes incur costs and create environmental pollution for the inhabitants because the normal methods of disposal are burning or transportation to remote landfill sites.
Two main kinds of raw material (biomass) are considered for changing: 1) forest residues from operation processes in the forests and sawmill wastes such as chips, branches, shavings, leaves, sawdust, tree tops, hog fuel; 2) agricultural residues coming from grain harvesting of plants such as corn and wheat.
These residues can be changed to bioenergy like electricity and heat, be used to produce biofuel like ethanol, biodiesel, or converted to other products with a bio-base, e.g. plastics, and chemicals [7]. The basic processes for converting the biomass are thermochemical, biochemical, and chemical. The biochemical and thermochemical are appropriate methods for treating AF biomass, the former involves fermentation and hydrolysis and the latter involves pyrolysis, combustion, and gasification [10].
In this case study, the following four categories of the technologies for the biorefineries are considered: 1) gasification for producing heat and electricity; 2) combustion for producing heat and electricity; 3) generation of bio-oil through fast pyrolysis; and 4) pelletization, i.e. the production of pellets. Table 5 shows the different kinds of biomass needed for each technology [9, 61, 62]. Note that the processes of fast pyrolysis and combustion are able to convert all kinds of the biomass, in contrast, the processes of pelletization and gasification need biomass which is clean with low ash in content. Therefore, two kinds of the biomass can be used for the technologies of pelletization and gasification. These are the stem chips coming from harvesting residues of damaged mountain pines, and wood chips from sawmill waste [61, 63]. Four capacities (0.5, 2, 3, and 5 MW) are considered for the combustion technologies. Table 6 reports the efficiency of these technologies for the biorefineries [8, 64, 65]. Consulting the Renewable Energy and Energy Efficiency Organization (www.satba.gov.ir), for different capacities of burning technologies, there are a variety of electrical and thermal efficiencies. For pyrolysis technology at three capacities (200, 400, 600 ton/day), the efficiency depends on the type of biomass, see Table 5. For technology of pellet at three capacities (15000, 30000, 45000 ton/year), the efficiency is assumed to be 92%. [10, 65].
24 Table 5:
Table 6
Four products, namely electricity, heat, bio-oil, and pellet are considered in this study: the electricity is either sold to the local electrical grid in the bio-refinery area or used inside the bio-refinery; heat is used both inside the refinery and sold to the nearby factories/industries or houses around the bio-refinery area; bio-oil and pellets are stored to meet the local demand of the region as well as that from other regions or provinces.
Iran has a cross-country railroad network throughout most of the country and many highways and local roads. Since long-distance transportation is usually less expensive by train, most of the long-haul freight is transported to the railway station by trucks, from where it is transported by train to distant areas. Trucks usually travel at 70-80 km/hour while the train speed is about 60 km/hour. This case study used the expertise and GIS data from National Cartographic Center of Iran (www.ncc.ir), the national mapping agency, and also considered four 5-year periods.
6. Results and discussion
6.1. Results of the first phase of the proposed two-phase approach
The GIS data and the criteria/sub-criteria maps obtained from the national mapping agency were used as inputs for GIS software. Then, after digitalizing the maps, they were changed to the raster form (e.g. 95 m resolution). When this was achieved, a group of experts from the national mapping agency specializing in this field was asked to use the AHP method as a Multi-Criteria Decision Making (MCDM) technique to weight each map from an economic-engineering perspective.
25
According to [47], the map overlaying in a GIS is usually done either by the Boolean overlay method, which is applied to non-compensatory cumulative operators such as "union" (OR logic) with only one criterion and "intersection" (AND logic) with every criterion [66], or the weighted overlay method in which a relative importance weight is allocated to each evaluation criterion (or map layer) based on compensatory combinatorial rules. Hence, the weighted overlay method is more flexible than the Boolean method in selecting the appropriate locations of bio-refineries.
Table 7 shows the main types, the categories and the subcategories of different criteria and sub-criteria used in the decision-making problem considered in this study. They are considered as a descending hierarchical structure. Four main category types (societal, resource, economic, and environmental) are considered at the upper level, subdivided into eight categories, and then the sub-categories are considered for the next level of the descending hierarchical structure. For each level of this hierarchy, the paired comparison matrix is computed by the experts (e.g. from National Cartographic Center of Iran; www.ncc.ir). For example, in the third row of Table 7, the economic criteria are divided into distance to the road and distance to the rail. In the experts’ opinion, these two criteria can be divided into five sub-criteria (i.e. 0-3, 3-6, 6-20, 20-50, 50-100 km for distance to the road, and 0-5, 5-10, 10-25, 25-45, 45-100 km for distance to the rail). Using AHP, their weights can be obtained. Table 7 shows that all consistency ratios (CR) obtained from the weights are less than 0.1, this indicates the consistency of the formed matrix and the reliability of the calculated weights.
26 Table 7:
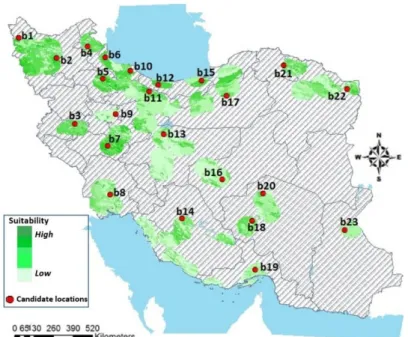
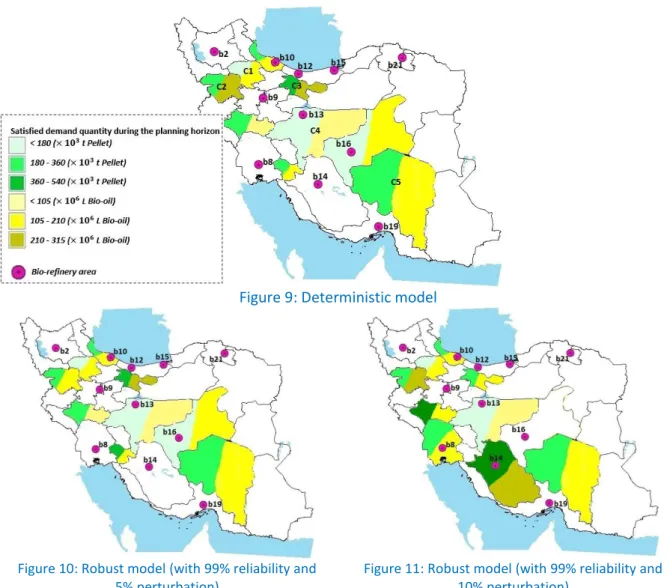
All the digital map layers are weighted by using the weights computed in Table 7 and are combined with the GIS analyzer. The final map for the proposed locations is calculated using the suitability index. The map is presented in Figure 3. Finally, 23 candidate locations with a high-suitability level are selected by using the equal-distance classification method. These suitable locations are considered as inputs for the second phase.
27
6.2. Results of the second phase
For this part of case study, both the proposed MILP models were coded in GAMS 24, and solved by using the CPLEX solver. All empirical experiments were implemented with an Intel Core i3, 2.13 GHz processor with 4GB of RAM. The robust model's efficiency and performance were examined and compared with the deterministic model.
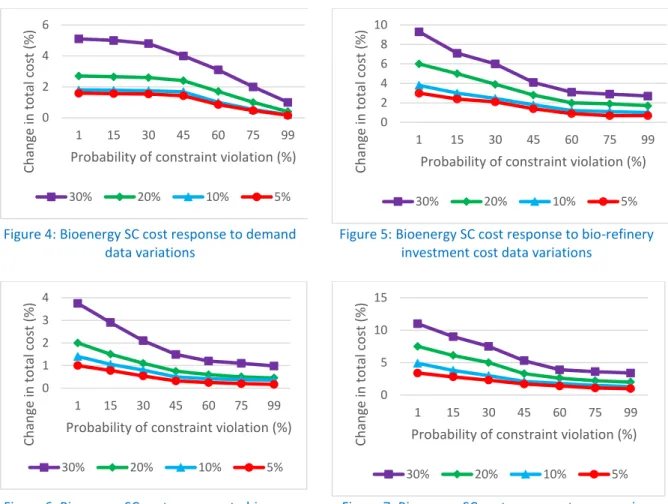
6.2.1. Effects of uncertainty on total costs of the bioenergy SC
The uncertainty’s effect on the total SC costs is examined by changing the robust model's conservatism level and the perturbation amplitude of uncertain parameters. Levels considered for the perturbation amplitude (𝑎̂ ) are 5, 10, 20 and 30% and those for the reliability and conservatism levels, controlled 𝑖𝑗 by the budget parameter 𝛤, are 68, 83, and 99%. Table 8 presents the different results obtained by adjusting each perturbation amplitude/reliability level of the model. It can be seen that the robust model costs are higher than the deterministic one at all uncertainty levels, due to the increase in the costs of improving the bioenergy SC stability. This increase becomes more significant as the conservatism/perturbation level increases. For instance, at high conservatism and risk aversion levels of the model (99% reliability and 30% amplitude), the total SC cost increases by 49.3% compared to the deterministic case. At lower uncertainty levels, it is possible, of course, to pay more reasonable costs, by creating a trade-off between robustness and the corresponding cost.
Table 8:
Examining and comparing the problem solution times is another outcome of solving the robust model with different conservatism/risk levels. As shown in Table 9, although the new constraints and variables are defined in the model (robust), it is still tractable from computational point of view, and the techniques used prevents elongation of the solution time compared with the deterministic model.
Table 9:
To study the differences in the costs of the deterministic and robust models, we first study each set of uncertain parameters at different perturbation and conservatism levels, and then check the effects on the increase in the total cost of the bioenergy SC by examining the normalized deviation, i.e.,