Université de Montréal
Expansion of the CD8 memory T cells: implications for the
self-renewal gene Hoxb4
par
Gloria E. Giono Chiang
Département de Microbiologie, Infectiologie et Immunologie Faculté de Médecine
Mémoire présenté à la Faculté des études supérieures en vue de l’obtention du grade de Maîtrise
en Microbiologie et Immunologie
Décembre, 2016
ii
Université de Montréal
Faculté des études supérieures
Cette thèse intitulée :
Expansion of the CD8 memory T cells: implications for the
self-renewal gene Hoxb4
Présenté par Gloria E. Giono Chiang
A été évaluée par un jury composé des personnes suivantes :
Dr Réjean Lapointe, président-rapporteur Dr Janetta Bijl, directrice de recherche Dr Nathalie Labrecque, co-directrice de recherche
i
Résumé
Les cellules CD8 T mémoire (Tm) offrent une protection tout au long de la vie contre les infections récurrentes. Elles sont maintenues grâce à des mécanismes d'auto-renouvellement. Les cellules souches hématopoïétiques (CSH) peuvent aussi s'auto-renouveller lentement, en assurant leur maintenance à long terme. Les deux types de cellules utilisent la moelle osseuse comme principale niche de prolifération. CD8 Tm et CSH partagent partiellement un profil transcriptionnel, y compris certains gènes connus pour contrôler l'auto-renouvellement. Les gènes Hox, dont Hoxb4 qui est un activateur puissant de l’expansion des CSH in vitro et in vivo, sont exprimés par les CSH. Basé sur les similitudes entre les CSH et les cellules Tm, nous émettons l'hypothèse que les gènes impliqués dans l’auto-renouvellement des CSH, comme Hoxb4, favoriseront l'expansion des cellules CD8 Tm. Pour tester cette hypothèse, nous avons déterminé l'effet de la surexpression de Hoxb4 dans les cellules T à partir de souris transgéniques jeunes et âgées, et sur la prise de greffe et le maintien des cellules CD8 Tm après leur transplantation dans des souris immunocompétentes ou immunosupprimées.
À l'état basal, la composition et le phénotype des cellules T naïves et mémoire n’ont pas été affectés par la surexpression de Hoxb4. Pour étudier le maintien des cellules CD8 Tm, les souris transgéniques Hoxb4 et OT-1 ont été croisées. Les cellules T des souris OT-1, entre autre, expriment un récepteur de lymphocyte T qui reconnaît le peptide d'ovalbumine (OVA), présenté par le complexe majeur d’histocompatibilité de classe I. En utilisant ce modèle, nous avons généré in vitro un grand nombre de cellules CD8 Tm pour les expériences du transfert adoptif. Ces cellules sont monoclonales et spécifiques pour la reconnaissance d’OVA. Le nombre et le phénotype des cellules CD8 Tm générées en culture n’ont pas été affectés par la surexpression de Hoxb4. Ces cellules ont été transplantées dans des souris de type sauvage afin d'évaluer leur prise de greffe et leur maintien à long terme. Après la transplantation chez des souris soit immunocompétentes ou immunosupprimées, la prise de greffe et le maintien des cellules CD8 Tm surexprimant Hoxb4 n'a pas été améliorée lorsque comparée aux cellules CD8 Tm de type sauvage. Ces résultats suggèrent que Hoxb4 ne favorise pas l’auto-renouvellement des cellules CD8 Tm. D'autres études vont essayer d'identifier les facteurs contrôlant l’auto-renouvellement des cellules CD8 Tm.
ii
Mots-clés: Hoxb4, cellules CD8 T mémoire, cellules souches hématopoïétiques, auto-renouvellement, prolifération homéostatique et modèles de souris transgéniques.
Abstract
CD8 memory T (Tm) cells provide life long protection against recurrent infections and are maintained through self-renewal mechanisms. Hematopoietic stem cells (HSC) also possess the capacity to slowly self-renew assuring their long-term maintenance. Both cell types use the bone marrow as their preferred proliferation niche. CD8 Tm and HSC partially share a transcriptional profile including some genes known to control self-renewal. Hox genes are expressed in HSCs, among them Hoxb4 is a potent enhancer of HSC expansion in vitro and in vivo. Based on the similarities between HSC and Tm cells, we hypothesize that genes involved in HSC self-renewal, like Hoxb4, will promote CD8 Tm cell expansion. To test this hypothesis, we have determined the effect of Hoxb4 overexpression in T cells from young and old transgenic mice, and on the engraftment and maintenance of CD8 Tm cells after transplantation into immunocompetent or immunodeficient mice.
At the steady-state, the composition and phenotype of the naïve and memory T cells were not affected by Hoxb4 overexpression. To study CD8 Tm cell maintenance, the Hoxb4 and the OT-1 transgenic mice were crossed; the latter express a T cell receptor that recognizes the ovalbumin (OVA) peptide, presented by major histocompatibility complex class I. Using this model, we generated in vitro large numbers of monoclonal and OVA specific CD8 Tm cells for adoptive transfer experiments. The number and the phenotype of Tm cells generated in culture were not affected by Hoxb4 overexpression. These cells were transplanted into wild type mice to evaluate their engraftment and long-term maintenance. After transplantation in either immunocompetent or immunodeficient mice, Hoxb4 overexpressing Tm cell engraftment or maintenance was not enhanced when compare to wild-type Tm cells. These results demonstrate that Hoxb4 does not promote CD8 Tm cell self-renewal. Further studies will try to identify the factors controlling CD8 Tm cell self-renewal.
Keywords: Hoxb4, CD8 memory T cells, hematopoietic stem cells, self-renewal, homeostatic proliferation and transgenic mice model.
iii
Table of contents
Résumé ... i
Abstract ... ii
List of tables ... vi
List of figures ... vii
Abbreviations ... viii
Acknowledgements ... xi
Introduction ... 1
1.- Hematopoietic stem cells ... 2
1.1.- Ontogeny ... 3
1.2.- Hematopoietic stem cell niches ... 5
1.2.1.- The endosteum niche ... 5
1.2.2.- The vascular niche ... 6
1.2.3.- Additional cell types supporting HSCs ... 7
1.3.- Self-renewal of HSCs ... 8
1.4.- Molecules involved in HSC self-renewal ... 9
2.- Hox genes ... 11
2.1.- Hox genes in hematopoiesis ... 12
2.2.- Modulation of the Hoxb4 effect in HSCs self-renewal ... 15
3.- Adaptive immunity ... 16
3.1.- Lymphocytes ... 16
3.1.1.- T Lymphocytes ... 17
3.1.2.- T cell activation ... 18
3.1.2.1.- First signal: TCR engagement ... 18
3.1.2.2.- Second signal: T cell co-stimulation ... 19
3.1.2.3.- Third signal: Cytokine stimulation of T cells ... 19
3.2.- CD8 T cell response ... 20
3.2.1.- CD8 Tm cell generation ... 21
3.3.- Main differences between Tn and Tm cells ... 22
iv
3.4.1.- Characteristics of the different CD8 Tm cell populations ... 24
3.4.2.- CD8 Tm cell populations differentiation models ... 27
3.4.3.- CD8 Tm cell populations generation ... 28
3.5.- Homeostatic maintenance of T cells ... 29
3.5.1.- Factors involved in Tn cell homeostasis ... 30
3.5.2.- Factors involved in Tm cell homeostasis ... 31
3.5.2.1.- The role of the interaction TCR-self peptide in Tm cell homeostasis ... 31
3.5.2.2.- The role of cytokines in Tm cell homeostasis ... 32
3.5.2.3.- The role of TNF family ligands in Tm cell homeostasis ... 34
3.5.2.4.- The role of Wnt signaling pathway in Tm cell homeostasis ... 35
Hypothesis... 38
Objectives ... 41
General objective: ... 42
Specific objectives: ... 42
Material and methods ... 43
I.- Mice ... 44
II.- Mice genotyping ... 44
III.- In vitro generation of CD8 Tm cells ... 45
IV.- CFSE staining ... 45
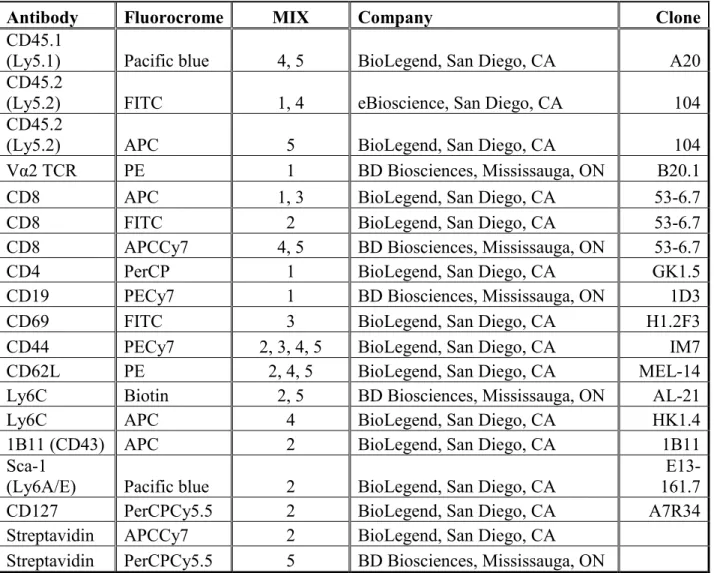
V.- Antibody staining and FACS analysis ... 46
VI.- Transplantation assays to normal WT mice ... 47
VII.- Lymph node surgery ... 48
VIII.- Competitive transplantation assays ... 48
IX.- Statistical analysis ... 48
Results ... 49
I. Hoxb4 overexpression does not affect the composition of the T cell pools in young and old mice ... 50
II. Hoxb4 overexpression does not provide an advantage to the engraftment and long-term maintenance of CD8 Tm cells after independent transplantation into immunocompetent mice. . ... 54
v
II.II.- Hoxb4 overexpression does not affect the transplantation of the in vitro generated
CD8 Tm cells into normal mice ... 57
II.III.- Hoxb4 and WT CD8 Tm cells home properly to secondary lymphoid organs and tertiary sites. ... 60
III. Hoxb4 overexpression does not provide an advantage to the engraftment and long-term maintenance of CD8 Tm cells after competitive transplantation into lymphopenic mice. ... 61
Discussion ... 67
Conclusion ... 74
Future plans ... 76
vi
List of tables
Table 1.- Characteristics of mouse CD8 T cell populations. ... 26 Table 2.- Antibodies mixed for the different assays. ... 46 Table 3.- List of antibodies used for surface staining. ... 47
vii
List of figures
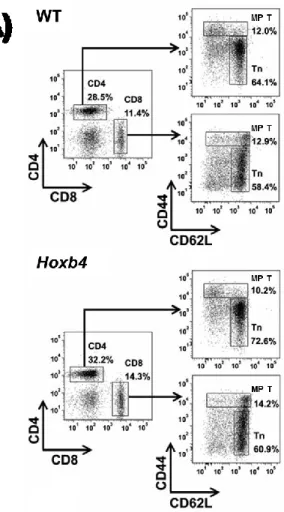
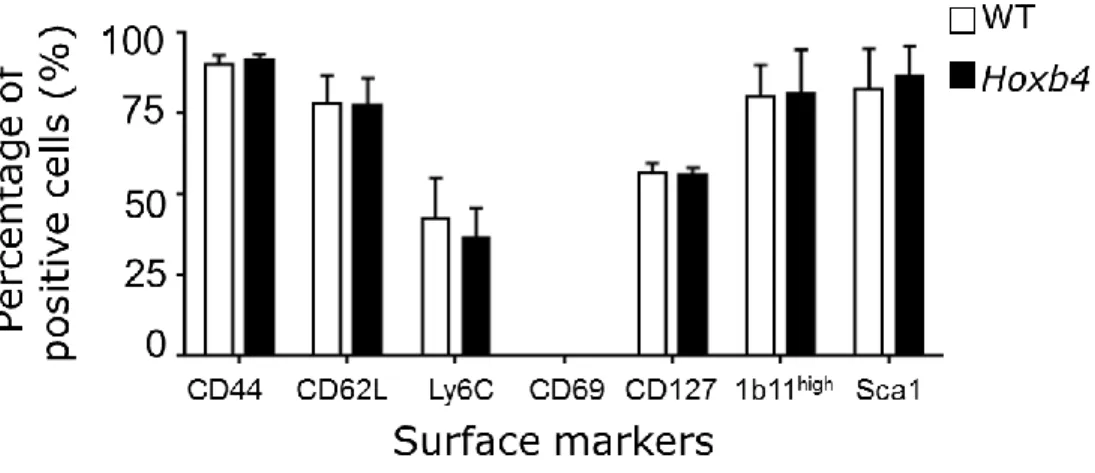
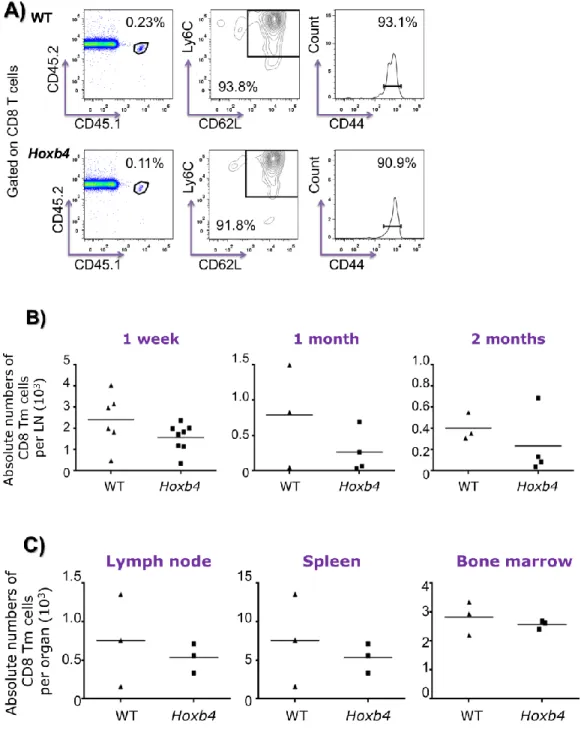
Figure 1.- Blood cell ontogeny. ... 4 Figure 2.- Schematic representation of Hox genes clusters. ... 12 Figure 3.- Similar T cell compartment in WT and Hoxb4 young adult transgenic mice. ... 52 Figure 4.- Similar changes in T cell populations compartment in WT and Hoxb4 transgenic mice
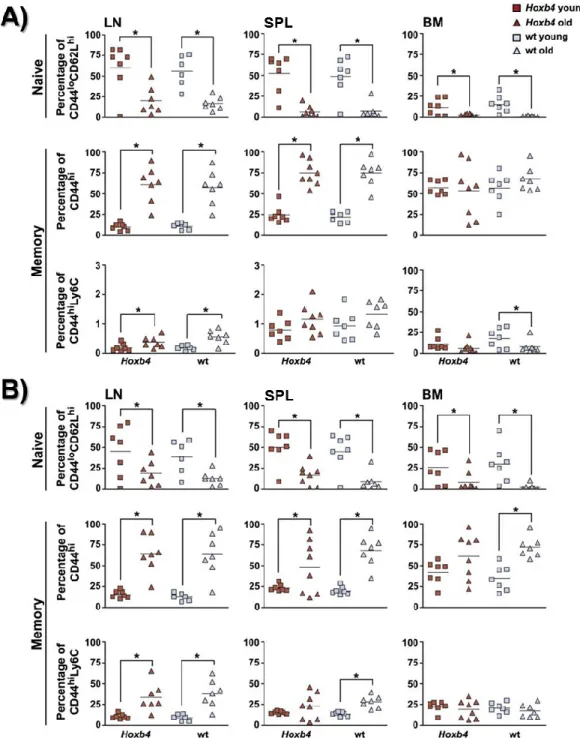
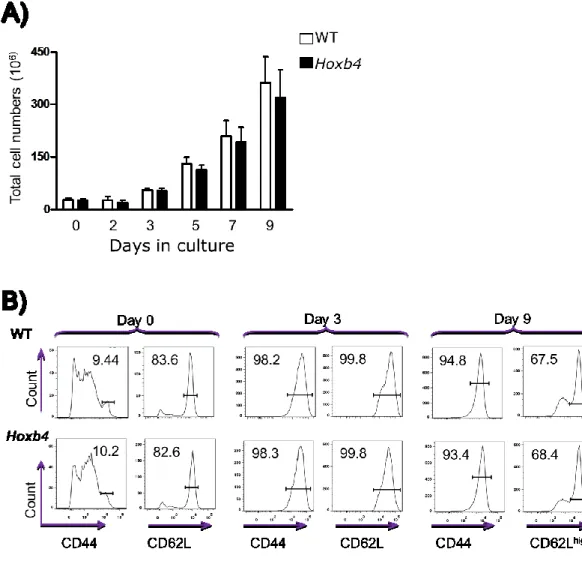
with age. ... 53 Figure 5.-Similar number and phenotype of WT and Hoxb4 CD8 T cells during in vitro differentiation culture... 56 Figure 6.- Similar expression of cell surface markers on WT and Hoxb4 CD8 Tm cells generated in vitro. ... 57 Figure 7.- Comparable CD8 Tm cell population are maintained after independent transplantation into immunocompetent mice. ... 59 Figure 8.- Similar migratory capacity of in vitro generated WT and Hoxb4 OT-1 CD8 Tm cells following their adoptive transfer into immunocompetent mice. ... 61 Figure 9.- Contribution analysis of Hoxb4 and WT CD8 Tm cells after competitive transplantation into lymphopenic mice reveled no advantage conferred by Hoxb4. ... 64 Figure 10.- Similar phenotype of in vitro generated WT and Hoxb4 CD8 Tm cells after competitive transplantation into lymphopenic mice. ... 65 Figure 11.- Similar CFSE dilution after competitive transplantation of WT and Hoxb4 in vitro generated CD8 Tm cells into lymphopenic mice. ... 66
viii
Abbreviations
Abd: abdominal Ag: antigen
AML: acute myeloid leukemia Antp: antennapedia
APC: antigen presenting cells Baso: basophil
BM: bone marrow
BMP: bone morphogenetic protein
CAR cells: CXCL12-abundant reticular cells CFSE: carboxyfluorescein succinimidyl ester CLP: common lymphoid progenitor
CMP: common myeloid progenitor CXCL12: CXC-chemokine ligand 12 DC: dendritic cell Dfd: Deformed E: embryonic days Eomes: Eomesodermin Eosin: eosinophil
FACS: Fluorescence Activated Cell Sorting GATA2: Gata binding protein 2
Gfi1: growth factor independence 1 gene GMP: granulocyte-macrophage progenitor Hox: homeobox
HP: lymphopenia induced homeostatic proliferation HSC: Hematopoietic stem cell
IFN-I: type I interferon IL: Interleukin
KLRG1: killer cell lectin-like receptor G1 Lab: labial
ix Lck: lymphocyte-specific protein tyrosine kinase LMPP: lymphoid-primed multipotent progenitor LN: lymph node
Macro: macrophage Meg: megakaryocyte,
MHC: major histocompatibility complex MkPE: megakaryocyte-erythrocyte progenitor MLN: mesenteric lymph nodes
Mono: monocyte
MPP: multipotent progenitor
MP T: memory-like T cell phenotype Nk: natural-killer
Neutro: neutrophil OVA: ovalbumin Pb: proboscipedia Pc: peritoneal cavity
RBC: red blood cell (erythrocyte)
Runx1: Runt-related transcription factor 1 gene Sca-1: stem cell antigen-1
Scr: Sex combs reduced
SDF-1: stromal cell derived factor 1 SDLN: skin draining lymph nodes Shh: Sonic hedgehog
SPL: spleen
STAT3: signal transducer and activator of transcription 3 T-ALL: T-cell acute lymphoblastic leukemia
Tcf-1: T cell factor 1 Tcm: central memory T TCR: T cell receptor
TDIM: death intermediates memory T cells
x Tem: effector memory T
Th: T helper Tm: memory T Tn: naïve T
TNF: tumor necrosis factor
TRAF: TNF receptor-associated factors Trm: tissue-resident memory T
Tscm: memory stem T cells Ubx: Ultrabithorax
Wnt: Wingless-type WT: wild type
xi
Acknowledgements
Many people have contributed to my formation in various different ways and I would like to acknowledge all of them for their support on my way to get to this Master.
I would like to start with my director Dr. Janetta Bijl and my co-director Dr. Nathalie Labrecque, for accepting, teaching, guiding and supervising me. They have allowed me to gain a solid scientific research experience from the basis of two different points of view.
I would like to specially acknowledge my memoir committee, Dr. Réjean Lapointe and Dr. Krista Heinonen for the time they have given me to follow my project, review my memoir and their valuable comments. Also Dr. Martin Guimond for his valuable time and comments while following my work on the committee meeting and after.
This opportunity has allowed me to learn from two laboratories. I would like to thank Charles-Étienne Lebert-Ghali, Gratianne Vaisson, Marilaine Fournier, Mona Hassawi, Cindy Audiger, Frédéric Duval, Jean-François Daudelin, Salix Boulet. I am particularly grateful with Héloïse Frison for leading me into this project, with Mélissa Mathieu and Paméla Thebault for their patient to teach and their contributions to this project.
Realizing a research project implicates the help from several people. I would like to thank the staff of the Maisonneuve-Rosemont Hospital; very importantly, the staff of the animal care facilities; and particularly Martine Dupuis from the FACS platform for her patient and support.
Science research would not be possible without the support from different organizations. I want to thank Nature Science and Engineering Research Council of Canada (NSERC) for fully funding this project. I am very grateful with the Department of Microbiology and Immunology at the University of Montreal, the Faculty of Medicine and the Faculty of Graduate and Postdoctoral Studies (FESP) who granted me the recruitment award and the troubleshooting scholarship to finish my Master.
I would like to thank all my friends, their priceless support in many ways has helped me to get here. Finally, my family is the engine that drives me to achieve my goals and without their support I would not have gotten this far. I would like to thank my parents and grandparents, they are my inspiration. My brothers are the wave that moves me and makes me discover new things thanks for all the fun LOL.
1
2
1.- Hematopoietic stem cells
One of the most extremely regenerative tissues in the human body is the blood. It is very complex, but at the same time, it is probably one of the most studied and understood developmental systems. Its organization consists of cellular hierarchies where all the cells come from a common precursor which continues to differentiate to give rise to all of mature blood cell types. The hematopoietic stem cells (HSCs) are at the base of this hierarchy. They self-renew and differentiate to maintain the production of the blood cells. The self-renewal is a cellular division which is critical to preserve the multipotential differentiation capacity of the parental HSC in at least 1 of the daughter cells (Sieburg et al., 2013).The principal niche of HSCs is the bone marrow (BM), where they receive the necessary signals for their function (Doulatov et al., 2012).
The HSCs qualities (self-renewal and differentiation potential) can be proven when the cells can fully reconstitute lethally irradiated mice after transplantation. This has been the leading assay to the discovery and understanding the HSCs. From the 60’s it was realized that colony-forming-units could generate similar colonies upon transplantation into secondary recipients although it was difficult to purify the HSC (Lessard et al., 2004). By the end of the 80’s, different phenotypic markers were used to purify and characterized the HSCs. Spangrude and collaborators (Spangrude et al., 1988) showed that 50% of lethally irradiated mice are rescued with 30 cells (Lin- Thy-1low Sca-1+). Then c-kit was showed to be essential for hematopoiesis in BM and self-renewal of hematopoietic progenitor cells (Ogawa et al., 1991). These experiences result in the LSK (Lineage-/low, Sca-1+, c-Kit+) marker set use canonically to identify HSCs enrichment. The identification of the SLAM family receptors (including CD150, CD244, CD229 and CD48) has allowed a better detection of HSCs from the LSK cells fraction in the BM (Kiel et al., 2005; Oguro et al., 2013). Currently, transplantation of a single HSC into lethally irradiated mouse result in long-term reconstitution of the lymphohematopoietic system (Osawa et al., 1996).
3
The majority of the HSCs are in a quiescent state dividing infrequently, but they can cycle with regularity renewing the pool in few weeks. In order to respond to hematopoietic stress like BM injury, HSCs can switch from the quiescent to the active state increasing their division for replenishing the HSC pool or differentiating to replenish the missing mature blood cells. When normal levels of cells are regained, activated HCSs return to the quiescent state (Fleming et al., 1993; Wilson et al., 2008).
1.1.- Ontogeny
During embryonic development, the niches for the HSCs and blood cell production change. Mouse primitive hematopoiesis begins at embryonic day (E) 7.5 in the yolk sac, where primitive erythroid cells are produced. These cells will function to deliver oxygen to the embryo and they are the predominant blood cell type before the definitive erythrocyte production. Then, around E8.25, myelo-erythroid progenitor cells from yolk sac will migrate to the fetal liver where they will generate enucleated erythrocytes. These cells will rapidly become more numerous than the primitive population (Baron et al., 2013; Clements and Traver, 2013; Frame et al., 2013; Sugiyama et al., 2011). At E8.5 the appearance of the first multipotent progenitors in the yolk sac and the placenta has been demonstrated (Alvarez-Silva et al., 2003). At E12.5, definitive hematopoiesis starts in the fetal liver, where HSCs have arrived and expanded. Then, they can enter the fetal spleen (SPL) at E13.5. Finally, after E16.5 the adult hematopoiesis is established with the migration of HSCs to the fetal bone marrow where they will stay to generate the different blood cell types (Baron et al., 2013; Clements and Traver, 2013; Sugiyama et al., 2011). At the end of gestation, when BM becomes the dominant site, the number of HSC is stabilized and this number will be maintained in adult life. It is not clear where definitive HSCs are generated during embryogenesis before liver formation at E11.5. The different origins proposed are the extraembryonic mesoderm at the yolk sac, the vascular endothelium in the intraembryonic para-aortic-splanchnopleural mesoderm / aorta-gonad-mesonephros region and also the proposition that some cells come from the placenta (Adamo and Garcia-Cardena, 2012; Medvinsky et al., 2011; Sugiyama et al., 2011).
4
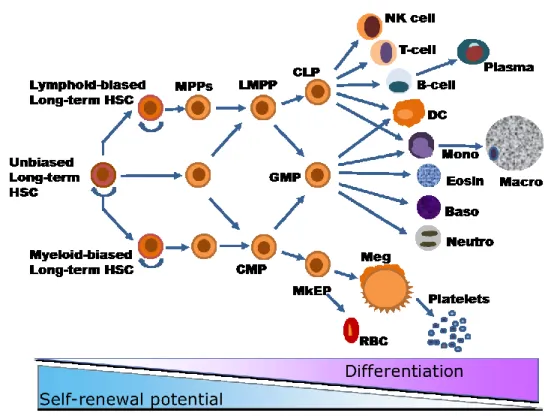
Adult hematopoiesis is a process of cell differentiation and proliferation resulting in the production of all the different blood cell types (Figure 1). The understanding of this hierarchical process has changed from a simple linear differentiation to a system that is much more complex. In a simplified way, HSCs will progressively differentiate generating multipotent progenitor cells with an intermediate or short-term repopulation capacity. These progenitor cells gradually continue to acquire characteristics of a more specific lineage. Then, they will generate one of the lineage committed cells like the megakaryocyte-erythrocyte progenitor (MkEP), granulocyte-macrophage progenitor (GMP) and the common lymphoid progenitor (CLP). In turn, the lineage committed cells will finish their differentiation into specific mature blood cell types. Intrinsic and extrinsic factors are involved in defining the decision of the cellular fate (Lensch, 2012; Orkin, 2000; Rieger and Schroeder, 2012).
Figure 1.- Blood cell ontogeny.
Hematopoietic stem cells can self-renew and differentiate to produce all the mature blood cell types. The self-renewal potential is lost with the progressive differentiation. HSC = Hematopoietic stem cells, MPP = multipotent progenitor, CMP = common myeloid progenitor, LMPP = lymphoid-primed multipotent progenitor, MkEP = megakaryocyte-erythrocyte
5
progenitor, GMP = granulocyte-macrophage progenitor, CLP = common lymphoid progenitor, RBC = red blood cell (erythrocyte), Meg = megakaryocyte, Neutro = neutrophil, Baso = basophil, Eosin = eosinophil, Mono = monocyte, Macro = macrophage, DC = dendritic cell, NK cell = natural-killer cell. Adapted from: An Evolving Model of Hematopoietic Stem Cell Functional Identity. Stem cell reviews (Lensch, 2012).
Originally, HSCs were considered as a single homogenous population of cells, however recent studies showed that HSCs are heterogeneous and have different regeneration potentials. Three types of HSCs have been proposed based on their ability to generate different lineage (Figure 1). These are the unbiased that divide into all, the myeloid-biased and the lymphoid-biased long term HSCs (Babovic and Eaves, 2014; Lensch, 2012; Zhang et al., 2013).
1.2.- Hematopoietic stem cell niches
HSCs need to be maintained in the body without losing their ability to differentiate and to self-renew. HSCs are located in a specific microenvironment, the “HSC niche” which supplies the necessary components and signals to maintain and to regulate the cycling state of HSCs (Isern and Mendez-Ferrer, 2011). The principal niche of adult HSCs is located in the BM (Doulatov et al., 2012). Within the BM, two specific microenvironments are identified: the endosteum niche and the vascular niche.
1.2.1.- The endosteum niche
The inner surface between the bone and the BM is known as the endosteum. This surface is well vascularized. HSC populations and primitive hematopoietic progenitors are localized in the endosteum. Different mechanisms have been suggested for the way the endosteal cells contribute to the maintenance of HSCs. These cells can be acting by direct contact, releasing soluble factors or regulating the function of intermediate cells (Chotinantakul and Leeanansaksiri, 2012; Kiel and Morrison, 2008).
6
The endosteal cells can produce some of the necessary factors for the HSC maintenance, however these factors are still not completely characterized. The osteoblasts localized in this surface are suggested to be the main supportive cells for HSCs, because they provide factors that can regulate the maintenance, quiescence and localization in the niche of HSCs, including soluble factor as angiopoietin-1, stromal cell derived factor 1 (SDF-1) and osteopoietin (Chotinantakul and Leeanansaksiri, 2012; Kiel and Morrison, 2008).
Besides the role to support HSCs maintenance in normal conditions, the endosteum seems to play an important role when the BM is damaged, promoting HSC expansion. For example, irradiation can damage the BM and eliminate HSCs from the body. When HSCs are transplanted into irradiated mice, they preferentially localize in the endosteum where they expand to re-establish the blood cell populations of the mice. The irradiated niche produces cytokines. This localization is different when HSCs are transplanted to normal mice where they are randomly distributed (Xie et al., 2009).
1.2.2.- The vascular niche
The vascular niche is also thought to be involved in the maintenance of the HSCs. During the development of the embryo, vascular or perivascular niches are probably the primary residence for HSCs before they finally migrate to the BM through the vascular system (Kiel and Morrison, 2008). The vascular system also plays a role in adult HSCs migration given that the cells can be mobilized rapidly into circulation after stimulus like interleukin-8 (IL-8) (Laterveer et al., 1995).
Within the vascular niche, the endothelial cells are suggested to be the providers of the necessary signals for the maintenance and differentiation of the HSCs (Chotinantakul and Leeanansaksiri, 2012). However, it is still not clear if the endothelial cells are needed for both mechanisms or just for one (Kiel and Morrison, 2008). Endothelial signaling seems to be
7
mediated through the cytokine receptors that share the subunit gp130. Transplantation assays demonstrated that when HSCs are transplanted into mice with endothelial cells deleted for gp130, normal hematopoiesis is not re-established and mice fail to recover, even if HSCs enter the BM (Yao et al., 2005). These results suggest that endothelial cells are important for the maintenance of hematopoiesis; however, it is still not clear if the endothelial cells are acting directly or indirectly on HSCs (Kiel and Morrison, 2008).
1.2.3.- Additional cell types supporting HSCs
Other cells, like the reticular cells, could have a role contributing to the niche for HSCs either directly or indirectly. Probably, the HSCs niche can be considered a combination of all the different supporting cells (Kiel and Morrison, 2008).
An example of these cells is the reticular cells known as CAR cells, which reside in the perivascular niche. This name was given because they abundantly produce CXC-chemokine ligand 12 (CXCL12) also known as SDF-1. HSCs are in contact with CAR cells. CXCR4 is the primary receptor for CXCL12. When this receptor is deleted in HSCs, their number is reduced. In contrast, this deletion does not affect more mature progenitors. It seems that the signaling trough CXCR4 provided by CAR cells is important for the maintenance of HSCs (Sugiyama et al., 2006).
Every day, numbers of HSCs are entering and exiting the circulation, which means that HSCs are not only staying in the BM. In the mouse, between 100 to 400 HSCs are estimated to be circulating in the blood (Wright et al., 2001). This opens the possibility that HSCs could have other niches that are still not defined. Other cell types and microenvironments could be supporting the maintenance of HSCs by providing direct or indirect signals. Moreover, after injury, the mechanisms that maintain HSCs could change to induce the appropriate response of the cells (Kiel and Morrison, 2008).
8
1.3.- Self-renewal of HSCs
To prevent exhaustion of HSCs that would jeopardize blood cell production, HSCs divide without differentiation to maintain numerical stability, a process also called self-renewal. Depending on the requirement of the organism, HSCs will self-renew to maintain or to expand the population. To obtain either maintenance or expansion of HSCs, self-renewal distinguishes either symmetrical or asymmetrical division (Lessard et al., 2004).
The symmetrical division is defined as a division resulting in two daughter cells that preserve the characteristics of the parental cell. It is also known as self-renewal expansion. It is observed during embryogenic development when HSCs expand in the fetal liver. In adult, hematopoiesis an expansion of HSCs only occurs when hematopoietic stress takes place, for example following transplantation or BM injury. The mechanisms controlling HSCs self-renewal in both, embryonic and stress hematopoiesis, may be similar (Lacadie and Zon, 2011; Lessard et al., 2004).
The asymmetrical division results in two different daughter cells. One will preserve the characteristics of the parental cell and the other will be more differentiated and continue the path to produce the blood cells necessaries for the body (Ting et al., 2012). It has been observed that the asymmetrical division of HSCs can produce one daughter that remains quiescent while the other multiplies (Huang et al., 1999). The molecular mechanism is still not well known. With the use of videomicroscopy it was observed that the endocytic protein AP2A2 is asymmetrically segregated during mitosis of HSCs, suggesting that this protein could play a role in this type of division (Ting et al., 2012). In contrast to the segregation during asymmetric division of this protein, it was shown that chromosomes are randomly segregated (Kiel et al., 2007).
To maintain the HSCs pool and to give rise to the different blood cell types a balance between symmetrical and asymmetrical division is required (Huang et al., 1999). Studies are ongoing to unravel the mechanisms regulating the self-renewal of the HSC.
9
1.4.- Molecules involved in HSC self-renewal
There are multiple factors known to be involved in the regulation of HSC self-renewal. Very generally, they can be divided in intrinsic or extrinsic factors. The intrinsic control of HSC self-renewal includes transcription factors and chromatin-associated factors regulating the gene expression, like the homeobox (Hox) genes and the growth factor independence 1 gene (Gfi1). The extrinsic factors coming from the environment could modulate the gene expression. There are multiple extrinsic regulators of HSCs self-renewal like growth factors, cytokines or chemical modulators. HSCs express receptors for different extrinsic regulators. These receptors can activate developmental pathways that could modulate the fate of HSCs. Wingless-type (Wnt), Notch and Sonic hedgehog (Shh) are among these pathways (Walasek et al., 2012).
HSCs express Gfi1 which seems to play a role in the homeostasis of the cells. Gfi1 function to restrain HSC proliferation. When these cells are Gfi1 deficient, they highly proliferate which leads to cellular exhaustion and reduced population in the host BM. These deficient cells are also incapable of sustaining hematopoiesis and mice reconstitution after transplantation (Hock et al., 2004; Zeng et al., 2004). The regulation of this gene is very complex; it seems to be controlled by 5 different transcription factors including Runt-related transcription factor 1 gene (Runx1) and the Gata binding protein 2 (Gata2) (Wilson et al., 2010). In adult HSCs, Runx1 deletion inhibit the production of the lymphocyte progenitors (Growney et al., 2005), whereas Gata2 expression induces a quiescent state in HSCs (Tipping et al., 2009). Moreover, Gata2 is implicated in survival and proliferation of HSCs (Tsai and Orkin, 1997). Both roles seem to be agreeing with the Gfi1 role to restrain HSCs excessive proliferation (Wilson et al., 2010).
The Wnt is a main pathway in HSCs self-renewal. The Wnt signaling pathway is involved in the regulation of the HSCs fate. During hematopoiesis, Wnt is activated and regulates HSCs fate in a dose dependent manner. -catenin is the canonical signaling transducer of this pathway leading to the activation of gene transcription. (Luis et al., 2011; Walasek et al., 2012). The inhibition of Wnt pathway by blocking its receptor (Frizzled) leads to inhibition of
10
cellular growth in vitro and reduce in vivo reconstitution of HSCs (Reya et al., 2003). On the other hand, the overexpression of -catenin can expand the HSCs pool in vitro. Wnt activation can induce the expression of other genes involved in HSCs self-renewal, like Hoxb4 and Notch1. The different regulators involved in the self-renewal of HSC could interact in a hierarchical way. However, during HSC self-renewal, Wnt signaling could have different outcomes depending on the levels of activation which resulted in expansion at intermediates levels and exhaustion at higher levels (Luis et al., 2011). Moreover, Wnt signalling has also been related to ageing, with a reduction in the self-renewal capacity of the HSCs (Florian et al., 2013). The elevated expression of Wnt5a seems to induce HSC ageing, as it induces this process in young HSCs and its haploinsufficiency reduces HSCs ageing. The different outcomes produce by Wnt signaling could be the result of a complex regulation of this pathway.
During hematopoiesis, the Notch pathway plays a role modulating the balance between lineage specificity and self-renewal of HSCs. Constitutive activation of the Notch1 receptor leads to an increase in HSCs numbers due to enhance self-renewal and decrease differentiation. It also favors lymphoid over myeloid lineage formation (Stier et al., 2002). However, this pathway is not essential for hematopoiesis because mice with Notch1 and one of its ligand Jagged1 inactivation can normally survive, and HSCs with Notch1 deficiency can reconstitute irradiated normal or a Jagged1 deficient host after transplantation (Mancini et al., 2005).
The protein, Sonic hedgehog is also involved in HSCs self-renewal. The pathway that it activates can lead to HSC expansion. Shh signaling acts through downstream bone morphogenetic protein (BMP) signaling (Bhardwaj et al., 2001). While BMP-4 can increase the survival of HSCs, the inhibition of BMP-4 can block the expansion induced by Shh signaling. Interestingly, a link placing the Wnt canonical signaling through -catenin downstream of Shh signaling has been made in human myeloid leukemia progenitors (Su et al., 2012).
As discussed above, different regulators are involved in HSCs self-renewal and could be participating together. Shh seems to be place upstream of Wnt which can induce Notch1. The Hox genes also play an important role in HSCs hematopoiesis and self-renewal that will be further discussed. The interactions of different mechanisms controlling the self-renewal of HSCs
11
are very complex. Dysregulation of this balance could lead to diverse hematopoietic malignancies.
2.- Hox genes
Hox genes are characterized by a homeodomain which consist of 183 base pairs coding a helix-loop-helix that allows binding to the DNA (Gehring and Hiromi, 1986; Hill et al., 1989). These genes are known as master transcription factors, they are at the top of the cascade developmental programs and they control the expression of multiple genes. Hox genes control the body plan of the embryo, are highly regulated and have been highly conserved throughout evolution. They were discovered and characterized in Drosophila by their ability to regulate the position identity along the anterior-posterior body axis during development. The Hox genes play key functions in early hematopoietic cells (Alharbi et al., 2013; Argiropoulos and Humphries, 2007; Gehring et al., 1994). Besides, it was shown that, in order for Hox genes to bind its DNA target, they require the action of cofactors (Popperl et al., 1995).
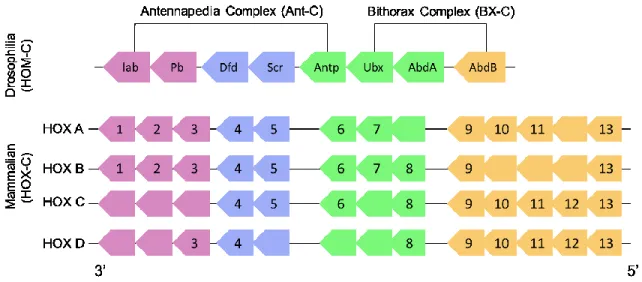
The Hox genes consist of 39 genes in mammals. They are located in 4 chromosomes and divided into 4 clusters known as A, B, C and D (Figure 2). Comparing the composition of these clusters between species, paralogue groups are observed. These paralogues groups are very similar in sequence and redundant in function. There are 13 paralogue groups in mammals. (Alharbi et al., 2013; Argiropoulos and Humphries, 2007; Krumlauf, 1994).
This study will focus on the Hoxb4 gene. Hoxb4 is a member of the HoxB cluster localized on mouse chromosome 11. It is expressed during development and in adult human and mouse hematopoietic stem and progenitor cells. Interestingly, it is down regulated with the differentiation of HSCs (Pineault et al., 2002; Ramirez-Solis et al., 1993).
12
Figure 2.- Schematic representation of Hox genes clusters.
The four Hox clusters (A, B, C and D) contain 8-11 genes. The identical colors represent the paralog groups. Human and Drosophila homologies are also shown by colors. Adapted from: The role of Hox genes in normal hematopoiesis and acute leukemia, Leukemia; and Hox genes in hematopoiesis and leukemogenesis, Oncogene (Alharbi et al., 2013; Argiropoulos and Humphries, 2007). Lab = labial, Pb = proboscipedia, Dfd = Deformed, Scr = Sex combs reduced, Antp = antennapedia, Ubx = Ultrabithorax, Abd = abdominal (A or B).
2.1.- Hox genes in hematopoiesis
In the hematopoietic cells, the Hox genes undergo down-regulation of expression with differentiation and some of them like the HOXB3 and HOXB4 are almost exclusively expressed in the most primitive BM cells (Pineault et al., 2002; Sauvageau et al., 1994). Another example is the HoxA cluster. This cluster is express at higher level in HSCs compared to early progenitors and when its expression is diminished, the maintenance of HSCs is also reduced (Lebert-Ghali et al., 2010).
13
However, it has been difficult to determine the precise role of the Hox genes in hematopoiesis. Single Hox genes mutants cannot always help to determine their role. A reason for this difficulty is that the Hox genes share overlapping function in addition to unique roles. For example, during embryonic development Hoxa3 and Hoxd3 can play the same biological role and they present particular roles when they are quantitatively modulated (Greer et al., 2000).
The role of Hoxb4 in hematopoiesis has been studied extensively. Studies on the Hoxb4 mutant showed that this gene is not necessary for the generation of HSCs during embryogenesis or the definitive hematopoiesis because the animals lacking this gene can normally develop although they have minor alterations (Bijl et al., 2006; Brun et al., 2004; Ramirez-Solis et al., 1993). It has been shown with the double Hoxb3/Hoxb4-deficient mice that HSCs lacking these genes have impaired repopulation capacities and slower cell cycle, demonstrating that both genes are required for the maximal proliferative response (Bjornsson et al., 2003). Moreover, under stress hematopoiesis, like when the HSCs are transplanted into irradiated mice, the capacity of Hoxb4 deficient HSCs to expand and repopulate the niche is reduced (Brun et al., 2004). Indicating that Hoxb4 plays a role in the enhancement of the HSCs self-renewal capacity.
Retroviral overexpression studies in mouse showed that Hoxb4 is a potent enhancer of HSC expansion in vivo and in vitro, without leading to leukemia (Sauvageau et al., 1995). After BM transplantation, the numbers of HSCs are not recovered to normal levels but cells overexpressing Hoxb4 can fully reconstitute the HSC compartment (Thorsteinsdottir et al., 1999). Moreover, the activation of the Wnt pathway leading to an enhancement of HSC self-renewal is associated with increased Hoxb4 expression suggesting that the expansion of HSCs by Wnt is mediated through Hoxb4 (Reya et al., 2003).
The function of Hoxb4 is compensated by the up regulation of genes from other cluster genes, because depletion of Hoxb1-b9 did not affect HSC functional reconstitution of mouse (Bijl et al., 2006). Therefore, other Hox genes could provide similar expansion on HSCs. In the case of Hoxa4 overexpression, the expansion of the cells is unbalanced resulting in higher preferences for lymphoid over myeloid progenitors (Fournier et al., 2012). Hoxc4 overexpression leads to the expansion of human CD34+ hematopoietic cells (Auvray et al., 2012).
14
The Hox genes are linked to the self-renewal program crucial for HSCs. However, high Hox gene expression have been observed in myeloid and lymphoid leukemias, which could be providing the self-renewal capacity to the cancer stem cells (Argiropoulos and Humphries, 2007). The cancer stem cells are able to regenerate the tumor, causing relapse and metastasis. Properties associated to HSCs are also found in cancer stem cells, they possess the ability to self-renew and differentiate into all the cell types that are specifics for the particular tumor or cancer. It has been suggested that signaling pathways controlling the self-renewal are common to both cancer and hematopoietic stem cells (Lobo et al., 2007).
For acute myeloid leukemia (AML) a poor prognosis has been associated with an increased expression of homeodomain transcription factors including Hoxb3, Hoxb4, Hoxa7-11. The overexpression of Hox proteins leads to the expansion of different BM populations. It can cause the block of the differentiation and the generation of myeloproliferation and AML in vivo (Eklund, 2011). Hoxa9 is an example, its overexpression is associated with a very poor leukemic prognosis and it can promote immortalization of HSCs (Brumatti et al., 2013). The homeodomain region of this gene can intrinsically control the transformation from a normal to a leukemic cell. When this homeodomain region is exchanged with the same region in HOXA1, it can induce the aggressive features observed in HOXA9; while realising the opposite experiment leads to a reduction of the aggressiveness (Breitinger et al., 2012).
In T-cell acute lymphoblastic leukemia (T-ALL), chromosome rearrangements lead to the overexpression of oncogenic transcription factors, including Hox genes. Proteins that control developmental checkpoints in early thymocytes are collaborating with these genes that control HSCs self-renewal. The consequence is the increased self-renewal and survival of the abnormal thymocytes (Tremblay et al., 2010). The childhood T-ALL presents another interesting characteristic, the up regulation of -catenin expression in more than 85% of the patients. When this gene is silenced, the cancerous cells become more apoptotic (Ng et al., 2014). As discussed before, the Wnt--catenin pathway plays an important role in HSCs self-renewal and it can induce other genes like Hoxb4 (Luis et al., 2011; Reya et al., 2003; Walasek et al., 2012).
15
2.2.- Modulation of the Hoxb4 effect in HSCs self-renewal
Besides the compensatory effect of the paralog Hox genes, different molecules could be involved in the modulation of Hoxb4 effect in HSCs self-renewal like the signal transducer and activator of transcription 3 (STAT3) and the Co-factors like Pbx1.
The activation of STAT3 can lead to HSCs expansion in a similar way to the expansion induced by Hoxb4 overexpression. However, activating both does not produce an additive effect. In contrast, when Stat3 is inhibited, it can reduce the effect caused by Hoxb4 overexpression. Moreover, Hoxb4 and STAT3 present an overlap in the transcription factors induced in HSCs, including pluripotent genes involved in the maintenance of cellular stemness. Therefore, it seems that in HSCs self-renewal regulation, the effect of Hoxb4 passes through STAT3 and that both factors can play an equivalent role inducing similar outcomes (Hong et al., 2014).
Pbx1 is a homeoprotein of the TALE subfamily that function as a cofactor for Hox proteins modulating their binding to DNA (Chang et al., 1995). It has been shown that reduction of Pbx1 expression, using a retroviral construct with antisense Pbx1, the effect of Hoxb4 overexpression is enhanced. Therefore, Pbx1 could be a negative regulator in this process. Most likely, multiple cofactors act in combination to modulate the Hoxb4 induction of self-renewal in HSCs (Cellot et al., 2007).
As discussed, Hoxb4 can induce HSCs self-renewal without surpassing a normal expansion of the cells. However, the mechanisms controlling HSCs self-renewal are very complex involving several molecules. The interactions of the different mechanisms need to be well controlled to avoid the development of malignancies.
16
3.- Adaptive immunity
To defend the body, innate and adaptive (acquired) immune mechanisms are used. The innate immunity, activated by chemical properties of the antigen (Ag), consists of nonspecific defense like physical barriers, chemicals and cells that attack foreign cells. The adaptive immunity consists of an Ag specific response; in this case, the Ag is processed and recognized, then the cells that are capable of recognition will clear the infection. Very importantly, the adaptive immunity creates memory cells that will be maintained in the body in order to provide a more efficient defence against a subsequent encounter with the specific Ag.
When pathogens like virus and bacteria reinvade the body, the memory cells from the adaptive immunity are activated in order to mount a stronger and faster attack on the recurrent infection. The key for this ability is the immunological memory capable of recognized the antigens expressed by the recurrent invaders (Smith, 2012). The B and T lymphocytes that can recognize and respond to practically any peptide non-self Ag are the basis of this system (Janeway, 2001b). Large repertoires of B and T cell receptors (TCR) are randomly generated, creating a library for the recognition of peptide non-self Ag.
3.1.- Lymphocytes
The lymphocytes are the central players of the adaptive immune system. As all the types of mature blood cells, they differentiate from the HSCs that go through a series of sequential divisions generating intermediates known as precursors, in a process that will end with the formation of particular lineages (Karsunky et al., 2008). The existence of a lymphoid-biased long term HSC (Figure 1) that differentiate to generate all T cells, B cells and NK cells has been proposed (Lensch, 2012).
17
3.1.1.- T Lymphocytes
To become a T cell, lymphocyte precursor cells migrate periodically from the BM and enter the thymus. (Saran et al., 2010; Schwarz and Bhandoola, 2006; Yang et al., 2010). The thymus has a distinctive anatomical organization that allow the entering cells to move in microenvironments perceiving signals that are critical for the development of T cells. Functional T cells capable of recognize non-self Ag but also to be tolerant to self Ag exit the thymus (Starr et al., 2003). These mature cells are CD4 or CD8 T cells called naïve (Tn) because they have not encountered the Ag that they are capable of recognizing through their TCR (Ma et al., 2013; Starr et al., 2003). These mature T cells recirculate through the secondary lymphoid organs in order to encounter their specific Ag which is brought to these organs by the Ag presenting cells (APCs).
The TCR is a disulfide-linked heterodimer of α and β chains. There is a TCR composed of γδ chains, which is less abundant than the αβ TCR but structurally similar. The Ag binding site is compose by 6 complementary determining regions formed by each chain, been 3 α and 3 β chains. A variable and a constant Ig-like domain are the composition of each chain. The variable region is the one that binds the Ag-MHC complex. The constant domain is followed by the transmembrane region and a short cytoplasmic tail. The TCR is expressed at the membrane in a complex with the CD3 chains which are responsible for the signal transmission. The co-receptors CD8 or CD4, via their cytoplasmic domain, are associated with the TCR-CD3 complex. The TCR binds the membrane distal Ag-MHC molecule while simultaneously, the co-receptors CD8/CD4 bind distant to this site and nearest to the membrane, to the invariant domain of the Ag-MHC helping with the process of cell activation (Bhati et al., 2014; Huang et al., 2012; Janeway, 2001a).
The TCR recognize the peptide Ag only when presented by the MHC molecules on the own cells surface, but not the Ag or the MHC alone. For the recognition, TCR requires the help of co-receptors (Huang et al., 2012). The CD8 T cells can recognize the Ag presented by the MHC class I, while the CD4 T cells recognize the Ag presented by the MHC class II (Sprent et
18
al., 2008). The absence of the co-receptor signal impairs the differentiation and activation of the T cells. The co-receptor expressed by each T cell is associated to the action of the T cell. The T cells expressing CD4 are regulatory/helper/inducer T cells while the T cells expressing CD8 are killer/cytotoxic T cells (Mak, 1994).
3.1.2.- T cell activation
The Ag recognition by the TCR can lead to the activation of T cells. The activation of T cells requires three important signals: 1) the recognition of the Ag by the engagement of the TCR to MHC molecules presenting the antigenic peptide, 2) a co-stimulation signal provided by the interaction of the CD28 receptor on the T cells with the costimulatory ligands on the APCs and 3) cytokine stimulation (Mescher et al., 2007).
3.1.2.1.- First signal: TCR engagement
The recognition of the Ag peptide on the MHC by the TCR is the beginning of the T cell signaling. However, the TCR does not have signaling domains and in order to generate a signal, it is coupled with the CD3 complex. The CD3 complex consists of four accessory chains (two ε, one δ, one γ) and the ζ chain, which is a large intracytoplasmic homodimer. This complex is associated with two αβTCR heterodimers in the cell surface (Castro et al., 2014; Janeway, 2001a; Mak, 1994; Smith-Garvin et al., 2009). After TCR engagement with Ag peptide-MHC, the CD3 complex initiates a signaling cascade activating the cells. The CD3 complex has immunoreceptor tyrosine-based activation motifs (ITAMS) that become phosphorylated and recruit other molecules to initiate the signaling cascade (Birnbaum et al., 2014; Guy and Vignali, 2009; Huang et al., 2012; Smith-Garvin et al., 2009). The co-receptors CD4 or CD8, upon association with the MHC, are responsible for the ITAMS phosphorylation required for the T cell activation The lymphocyte-specific protein tyrosine kinase (Lck), a Src family kinase, is associated to the
19
cytoplasmic domains of the co-receptors and phosphorylates the ITAMs of the CD3 complex (Castro et al., 2014; Huang et al., 2012; Janeway, 2001a; Mak, 1994; Smith-Garvin et al., 2009).
3.1.2.2.- Second signal: T cell co-stimulation
For Tn cells, the first signal is not sufficient to induce a complete T cell response. Therefore, other cell surface receptors play an important role in providing the signals needed for activating T cells. T cell anergy (long-lived non-responsive state), deletion or development of immune tolerance are produced when T cell activation occurs without co-stimulation. The CD28 receptor expressed by T cells can robustly provide the co-stimulation signal. It can interact with the co-stimulatory ligands B7-1 (CD80) and B7-2 (CD86) that are present on the surface of activated APCs. The result of this engagement is an increase in the magnitude and the regulation of the response generated by the first signal. On the other hand when this signal is not provided, the ability to respond to some pathogens can be dramatically reduced (Mak, 1994; Mescher et al., 2007; Smith-Garvin et al., 2009).
3.1.2.3.- Third signal: Cytokine stimulation of T cells
Now that the T cells have interacted with the APCs, recognized and respond to the Ag, a third signal is required for Tn cells in order to differentiate, expand and survive. It consists of inflammatory cytokines that can be produced by different cells including the APCs. For CD8 T cells, the cytokines IL-12 and type I interferon (INF-I) have been largely studied for their role, leading to full activation, proliferation and memory generation. The cytokine requirement was evident when CD8 T cells were purified and in vitro stimulated with artificial APCs. CD8 T cells were capable of receiving the first and second signal, but they were not able to fully proliferate; however, the addition of the cytokines IL-12 or INF- leads to a stronger proliferation of the cells. The lack of these cytokines leads to reduction in the cell ability to respond and when both
20
receptors are eliminated, there is no memory generation (Curtsinger et al., 2003; Curtsinger et al., 1999; Curtsinger et al., 2005; Keppler and Aichele, 2011; Mescher et al., 2007). For CD4 T cells, the third signal is very important for making the decision to differentiate into a specific effector type. Common gamma c cytokines are involved in this decision. The common gamma chain is a cytokine receptor sub-unit common for different interleukin receptors including IL-2, IL-4, IL-7, IL-9, IL-15, IL-21. For example: IL-12 and INF-γ are involved in the differentiation of helper T 1 cells, IL-4 and IL-2 in helper T 2 cells, transforming growth factor β and IL-6 in helper T 17 cells, IL-6 and IL21 in follicular helper T cells, IL-2 and transforming growth factor β in regulatory T cells (Dong, 2008; Luckheeram et al., 2012; Yamane and Paul, 2013).
3.2.- CD8 T cell response
Remembering the encountered pathogen leads to enhanced responses after a secondary encounter. The bases for this immunological memory are specialized cells known as memory T (Tm) and B cells. This mechanism has been used to generate a successful vaccination, inducing immunological long-lived protection against specific Ag. (Kaech et al., 2002b).
The journey to generate CD8 Tm cells begins with the CD8 Tn cells exiting the thymus, entering the secondary lymphoid organs including the lymph nodes (LN) in order to scan APCs looking for their specific Ag (Munoz et al., 2014). Notably, LN structure facilitates the contact of CD8 T cells with APCs, providing an important niche for the antigen surveillance and the generation of the immune response (Mandl et al., 2012; Munoz et al., 2014). APCs migrate to the secondary lymphoid organs like the draining lymph nodes after taking the Ag in the infection place (Janeway, 2001a).
During the normal course of an immune response, CD8 Tn cells will encounter a foreign specific Ag that they can recognize and get activated. Three phases of T cell response occur following this activation. The expansion is the first one, the activated Tn cells will expand and differentiate into effector T (Te) cells. CD8 Te cells can release cytokines like INF-γ which
21
directly inhibits viral replication, they can kill target cells that display the specific peptide fragments on MHC-I at the cell surface by secreting perforin and granzymes, and they can also trigger apoptosis in some target cells trough Fas ligand. With this, they eliminate the pathogen within days. The second phase, known as the contraction period, follows the Ag clearance. The majority of the CD8 Te cells die during this period (>90%). The memory phase is the third phase, a few (<10%) CD8 Te cells further differentiate into CD8 Tm cells that will be maintained for life through self-renewal mechanisms (Badovinac et al., 2002; Cui and Kaech, 2010; Harty and Badovinac, 2008; Joshi and Kaech, 2008).
3.2.1.- CD8 Tm cell generation
Following Ag clearance, different CD8 Tm cell populations are generated, although it is still not clear how this process works . Different models of CD8 Tm cell differentiation have been suggested, for example: A) the Tn cells can give rise to Te or directly to Tm cells. B) The Te cells will generate Tm cells after Ag clearance (Kaech et al., 2002b).
Given the heterogeneity of the CD8 Te cells, certain characteristics have been used to try to distinguish which cells will generate CD8 Tm cells. At the peak of the immune response, cells that are proposed to be the memory cells precursors (killer cell lectin-like receptor G1 (KLRG1)
lo/int CD127hi) are present (Gerlach et al., 2011). KLRG1 cells appear during early stages of
infection. The CD8 T cells expressing hi KLRG1 go downregulating IL-7 receptor and become the short-lived effector cells. While the cells with low levels of KLRG1 keep high expression of IL-7 receptor and become the memory precursor effector cells. During the priming of CD8 T cells, inflammatory molecules like IL-2 can instruct the signaling process leading to the choose between memory precursor or short-lived effector cells. IL-2 can dose dependently modulates T-bet. In turn, high levels of T-bet induce high expression of KLRG1 and low levels of T-bet induce low expression of KLRG1 (Joshi et al., 2007). It has been suggested that the acquisition of the memory properties is a progression of events giving rise to the different Te cell populations. During the immune response, Te cells receive different signals like Ag and inflammatory molecules. Differences in the duration and the quantity of these signals, during the
22
different stages of the immune response, can influence the cells decisions between death after Ag clearance or survival and differentiation into Tm cells (Gerlach et al., 2011). Changes in the gene expression between Tn, Te and Tm cells support the notion of progressive differentiation of naïve T cells into Tm cells (Kaech et al., 2002a; Sarkar et al., 2008).
3.3.- Main differences between Tn and Tm cells
The Tm cells, that are generated after Tn cells encounter for the first time their specific Ag and mount an immune response, possess some characteristics that allow them to better respond the next time the Ag is encountered (Joshi and Kaech, 2008; Kaech et al., 2002b).
First, there are few (tens to hundreds of cells per mouse) Tn cells capable of recognizing one specific pathogen. In contrast, the numbers of Ag specific Tm cells exceed the number of Ag specific Tn cells. That is because during the immune response, each Tn cells will divide generating more than 10,000 cells, then less than 10% of these number of cells will survive after the contraction period as Tm cells. This means that there are more cells ready to eliminate the pathogen for the next infection (Harty and Badovinac, 2008).
Second, while Tn cells recirculate through secondary lymphoid organs, Tm cells can also migrate to peripheral sites where pathogens generally enter the body. As Tm cells are present in the sites of infections, this facilitates the encounter with the pathogen (Ebert et al., 2005; Weninger et al., 2001).
Third, for the activation of the CD8 T cells, in contrast with Tn cells, the CD8 Tm cells do not required co-stimulation (Flynn and Mullbacher, 1996).
Fourth, CD8 Tm cells also have an increased sensitivity to Ag compared to Tn cells because they have redistribute their TCR resulting in enriched oligomeric TCR complexes (Kumar et al., 2011). Also, during the immune response, the Tn cells that possess a higher affinity to bind Ag-MHC complexes will selectively respond expanding and generating the Tm
23
cells. Resulting in CD8 Tm cell population expressing TCRs with higher affinity for the Ag-MHC complexes (Busch and Pamer, 1999).
Fifth, compared to Tn cells, Tm cells divided after a shorter time interval and present different effector functions in the same cells (Veiga-Fernandes et al., 2000).
Sixth, CD8 Tm cells are more ready to respond than CD8 Tn cells because they retain some characteristics of CD8 Te cells like the expression of several cytotoxic proteins, chemokines and cytokines. Moreover, comparing their gene expression patterns, CD8 Tm cells are between CD8 Tn and CD8 Te cells, thus sharing some characteristics with both cell types leading to a more rapid response (Goldrath et al., 2004; Holmes et al., 2005; Kaech et al., 2002a; Veiga-Fernandes and Rocha, 2004).
Seventh, with age Tn cell number diminish. On contrary, Tm cells survive for long period providing long-term protection. For example, people vaccinated against smallpox retain the ability to respond after 75 years (Hammarlund et al., 2003; Vescovini et al., 2014).
In summary, the increased number of highly sensitive Ag-specific Tm cells, their anatomical location, their faster division, non-requirement for co-stimulation and their gene expression patterns that facilitates their faster responses, together with their longevity explains why Tm cells provide an enhanced long-term protective immunity compared to Tn cells.
3.4.- CD8 Tm cell populations
The different CD8 Tm cell populations that have been describe include central memory T (Tcm) cells, effector memory T (Tem) cells, memory stem T cells (Tscm), lymphopenia induced homeostatic proliferation (HP) Tm cells and tissue-resident memory T (Trm) cells. Some of the characteristics of these cells are shown in Table 1.
24
3.4.1.- Characteristics of the different CD8 Tm cell populations
The CD8 Tcm cells are preferentially located in lymphoid tissues, and they can strongly proliferate in response to Ag encounter. CD62L and CCR7, which allow efficient homing to secondary lymphoid tissue, are expressed on the surface of these cells and have been used to distinguish them from other Tm populations. CD8 Tcm can better persist in vivo and as they possess an increased proliferation potential, they are more efficient to mediate immunity compare to the Tem cell (Huster et al., 2004; Weninger et al., 2001; Wherry et al., 2003). This was demonstrated by evaluating the ability to rapidly control pathogen growth after transferring the CD8 Tcm or Tem cells in different viral challenge models (Wherry et al., 2003).
The CD8 Tem cells recirculate through blood and spleen and migrate to non-lymphoid tissues. As Tcm, they possess the ability to generate an immediate effector function after Ag encounter. CD8 Tem cells barely express CD62L or CCR7 or not at all (Masopust et al., 2001). IL-7 receptor (CD127) is expressed on their surface as well as on Tcm cells (Huster et al., 2004).
The CD8 Tscm population was identified studying graft-versus-host disease. They are capable of maintaining some characteristics of a Tn phenotype like low expression of the hyaluronan receptor CD44 and high levels of CD62L; in contrast, they express higher levels of stem cell antigen-1 (Sca-1), CD122 and Bcl-2. Tscm are capable of enhanced expansion after Ag-reencounter and it seems that this population is also capable of generating both Tcm and Tem populations (Yu and Anasetti, 2005; Zhang et al., 2005). Gattinoni and collaborators have characterized a human T cell population with the features of Tscm. This cell population can self-renew and differentiate into Tcm, Tem and Te cells (Gattinoni et al., 2011; Gattinoni et al., 2009). Moreover, Cieri and collaborators have found that Tscm accumulate when Il-7 and IL-15 availability is high, their gene expression profile is between Tn and Tcm cells and Tscm can mediate the graft versus host disease (Cieri et al., 2013).
The lymphopenia induced HP Tm cells were identified studding different models like after transferring CD8 Tn cells to T cell depleted host, neonatal models and Ag-free mice
25
(Haluszczak et al., 2009; Hamilton and Jameson, 2008; Hamilton et al., 2006; Kieper and Jameson, 1999; Le Campion et al., 2002; Sprent and Surh, 2011). These cells do not express early activation markers (CD69, CD25, CD71) but they progressively express memory markers (CD44, CD122, Ly6C) with division (Murali-Krishna and Ahmed, 2000). They also acquire the abilities to lyse target cells and secrete INF-. (Cho et al., 2000; Dummer et al., 2002). For CD8 HP Tm cells to acquire these characteristics, CD8 Tn cells need to divide multiple times (Cho et al., 2000). It was proposed that CD8 HP Tm cells can protect the host without interfering with the CD8 Tm cell populations that are normally generated during infection. The CD8 HP Tm cell population can respond to infection but when they are challenged in competition with CD8 Tm cells, CD8 HP Tm cells are less effective and die more quickly (Cheung et al., 2009).
CD8 Trm cells are a distinguishable population of CD8 Tm cells that is established in nonlymphoid organs. In humans, Sathaliyawala and collaborators have characterized the Trm cell populations in lymphoid and mucosal tissues from individual donors. These cells express the activation marker CD69, CD103 which allow them to adhere to E-cadherin and is linked to their homing into epithelial tissues, and they are capable of INF- and IL-2 production after stimulation while the other memory T cell populations do not express CD69 nor CD103 (Sathaliyawala et al., 2013). Another Trm cell population was identified in the murine submandibular glands, which also express CD69 and CD103. Interestingly, after adoptive transfer of these murine Trm cells and rechallenge, they preferentially relocalized into their original tissue (Hofmann and Pircher, 2011). In intestinal epithelium, Trm have been studied by Masopust and collaborators. They found that the Trm cell population did not migrate and rather stay in their tissue. They use two approaches, one was evaluating the migration of Trm cells in mice after transplanting part of the intestine containing Trm cells, the other was evaluating the number of Trm cells after treating mice with FTY720 which induce the accumulation of recirculating lymphocytes into the lymphoid tissue while reducing their presence in other tissues (Masopust et al., 2010). Schenkel and collaborators have proposed that Trm cells serve as local sensor capable of recruiting circulating Tm cells. In the case of female mouse reproductive tract, after rechallenge, they found that CD8 Trm cells can potentiate local response and recruitment of CD8 Tm circulating cells; they also observed the expression of INF- by these cells (Schenkel et al., 2013). In general, we can say that the CD8 Trm cells have distinctive characteristics from
26
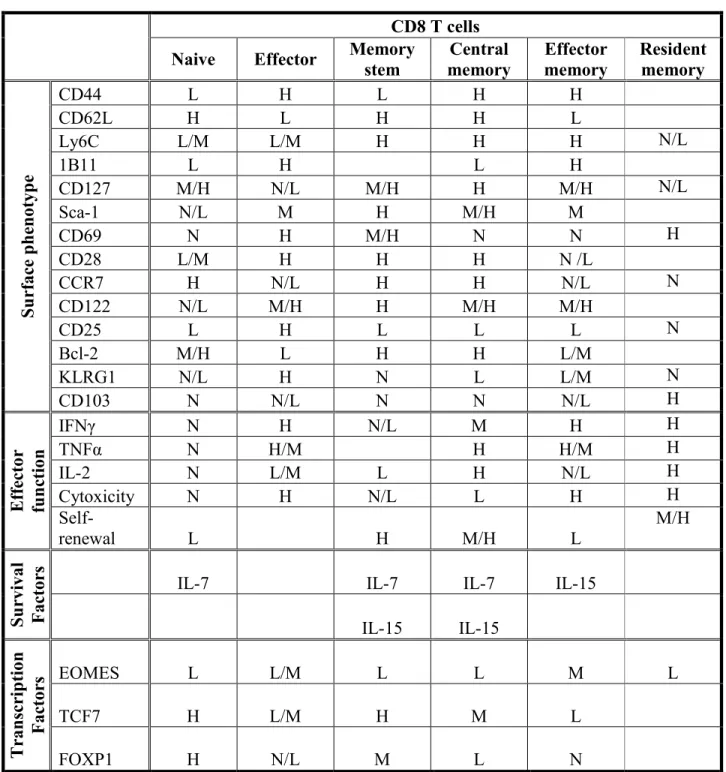
Table 1.- Characteristics of mouse CD8 T cell populations.
CD8 T cells
Naive Effector Memory stem memory Central Effector memory Resident memory
S u rfac e p h en ot yp e CD44 L H L H H CD62L H L H H L Ly6C L/M L/M H H H N/L 1B11 L H L H CD127 M/H N/L M/H H M/H N/L Sca-1 N/L M H M/H M CD69 N H M/H N N H CD28 L/M H H H N /L CCR7 H N/L H H N/L N CD122 N/L M/H H M/H M/H CD25 L H L L L N Bcl-2 M/H L H H L/M KLRG1 N/L H N L L/M N CD103 N N/L N N N/L H E ff ec to r fun ction IFNγ N H N/L M H H TNFα N H/M H H/M H IL-2 N L/M L H N/L H Cytoxicity N H N/L L H H Self-renewal L H M/H L M/H S u rvival Fac tor s
IL-7 IL-7 IL-7 IL-15
IL-15 IL-15 T ran sc rip tion Fac tor s EOMES L L/M L L M L TCF7 H L/M H M L FOXP1 H N/L M L N
Adapted from: Paths to stemness: building the ultimate antitumor T cell, Nat. Rev. Cancer; Anti-viral CD8 T cells and the cytokines that they love, Virology; Memory stem cells sustain disease, Nat. Med.(Cox et al., 2013; Gattinoni et al., 2012; Yu and Anasetti, 2005). N = negative, L = low, M = medium, H = high.
27
other CD8 Tm cell populations, among them, their no recirculation and preferential localization to their specific nonlymphoid organs where they function to locally generate an immune response.
3.4.2.- CD8 Tm cell populations differentiation models
Different models have been proposed to describe the differentiation of the CD8 Tm cell populations. The linear model proposes that CD8 Tn cells differentiate into Te cells and then into Tm cells; after this, the differentiation from Tcm to Tem or the inverse have been proposed. Another model proposed that Tcm and Tem differentiate directly from effector cells (Gerlach et al., 2011; Lefrancois and Marzo, 2006).
Wherry and collaborators support the linear model: Tn Te Tem Tcm differentiation pathway. Using adoptive transfer of Tcm or Tem cell population into naïve host, they show that Tem convert into Tcm in the absence of Ag. They consider the Tcm cells as the “true memory” with the ability to self-renew and to survive long-term. When CD8 Tcm cells are re-exposed to Ag, they rapidly proliferate and generate effector response (Wherry et al., 2003).
The other model suggests that both Tcm and Tem are separate terminal lineages with different capacity to self-renew and home (Lefrancois and Marzo, 2006). Evidence coming from human studies supports this idea, since no conversion between Tcm and Tem was found when following the circulating human repertoire over 9 months (Baron et al., 2003). Another evidence was found by Marzo and collaborators, they did not find conversion from Tem to Tcm or vice versa by studying polyclonal populations of CD62L high or low CD8 Tm cells separately transferred to naïve mice (Marzo et al., 2005).