Accuracy of size distributions obtained from
single particle static digital image analysis.
M. P. GREGOIRE
1, G. DISLAIRE
2, E. PIRARD
11)
GeMMe, Université de Liège, Belgium.
2)
Occhio Instruments, Liège, Belgium.
ABSTRACT
Image analysis has made decisive breakthrough in the recent years to become a reference technique in the field of combined size and shape analysis of particles. Thanks to full automation of the particle dispersion and the individual particle imaging process, productivity of the instrument is no longer a major drawback. However the question of representativity of analyses has not been discussed in statistical terms as should be. Because image analysis is based on the measurement of each individual particle, the accuracy of a size distribution has to be formulated in number of particles and not in terms of sample weight or duration of the analysis. The adequate particle number is linked to the shape of the distribution curve and its extension or range. In this paper, the accuracy of size distributions from image analysis is discussed from a theoretical and practical point of view..
1 INTRODUCTION
Accuracy and representativity of size distributions is rarely discussed because it induces the repetition of a method or a selection of identical samples.. For most size characterization techniques (sieving, laser diffraction,…) the representative amount of material to be submitted to the analysis is at best formulated in terms of minimal sample weight with reference to the pioneering work of Pierre Gy [1].
Since image analysis is based on imaging and analysis of individual particles, this opens the way to an in depth statistical analysis of the results with the capability to remove outliers, to analyze non-standard distributions and to compare results obtained from a subset of particles drawn from the batch. It should be noted that in image analysis the adequate concept is a number of particles to be analyzed rather than a representative sample volume.
This being said, the number of particles is a necessary but not sufficient criterion. Particles are supposed to be selected at random, but because any sampling and dispersion device induces segregation this hypothesis cannot be taken for granted.
Secondly, the number of particles to be analyzed for a given accuracy is dependent upon the parameter to be estimated. The confidence interval of a median cannot be assimilated to the confidence interval of the ninth decile for the same sample size.
In this paper, the influence of particle segregation on size distributions will first be examined. Then, the correct number of particles to be analyzed with respect to a given accuracy for a given parameter will be given extra attention.
The discussion relates to the estimation of a size parameter (inscribed diameter) for both number weighted and volume weighted distributions. Similar
considerations could be developed for the estimation of shape percentiles but this is out of the scope of the present paper.
2 MATERIALS AND METHODS
2.1 Image Analysis
Single particle static image anaysis (SIA) has been performed using the Alpaga 500 Nano instrument (OCCHIO s.a.). This system is based on automated optical microscopy of individual particles using monochromatic collimated backlighting. It uses a 455nm LED to reduce diffraction and achieve a maximal optical resolution of 480 nm per pixel. Considering that a minimum of 3 pixels width are required for adequate sizing of a particle [2] the typical analytical range covered in this study is between 1µm and 150 µm.
The Alpaga instrument is coupled to a vacuum dry powder dispersing chamber (VDD270) that allows to disperse a few milligrams of sample onto a 10 cm circular glass slide. The powder sample is deposited upon a plastic membrane that covers a circular orifice at the top of the cylindrical chamber. Once the vacuum level within the chamber is low enough, the plastic membrane breaks down and particles instantaneously fill in the chamber, gently setting down towards the bottom.
Figure 1: Arbitrary particle and its maximum inscribed
This principle achieves optimal dispersion throughout the whole size range, though it inevitably induces a central symmetry segregation pattern on the glass slide placed at the bottom of the chamber.
Particle image acquisition proceeds by scanning one or more full diametric cross sections of the circular slide. After image analysis each particle is associated to a set of high-level size and shape parameters. For the purpose of this study, only the maximum inscribed disc
diameter (DIN) will be used (fig. 1). It has been shown
in previous work [3] that the DIN of particles resting on
a plane (i.e. under controlled particle orientation) is very robust against poor dispersion and is an adequate predictor of the sieve size distribution.
2.2 Statistical Analysis
Unlike other sizing principles, image analysis makes it possible to build both a size distribution curve weighted by number (N) and a size distribution curve weighted by area (A). Taking the hypothesis that particles have identical flatness ratios, whatever their size, it is even possible to build a size distribution curve weighted by apparent volume (V’). Under such hypothesis, the apparent volume is simply
2 / 3
A
V
′
=
For sake of clarity, the size distribution function by number is designated as pdf-N whereas the size distribution by apparent volume is noted pdf-V. One should be very careful in not confusing both representations and the respective percentiles obtained from each distribution.
The following notation is introduced :
N
D
50 is the median inscribed disk diameterobtained from the number weighted distribution.
V
D
80 is the inscribed disk diameter correspondingto the percentile 80 of the apparent volume weighted distribution.
Due to the perfect correlation with sieve size distributions (for materials of homogeneous density
and flatness ratio throughout the size range), DV
80 can
also be interpreted as a round sieve mesh that allows 80% of the material by weight to flow through.
The accuracy associated to the estimation of any inferred statistical parameter will be expressed as a 95% confidence interval (5% risk of falling outside). This C.I. will be computed from the classical bootstrapping technique [4]. The advantage of the bootstrap method is that is based on sub-sampling of the dataset and does not make any assumption on the shape of the size distribution of the whole population. Consider X a set of N observations :
{
x
x
x
Nx
N}
X
=
1,
2,...
−1,
Consider P the parameter that one wants to infer from this dataset.
Consider X* a bootstrap sample set obtained by drawing S observations from X with replacement. Consider P* the estimator of the P parameter calculated from the bootstrap sample set X*.
By iterating B times the sub-sampling of the set X, we create a set of B bootstrap sample sets and hence a series of B values of P*. The confidence interval associated to the estimation of P with a risk is easily derived from the percentiles at /2 and 1- /2 of this distribution. A typical value for B is equal to 200 for standard error computations and to 500 for confidence interval computations [4].
2.3 Samples
Two powder samples will be used to illustrate the purpose of accuracy computations. The first one is a zinc oxide (ZnO) powder in the range from 1 µm to 70 µm. The second one is a slightly coarser but more calibrated tungsten carbide – cobalt (WCCo) powder ranging from 1 µm to 50 µm.
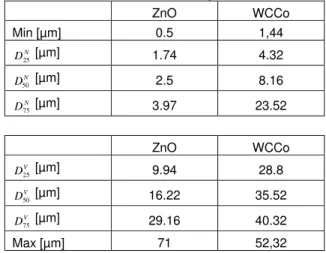
Table 1 presents the quartiles obtained for each powder, both in number and in apparent volume. The
full datasets contain respectively NZnO = 85000
particles and NWCCo = 40000 particles. This amount of
data is typically acquired within 2-3 minutes.
Tab. 1: Quartiles in number and in volume computed
from inscribed disc diameters (DIN)for the two powders
used in this study.
ZnO WCCo Min [µm] 0.5 1,44 N D25 [µm] 1.74 4.32 N D50 [µm] 2.5 8.16 N D75 [µm] 3.97 23.52 ZnO WCCo V D25 [µm] 9.94 28.8 V D50 [µm] 16.22 35.52 V D75 [µm] 29.16 40.32 Max [µm] 71 52,32
3 RESULTS
A first bootstrap analysis has been performed in order to evaluate the influence of particle segregation on the
estimation of DV
50. Therefore, a series of B=500 sample
subsets containing S=10000 particles each have been drawn from the total set of 85000 ZnO particles. This has been done in two ways : the first one is sequential (i.e. following the order of occurrence of particles in the dataset); the second one is at random (i.e. selecting particles at random within the full dataset). Results are illustrated in figure 2 for a 90% confidence interval.
1 2 3 4 5 6 7 8 number of sub-sample 10 15 20 25 30 35 40 45 D V 50 [µ m ] random sampling order of acquisition Median; Box: 25%-75%; Wiskers: 5%-95%
Figure 2: DV
50and its 90% confidence interval obtained
both from sequential and random sampling of 10000 particles within the ZnO dataset.
A second bootstrap analysis has been conducted in
order to obtain confidence intervals for DV
50 from 200
drawn at random within both datasets. The number of
particles forming the subsets were respectively SZnO=
5000 and SWCCo = 1000.
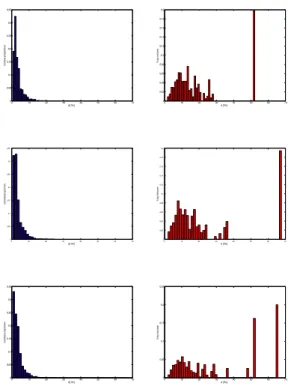
Figure 3 displays the histograms relative to the
statistical distribution of the 500 DV
50 values obtained
for both powders. The corresponding extrema and average values are shown in table 2.
11,7100 12,826413,942915,059316,175817,292218,408719,525120,641621,758022,874523,990925,107426,223827,340328,4567 DV 50 [µm] 0% 3% 5% 8% 10% 13% 15% 18% 20% P ou rc en ta ge d 'o bs .
Var1: N = 200; Moy. = 16,1232; Ec-T. = 2,8083; Max = 28,4567; Min = 11,71
32,640 33,02433,40833,79234,17634,56034,94435,32835,71236,09636,48036,86437,24837,63238,01638,400 DV50 [µm] 0% 3% 5% 8% 10% 13% 15% 18% 20% P ou rc en ta ge d 'o bs .
Ech.2: N = 200; Moy. = 35,5162; Ec-T. = 1,0191; Max = 38,4; Min = 32,64
Figure 3: Histograms of DV
50 values obtained from 200
subsets of the ZnO powder with SZnO = 5000 (left)
and the WCCo powder SWCCo = 1000 (right).
Table 2: Extreme and mean values obtained for 500
estimations of DV 50 (fig. 3) ZnO WCCo Min [µm] 11.71 32.64 Mean [µm] 16.12 35.52 Max [µm] 28.46 38.4
In order to better understand the variability of the size distributions observed from the different bootstrap sets, both the number weighted pdf-N and apparent volume weighted pdf-V curves corresponding to the extreme
values of DV
50 are provided in figures 4 and 5.
0 10 20 30 40 50 60 70 0 0.05 0.1 0.15 0.2 0.25 0.3 0.35 d [?m] nu m be r p ro po rt io n 0 10 20 30 40 50 60 70 0 0.02 0.04 0.06 0.08 0.1 0.12 0.14 0.16 0.18 0.2 d [?m] % by Vo lu m e 0 10 20 30 40 50 60 70 0 0.05 0.1 0.15 0.2 0.25 0.3 0.35 d [?m] nu m be r p ro po rtio n 0 10 20 30 40 50 60 70 0 0.05 0.1 0.15 0.2 0.25 d [?m] % by vo lu m e 0 10 20 30 40 50 60 70 0 0.02 0.04 0.06 0.08 0.1 0.12 0.14 0.16 0.18 0.2 d [?m] % by vo lu m e 0 10 20 30 40 50 60 70 0 0.05 0.1 0.15 0.2 0.25 0.3 0.35 d [?m] nu m be r p ro po rt io n
Figure 4: Central (middle) and extreme (top and bottom) size distribution curves in number (left) and in
apparent volume (right) obtained for
SZnO = 5000 particles drawn at random.
0 10 20 30 40 50 60 70 0 0.02 0.04 0.06 0.08 0.1 0.12 0.14 0.16 0.18 0.2 d [?m] nu m be r p ro po rt io n 0 10 20 30 40 50 60 70 0 0.01 0.02 0.03 0.04 0.05 0.06 0.07 d [?m] % by Vo lu m e 0 10 20 30 40 50 60 70 0 0.01 0.02 0.03 0.04 0.05 0.06 0.07 0.08 d [?m] % by vo lu m e 0 10 20 30 40 50 60 70 0 0.05 0.1 0.15 0.2 0.25 d [?m] nu m be r p ro po rt io n 0 10 20 30 40 50 60 70 0 0.05 0.1 0.15 0.2 0.25 d [?m] nu m be r p ro po rt io n 0 10 20 30 40 50 60 70 0 0.01 0.02 0.03 0.04 0.05 0.06 0.07 0.08 d [?m] % by vo lu m e
Figure 5: Central (middle) and extreme (top and bottom) size distribution curves in number (left) and in
apparent volume (right) obtained for SWCCo =1000
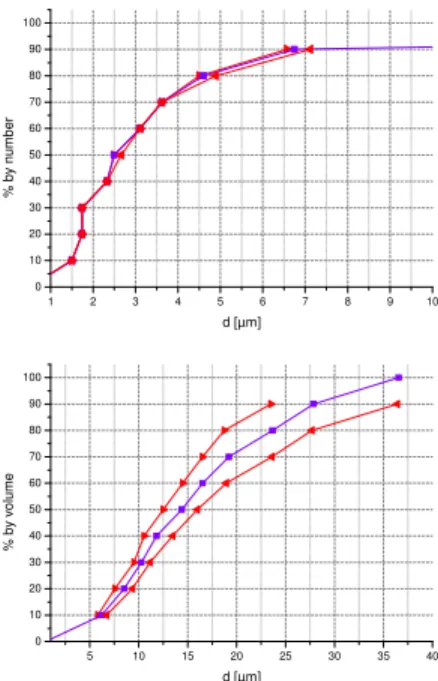
Results obtained from bootstrapping and subsequent computation of the different percentiles for both pdf-N and pdf-V, can best be viewed as confidence intervals relating to a size distribution curve. Figures 6 displays results for the ZnO powder, whereas figure 7 relates to the WCCo powder.
0 10 20 30 40 50 60 70 80 90 100 1 2 3 4 5 6 7 8 9 10 d [µm] % b y nu m be r 0 10 20 30 40 50 60 70 80 90 100 5 10 15 20 25 30 35 40 d [µm] % b y vo lu m e
Figure 6: Size distribution by number (top) and by apparent volume (bottom) for the ZnO powder. The
most probable size distribution is shown by ( ) whereas ( ) indicates the 95% confidence interval.
0 10 20 30 40 50 60 70 80 90 100 0 5 10 15 20 25 30 35 40 45 d [µm] % b y nu m be r 0 10 20 30 40 50 60 70 80 90 100 15 20 25 30 35 40 45 d [µm] % b y vo lu m e
Figure 6: Size distribution by number (top) and by apparent volume (bottom) for the WCCo powder. The most probable size distribution is shown by ( ) whereas ( ) indicates the 95% confidence interval.
4 DISCUSSION
The use of bootstrapping on a very large dataset proves very useful in order to reveal the importance of segregation during powder dispersion. Although this study refers to a specific vacuum disperser it should be noted that any dispersing device induces segregation. It is essential for image analysis, as well as for laser diffraction, not to stop the analysis without being sure to have scanned the whole sample. When using a vibrating feeder or any linear flowing device it is essential that the last particle has the same probability to be measured than the very first one.
When using a cylindrical chamber, it is recommended to complete at least a full diametric cross section. Hence, in practice, the analysis should be stopped when the desired accuracy is reached if and only if a full section through the segregation pattern has been completed.
The comparison between number and apparent volume weighted distributions gives insights into particulate material properties that are worth considering with more attention. The ZnO powder has more than 90% of its particles below 7µm, but these represent less than 15% in the total weight!
Volume weighted distributions are obviously very
sensitive to extreme values as one passes from DIN to
(DIN)3! A poorly calibrated powder such as the ZnO one
shows therefore large confidence intervals for its DV
80,
whereas the better calibrated WCCo powder reaches
its largest confidence interval for DV
50.
5 CONCLUSION
Fully automated static digital image analysis of particles is unique in that it opens the way to exploratory data analysis. Particle size distributions can be displayed by number as well as by apparent volume. They can be filtered with respect to outliers (extreme values) that very often mask the true size distribution by inducing instability and error in percentile estimations.
Finally, image analysis is unique in that it allows from simple bootstrapping to provide the user with confidence intervals for the size distribution curve.
REFERENCES
[1] P. Gy. 1954. Echantillonnage pour une analyse
granulométrique. Annales des Mines IV, 37-42.
[2] Pirard, E., and Dislaire, G., 2005, Robustness of
Planar Shape Descriptors of Particles, Proc. Xth Annual
Conf. Int. Assoc. Math. Geol., Toronto
[3] Pirard, E., Vergara, N., and Chapeau, V., 2004, Direct estimation of sieve size distributions from 2-D image analysis of sand particles, Proc. Partec Conf., Nürnberg.
[4] Efron, B. and Tibshirani, R. J., 1993, An introduction to the Bootstrap. London, Chapman & Hall, 436p.