Université du Québec
Institut national de la recherche scientifique Centre Eau Terre Environnement
ÉVALUATION DE LA PERFORMANCE D’UN CHAMP DE FORAGES
GÉOTHERMIQUES
Par Nehed Jaziri
Mémoire présenté pour l’obtention du grade de Maître en sciences de la Terre
Jury d’évaluation
Président du jury et Michel Malo
Examinateur interne INRS-ETE
Examinateur externe François Mathieu Potvin Université Laval
Directeur de recherche Jasmin Raymond INRS-ETE
Codirecteur de recherche John Molson Université Laval
REMERCIEMENTS
J’aimerais d’abord exprimer ma plus sincère gratitude à mon directeur de recherche, le professeur Jasmin Raymond, qui m’a permis de découvrir le domaine passionnant qu’est la géothermie. Sa direction, ses conseils précis, sa disponibilité et sa motivation m’ont aidé ces deux dernières années à réaliser ce travail. Sa détermination et son sens analytique font de lui un professeur passionné très inspirant. Merci pour votre temps consacré à moi, votre patience et vos encouragements.
Je remercie également mon codirecteur de recherche, le professeur John Molson. Il a été généreux de son temps et n’hésitait pas à répondre à mes courriels et me faire de longues explications. Sa vaste expérience en recherche et ses nombreux conseils, surtout en hydrogéologie, m’ont grandement aidé à progresser et réaliser ce projet.
Je tiens à remercier aussi les autres membres de jury, soient les professeurs Michel Malo, et François Mathieu Potvin pour le temps consacré à l’évaluation de ce travail.
Je tiens à remercier également tout le personnel de la division du développement durable chez GBi à Mirabel et spécialement mes superviseurs Maxime Boisclair et Jérôme Plante pour leur encouragement et leur soutien technique et moral.
Je tiens aussi à remercier le personnel de la Commission scolaire des Patriotes et plus précisément l’ingénieur Jean-Francois Rondeau pour le temps qu’il a consacré à ce projet, en répondant à mes questions et mes courriels avec des documents très utiles. Un remerciement spécial et reconnaissant pour Nicoló Giordano pour ses explications précieuses, son support inconditionnel dans la modélisation numérique et tout le temps qu’il m’a offert pour m’aider dans mon projet.
J’aimerai finalement adresser mes gratitudes les plus sincères à l’INRS dont le milieu de formation est des plus stimulants. Ce projet a été soutenu par une bourse BMP Innovation du CRSNG et du FRQNT en partenariat avec GBi et la Commission scolaire des Patriotes.
RÉSUMÉ
Les systèmes de pompes à chaleur géothermique sont couramment installés dans les bâtiments institutionnels. Ils offrent des économies d’énergie avantageuses et permettent de réduire les émissions de gaz à effet de serre. L’école Carignan-Salières, située sur la rive sud de Montréal, est un exemple de bâtiment muni d’un système de pompes à chaleur géothermique fonctionnel depuis 2013 et qui assure les besoins en chauffage et en climatisation. Ce dernier fonctionne sous des conditions variables d’écoulement d’eau souterraine à cause de sa localisation à proximité de deux carrières où l’eau est irrégulièrement pompée dans l’une de celles-ci. Les forages aménagés pour les échangeurs de chaleur ont été remplis de sable d’olivine puisque l’écoulement souterrain a rendu difficile le colmatage des forages avec un coulis. L’objectif de ce travail est d’évaluer la performance des échangeurs de chaleur à long terme, tout en mettant en évidence l’impact du choix des matériaux de remplissage des forages et de l’écoulement d’eau souterraine sur les transferts thermiques au niveau du sous-sol.
Un test d’injection de chaleur a été réalisé dans le but d’évaluer la réponse thermique de tout le champ de forages géothermiques. Les données enregistrées ont permis de développer un modèle préliminaire simple, à travers lequel la conduction de chaleur dans le sous-sol a été simulée pour évaluer la température d’opération des échangeurs de chaleur géothermique durant 20 ans. Les résultats ont montré que les matériaux de remplissage des forages ont un impact mineur sur la performance du système par rapport à l’impact que peut avoir la conductivité thermique apparente du sous-sol.
Un deuxième modèle simulant les transferts de chaleur par convection dans le sous-sol a été développé selon la méthode des d’éléments finis. Des mesures en laboratoire de la conductivité thermique du roc ont permis de mieux définir ce paramètre dans le modèle numérique. Les trente-et-un forages géothermiques ont été représentés avec des éléments 1D, superposés aux éléments 3D qui constituent le sous-sol formé de shales et calcarénites de la Formation de Nicolet dans les Basses-Terres du Saint-Laurent. Le modèle numérique, calibré avec les données du test d’injection de chaleur, a été utilisé pour simuler des scénarios d’opération du système géothermique sous différentes conditions d’écoulement d’eau souterraine liées au pompage de la carrière avoisinante.
Le gradient hydraulique, imposé par le biais de charges hydrauliques constantes aux frontières du modèle, a un impact important sur la performance du système géothermique. Lorsque le débit spécifique dans l’aquifère est supérieur à 2×10⁻⁷ m3 s-1,
ce qui correspond à la situation actuelle où l’eau souterraine est pompée de la carrière avoisinante, la température minimale à la sortie des échangeurs de chaleur pour une durée de 20 ans se situe au-delà 5 °C. Lorsque le débit spécifique dans l’aquifère est de 6×10⁻⁸ m3 s-1, ce qui représente des conditions pour lesquelles le pompage de l'eau est
arrêté ou diminué dans la carrière, la température minimale du fluide caloporteur à la sortie des échangeurs de chaleur s’approche toutefois de -3°C alors que le point de congélation du fluide caloporteur est -10 °C. L’écoulement d’eau souterraine accrue a présentement un effet bénéfique sur l’opération du système géothermique de l’école Carignan-Salières. Un suivi de la température d’opération du système géothermique est recommandé dans le cas où le pompage de l’eau dans la carrière avoisinante est arrêté définitivement.
TABLE DES MATIÈRES
REMERCIEMENTS ... ii
RÉSUMÉ ... iii
TABLE DES MATIÈRES ... v
LISTE DES TABLEAUX ... vii
LISTE DES FIGURES ... ix
LISTE DE la nomenclature ... xi
1 Introduction ...14
2 Problématique ...15
3 Objectifs ...17
4 Historique et synthèse des travaux antérieurs ...18
5 Caractéristiques du système de pompes à chaleur géothermique de l’école Carignan-Salières ...21
6 Contexte géographique et géologique de la région ...22
1 Premier Article ...27
PERFORMANCE EVALUATION OF A GROUND-COUPLED HEAT PUMP SYSTEM WITH A HEAT INJECTION TEST ANALYSIS ...27
1.1 Introduction ...29
1.2 Site Setting ...30
1.3 Methodology ...31
1.3.1 Heat Injection Test ...31
1.3.2 GCHP simulation ...32
1.3.3 Building load simulation ...34
1.4 Results ...35
1.4.1 Simulation of the heat injection test and calibration of the model ...35
1.5 Conclusions ...40
2 Deuxième Article ...42
LONG-TERM EVALUATION OF the OPERATING TEMPERATURE in A LARGE-SCALE GROUND-COUPLED HEAT PUMP SYSTEM UNDER VARIABLE GROUND WATER FLOW CONDITIONS ...42
2.1 Introduction ...44
2.2 Description of the site ...45
2.2.1 Geological and hydrogeological setting ...46
2.2.2 Ground eat Exchangers Field characteristics ...47
2.3 Methodology ...49
2.3.1 Field work ...49
2.4 GCHP System simulation ...51
2.4.1 Governing equations ...52
2.4.2 Model geometry and properties ...54
2.4.3 Initial and boundary conditions ...55
2.4.4 Model calibration ...57
2.5 Results ...58
2.5.1 Field data analysis ...58
2.5.2 GCHP System simulation...62
2.6 Discussion and conclusions ...70
Références ...78
LISTE DES TABLEAUX
Article 1
Table 1-1. Constant GHE parameters used for all simulations with HyGCHP. ...34 Table 1-2. Range of subsurface and borehole parameters identified with calibration simulations. ...36 Table 1-3. Scenarios used for GCHP simulations and saved energy. ...40
Article 2
Table 2-1. Constant parameters used in simulations. ...58 Table 2-2. Scenarios considered to calculate the hydraulic gradient near the school site as a function of hydraulic conductivity and annual net recharge. ...61 Table 2-3. Average thermal conductivity measured with a needle probe and the MTPS method ...61 Table 2-4. Range of parameter uncertainty in the calibration simulations. ...63 Table 2-5. Scenarios considered for GCHP system simulation at the Carignan-Salières school building. ...66
LISTE DES FIGURES
Introduction
Figure 1. Nombre de pompes à chaleur installées entre 1990 et 2013 au Canada (Raymond et
al., 2015, Tanguay, 2014). ...15
Figure 2. Photo de l’école Carignan-Salières. ...15
Figure 3. Localisation de l'école Carignan-Salières par rapport aux deux carrières. ...17
Figure 4. Plan d’aménagement des puits de l’école Carignan-Salières. ...22
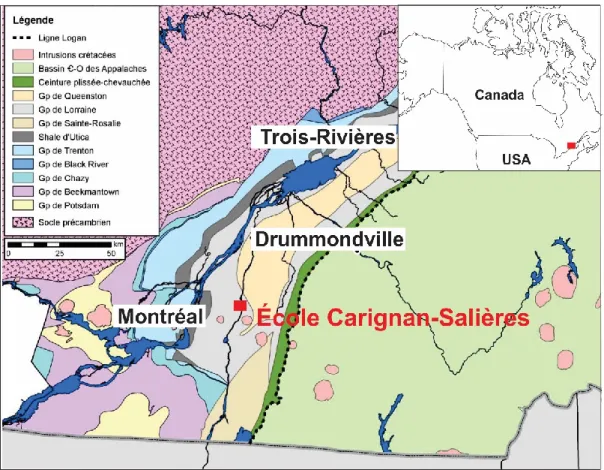
Figure 5. Carte géologique des Basses-Terres du Saint-Laurent et localisation de l’école Carignan-Salières (Comeau et al., 2004, Globensky, 1987). ...24
Figure 6. Colonne stratigraphique des Basses-Terres du Saint-Laurent (Comeau et al., 2004, Globensky, 1987). ...25
Article 1 Figure 1-1. Location of the Carignan-Salières School building with respect to the surrounding quarries. ...31
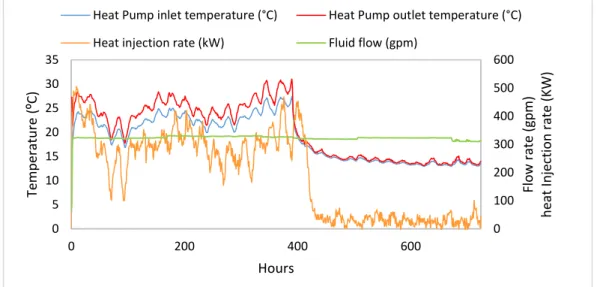
Figure 1-2. Fluid temperature and flow rate recorded during the heat injection test at the Carignan-Salières School. ...32
Figure 1-3. Measured and simulated water temperature entering the heat pumps. ...36
Figure 1-4. Heating and cooling loads for the Carignan-Salières school building. ...37
Figure 1-5. Simulated water temperature at the entrance of the heat pumps for twenty years of operation under a) the basic, b) the pessimistic and c) the optimistic scenarios. ...38
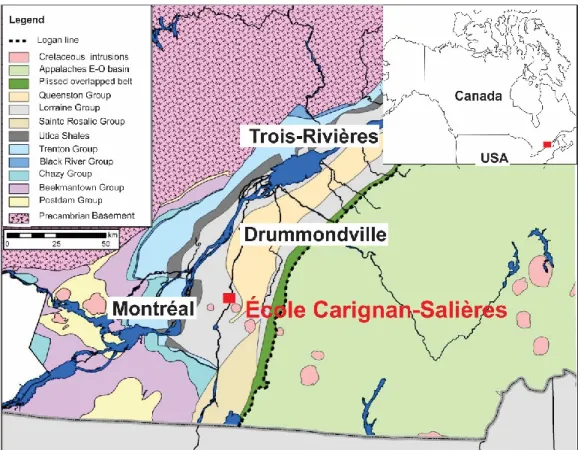
Article 2 Figure 2-1. Geological map of the area showing the position of the Carignan-Salières elementary school (Bédard et al., 2016). ...46
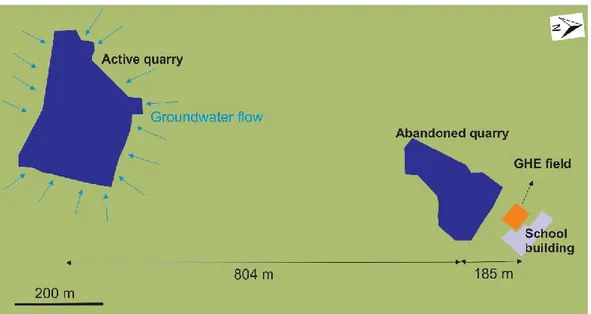
Figure 2-2. Satellite image of the Carignan-Salières school building and neighbouring quarries. ...47
Figure 2-3. GHE field of the Carignan-Salières elementary school. ...48
Figure 2-4. Plan view of the triangular prismatic mesh with details on the discretization around the thirty-one GHEs. The red rectangle show the enlarge zone in Figure 16. ...55
Figure 2-5. Plan view of the triangle prismatic mesh with details on the discretization detail around two GHEs. ...55
Figure 2-6. 3D model showing the boundary conditions and initial temperature for each layer. .57 Figure 2-7. Conceptual model of the GHE field at the Carignan-Salières elementary school. ....59
Figure 2-9. Simulated heating and cooling loads imposed to the GHE field of the school building calculated with eQuest from January (0 d) to the end of December (365 d). ...63 Figure 2-10. Best match between measured and simulated GHE outlet temperature. ...64 Figure 2-11. Simulated GHE inlet and outlet temperatures for twenty years of operation at the Carignan-Salières school building according to different subsurface scenarios. ...67 Figure 2-12. One-year propagation of thermal perturbation during the middle of the cooling season on mid-summerin the case of a low hydraulic gradient (Scenario G). ...68 Figure 2-13. One-year propagation of thermal perturbation during the middle of the cooling season on mid-summerin the case of a high hydraulic gradient (Scenario H). ...68 Figure 2-14. One-year propagation of thermal perturbation during the end of the heating season on March the 31st in the case of a low hydraulic gradient (Scenario G). ...69 Figure 2-15. One-year propagation of thermal perturbation during the end of the heating season on March the 31st in the case of a low hydraulic gradient (Scenario H). ...69
LISTE DE LA NOMENCLATURE
Nomenclature
c [J kg-1 K-1] : capacité thermique spécifique
COP [-] : Coefficient de performance C [-] : facteur de correction d [m] : diamètre du tuyau D [m] : diamètre du forage h [m]: charge hydraulique H [W m-3] : source de chaleur K [m s-1] : conductivité hydraulique P [W] : puissance
P [kW] : taux d’injection de chaleur q’ [m3 s-1] : débit volumique
q [m s-1] : flux de Darcy Q [m3] : source d’eau externe
R [m K W] : résistance thermique
Ss [m-1] : coefficient d’emmagasinement spécifique
S [m] : surface d’échange spécifique T [ºC] : température
u [kg m-1] : vecteur de masse volumique
Symboles grecques ε [-] : fraction volumique
ρ [kg m-3] : masse volumique
ʌ [W m-2 K-1] : tenseur de dispersion hydrodynamique pour le transfert de chaleur
λ [W m-1 K-1] : conductivité thermique
Indices et exposants
EOB : Oberbeck-Boussineq approximation f : fluide caloporteur
fig : interaction entre paroi interne du tuyau et matériaux de remplissage fog : interaction entre parois externe du tuyau et matériaux de remplissage g : matériaux de remplissage
gg : échange thermique au sein des matériaux de remplissage gs : échange thermique entre le sol et les matériaux de remplissage gw : eau souterraine
i : interne o : externe
r : fluide caloporteur s : surface
1 INTRODUCTION
Lors de la dernière décennie, les émissions croissantes des gaz à effet de serre et les coûts grandissants associés au chauffage et à la climatisation des bâtiments ont mené l’industrie à chercher des sources d’énergie autres que l’électricité et les hydrocarbures. L’énergie géothermique, emmagasinée dans le sous-sol, est devenue une alternative tangible pour le chauffage des bâtiments institutionnels, commerciaux et industriels, surtout en climat tempéré où les besoins en chauffage et climatisation sont importants. Les systèmes de pompe à chaleur géothermique offrent un meilleur rendement énergétique que les systèmes conventionnels utilisés pour le chauffage et la climatisation des bâtiments. En effet, les systèmes géothermiques permettent d’extraire et d’injecter de l’énergie thermique dans le sous-sol. En hiver, le sous-sol fournit une partie de l’énergie thermique pour le chauffage et, en été, il est le récepteur de cette chaleur pour la climatisation. La pompe à chaleur géothermique, qui sert à déplacer cette énergie thermique, permet de réaliser des économies de chauffage et de climatisation de l’ordre de 50 à 60 %.
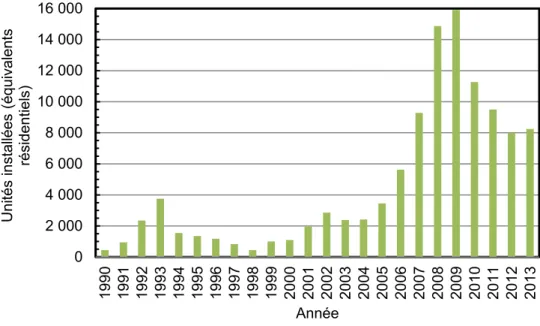
L’industrie géothermique a connu une croissance surprenante au cours des dernières années (Figure 1). Le marché de la géothermie au Canada s’est amplifié de 40 % entre 2006 et 2008. Un pic de 15 913 unités installées a été atteint en 2009 grâce à des subventions du gouvernement à un moment de forte augmentation du prix des hydrocarbures (Raymond et al., 2015).
L’école Carignan-Salières (Figure 2) de la Commission scolaire des Patriotes en Montérégie est un exemple de bâtiment institutionnel utilisant cette technologie. Un système géothermique à boucle fermée avec des échangeurs de chaleur verticaux aménagés dans des forages a été installé en octobre 2013 afin d’assurer les besoins de chauffage et de climatisation du bâtiment. Ce système est toutefois opéré dans des conditions d’écoulement d’eau souterraine variables et les échangeurs de chaleur n’ont pas été scellés par un coulis géothermique.
Figure 1. Nombre de pompes à chaleur installées entre 1990 et 2013 au Canada (Raymond et al., 2015, Tanguay, 2014).
Figure 2. Photo de l’école Carignan-Salières.
2 PROBLÉMATIQUE
Lors de la construction de l’école Carignan-Salières et de l’aménagement du système de pompes à chaleur géothermique, les forages ont intercepté des unités de roc fracturé qui laissaient entrevoir un écoulement d’eau souterraine important. Les ingénieurs de l’entreprise GBi, au moment de la conception du système, avaient prévu l’installation d’un
0 2 000 4 000 6 000 8 000 10 000 12 000 14 000 16 000 19 90 19 91 19 92 19 93 19 94 19 95 19 96 19 97 19 98 19 99 20 00 20 01 20 02 20 03 20 04 20 05 20 06 20 07 20 08 20 09 20 10 20 11 20 12 20 13 Uni tés ins tal lée s (éq ui val en ts rés ide nti el s) Année
coulis géothermique pour sceller les forages. Celui-ci devait être formé de 84.6 % de sable, 15.4 % de bentonite et la balance d’eau afin d’obtenir une conductivité thermique de 1.64 W m-1 K-1 (0.951 btu h-1 ft-1 ºF-1).
Lorsque le foreur a essayé de remplir les forages avec le coulis, l’écoulement d’eau souterraine a entrainé les fines particules de coulis qui se sont dissipées dans les fractures des formations géologiques. Par conséquent, l’entrepreneur en forage chargé d’aménager les échangeurs de chaleur a décidé de remplir les forages avec du sable d’olivine de granulométrie grossière, ce qui n’était pas prévu. Les matériaux de remplissage peuvent avoir un impact sur la performance des échangeurs de chaleur. L’entreprise GBi et la Commission scolaire des Patriotes qui gère l’école désiraient connaître l’impact de cette modification apportée au remplissage des forages, notamment sur les économies d’énergie qui dépendent de la performance des échangeurs de chaleur.
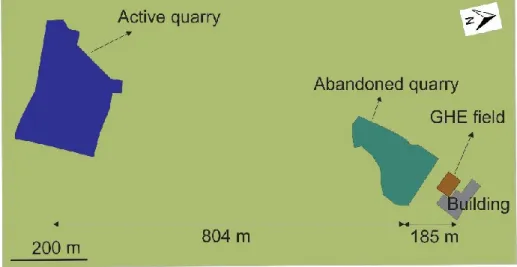
Par ailleurs, l’école Carignan-Salières est construite à côté d’une première carrière abandonnée et d’une seconde carrière active où l’eau souterraine est pompée de façon irrégulière (Figure 3). Le régime d’écoulement souterrain variable pourrait aussi avoir une influence directe sur la performance du système géothermique responsable du chauffage et de la climatisation du bâtiment. L’écoulement d’eau souterraine a généralement un effet bénéfique sur la performance d’un champ de forages géothermiques, mais qu’arrivera-t-il au système si la carrière ferme et le débit d’écoulement d’eau souterraine diminuent à l’endroit des forages?
En outre, deux tests de réponse thermique (TRT) ont été réalisés par des firmes privées dans le but de mesurer la conductivité thermique du sous-sol. Un premier TRT a été achevé juste avant l’aménagement des échangeurs de chaleur et a indiqué une conductivité thermique globale égale à 2.58 W m-1 K-1 (Leblanc, 2012). Un deuxième
TRT, réalisé après l’installation des forages géothermiques, a indiqué une conductivité thermique globale égale à 2.27 W m-1 K-1 (Renaud,2013). La différence de conductivité
thermique effective obtenue entre les deux essais pourrait être causée par l’écoulement d’eau souterraine dont l’intensité varie avec le pompage intermittent de l’eau dans la
Ce projet de recherche est important pour l’industrie géothermique, car il permettra d’améliorer la compréhension des phénomènes de transfert thermique qui affectent l’opération des systèmes et l’évaluation de leur performance dans des conditions d’écoulement d’eau souterraine variables. Ce type d’évaluation des performances est généralement effectué à l’échelle d’un seul forage, alors que cette fois il a été effectué pour l’ensemble du champ d’échangeurs de chaleur puisque le système est fonctionnel depuis 2013 et l’accès aux différentes composantes de façon séparée est restreint.
Figure 3. Localisation de l'école Carignan-Salières par rapport aux deux carrières.
3 OBJECTIFS
Ce projet de maîtrise a pour objectif général d’évaluer l’impact des matériaux de remplissage et de l’écoulement d’eau souterraine variable sur la performance du champ de forages géothermiques de l’école Carignan-Salières pour une période d’opération prolongée, soit 20 ans.
Pour cela, les objectifs spécifiques sont les suivants :
-Évaluer la réponse thermique de l’ensemble du champ de forages géothermiques sur une courte durée;
-Reproduire la température d’opération observée à l’aide d’un modèle simple de transfert thermique par conduction de chaleur dans le sous-sol afin d’évaluer l’impact de longue durée sur les économies d’énergie;
-Reproduire la température d’opération observée à l’aide d’un modèle numérique de transfert thermique par conduction et advection dans le sous-sol afin d’évaluer l’impact de longue durée sur la température d’opération du système;
-Recommander de meilleures pratiques d’opération pour les systèmes géothermiques soumis à un écoulement d’eau souterraine variable.
4 HISTORIQUE ET SYNTHÈSE DES TRAVAUX ANTÉRIEURS
L’installation des premiers systèmes de pompes à chaleur géothermique a débuté lors des années 1950 (Coalition canadienne de l'énergie géothermique, 2010). Un nombre sommaire de travaux réalisés sur les systèmes géothermiques et pertinents pour ce projet de maîtrise sont revus ici. Smith (1956) est l’un des premiers auteurs qui décrit des essais expérimentaux ayant permis de distinguer les facteurs qui influencent directement la performance des forages géothermiques, comme les caractéristiques thermo-physiques du sous-sol. Des travaux récents ont quant à eux mis en lumière l’impact de l’hétérogénéité du sous-sol et de l’écoulement d’eau souterraine sur la réponse thermique de champs d’échangeurs de chaleur (Barla et al., 2015, Bauer et al., 2009, Dehkordi et al., 2014, Ferguson, 2015, Fujimoto et al., 2011) et de forages simples lors de l’analyse des TRT (Raymond et al., 2013).
Des développements importants au niveau de la simulation des systèmes de pompes à chaleur géothermique ont été réalisés par Hellström (1991) qui a étudié dans sa thèse de doctorat la réponse thermique des échangeurs de chaleur aménagés dans les forages. Il a, entre autres, développé des équations mathématiques qui permettent d’estimer la résistance thermique des forages et du sous-sol. Ces équations ont été utilisées dans la première partie du mémoire pour la simulation des systèmes géothermiques avec l’outil HyGCHP (Hackel et al., 2011). Ce dernier fait appel à TRNSYS qui utilise le modèle DST (Duct Storage Model) développé par Hellström (1989). Le modèle implique la conduction
et le stockage de la chaleur dans le sous-sol et permet de simuler un nombre relativement large d’échangeurs de chaleur. La méthode des différences finies est utilisée pour résoudre le transfert de chaleur par conduction provenant d’une source linéaire dans un milieu en coordonnées cylindriques.
Le modèle DST a été largement utilisé pour la simulation des systèmes géothermiques, notamment par Beckman et al. (1994) qui ont effectué des simulations avec le programme TRNSYS dans le but de prédire et d’évaluer la performance de pompes à chaleur géothermique durant 5000 heures et considérant les paramètres physiques du sous-sol, des échangeurs de chaleur, du climat et du fluide caloporteur.
Plus de travaux considérant l’impact de l’écoulement d’eau souterraine face à la sensibilité de la performance des échangeurs de chaleur en fonction du débit d’écoulement d’eau souterraine ont été effectués par Bauer et al. (2009). Un modèle, qui couple le transfert de chaleur par conduction et advection causée par l’écoulement d’eau souterraine a été développé par ces auteurs dans le but de simuler l’influence de l’écoulement d’eau souterraine sur le stockage de l’énergie thermique dans le sous-sol. Ce modèle d’éléments finis a été développé en combinant des éléments unidimensionnels représentant les échangeurs de chaleur superposés aux éléments tridimensionnels du sous-sol. Le modèle de Bauer et al. (2009) a été utilisé pour évaluer la performance d’un système de quatre-vingt échangeurs de chaleur. C’est ce même type de modèle qui couple le transfert de chaleur par conduction et advection qui a été utilisé dans le but d’évaluer la performance des trente-et-un échangeurs de chaleur à l’école Carignan-Salières, bien qu’ici il ne s’agit pas d’un système de stockage thermique, mais bien d’un système conventionnel de pompes à chaleur. En effet, les simulations poussées qui ont été exécutées dans ce projet de maîtrise ont été entreprises avec le programme FEFLOW. Ce dernier utilise deux méthodes différentes pour la modélisation des échangeurs de chaleur, soit l’approche d’Al‐Khoury et al. (2005) et l’approche d’Eskilson et al. (1988). Dans les deux cas, FEFLOW permet de superposer la température calculée le long d’éléments unidimensionnels représentant les forages à la température du milieu poreux 3D déterminée avec la méthode des éléments finis. La réponse des échangeurs de chaleur est représentée par une série de résistances thermiques. Ce concept de modélisation a été intégré dans le programme FEFLOW afin de simuler l’impact de
l’écoulement souterrain et d’un sous-sol hétérogène face au transfert thermique et à l’opération d’échangeurs de chaleur (Trefry et al., 2007). Une représentation des échangeurs de chaleur par des éléments linéaires permet d’utiliser un maillage grossier et de réduire le temps de calcul lorsque comparé à une discrétisation en trois dimensions qui demande un maillage fin et un long temps de calcul.
La méthode d’Eskilson et al. (1988) est basée sur le transfert de chaleur local en régime permanent entre les deux tuyaux de l’échangeur et le sous-sol à travers le coulis dans un puits géothermique vertical. Cette approche est valide pour la prédiction à long terme de la température des échangeurs de chaleur, mais elle est non recommandée pour les simulations à court terme de quelques heures, car elle ne prend pas en considération les effets locaux transitoires internes des échangeurs de chaleur (Diersch et al., 2010). Dans le cadre de cette maîtrise, la méthode utilisée pour les simulations numériques avec le programme FEFLOW est celle d’Eskilson et al. (1988) car cette dernière est appropriée pour la durée de modélisation considérée dans ce travail, soit 20 ans, et offre un temps de calcul plus rapide.
À titre d’exemple, l’approche implémentée dans FEFLOW a été utilisée par Fujimoto et al. (2011) qui ont modélisé la performance d’un système de pompes à chaleur géothermique et son effet à long terme sur la température du sous-sol. Le système était constitué de soixante-dix-huit forages verticaux utilisés pour le chauffage et la climatisation de serres. Les travaux ont d’abord été effectués à l’échelle d’un forage et ensuite à l’ensemble du système en développant deux modèles numériques avec FEFLOW. Le modèle de l’échangeur de chaleur unique avait pour but d’estimer les paramètres physiques utilisés dans le deuxième modèle de l’ensemble du système qui comprend les soixante-dix-huit puits. Le modèle a été calibré avec des mesures de température du fluide dans les tuyaux de l’échangeur de chaleur durant un test de réponse thermique. Raymond et al. (2015) ont réalisé ce même type d’essai de réponse thermique afin d’évaluer la performance d’échangeurs de chaleur uniques en comparant la résistance thermique des forages mesurée à celle calculée selon les paramètres de conception du système. Des approches analytiques (Claesson et al., 2011) et empiriques (Remund, 1999) ont été utilisées pour calculer la résistance thermique théorique et
permis de distinguer l’influence de la conductivité thermique des matériaux de remplissage et de l’espacement des tuyaux sur la résistance thermique des forages. Dans le cas du champ de puits de l’école Carignan-Salières, une méthodologie semblable a été utilisée, mais pour simuler l’ensemble du système d’échangeurs de chaleur afin d’identifier l’impact des propriétés thermo-hydrauliques du sous-sol et des matériaux de remplissage des forages sur la performance du système à long terme.
Un autre exemple d’intérêt concerne les travaux de Barla et al. (2015) qui décrivent une étude réalisée à Turin en Italie sur la Tour Intesa San Paolo dont les besoins énergétiques sont en partie comblés par des échangeurs de chaleur à boucle fermée. Une modélisation thermo-hydraulique d’essais de pompage à grande échelle ainsi que de simulations de forages géothermiques sous l’impact de l’écoulement d’eau souterraine a été réalisée avec le logiciel FEFLOW. Le couplage de l’écoulement d’eau souterraine et du transfert thermique ont permis une analyse prédictive du comportement du système géothermique en fonction du temps. Les résultats de cette étude sont un exemple pour le projet de maîtrise réalisé puisque les travaux ont un objectif commun d’effectuer une prédiction à long terme de la performance d’un système géothermique selon un modèle numérique qui couple le transfert de chaleur et l’écoulement d’eau souterraine.
5 CARACTÉRISTIQUES DU SYSTÈME DE POMPES À CHALEUR
GÉOTHERMIQUE DE L’ÉCOLE CARIGNAN-SALIÈRES
Le champ de puits géothermiques de l’école Carignan-Salières est formé de trente-et-un forages verticaux installés sous la cour de l’école et espacés de 6 m l’un de l’autre (Figure 4). Chaque échangeur de chaleur a une profondeur moyenne de 152.4 m (500 pieds) et dispose d’un tuyau en U fait de polyéthylène haute-densité. Les tubes en U sont séparés par des entretoises géothermiques ayant la forme d’Oméga (Ω). Le fluide caloporteur est du propylène glycol ayant une concentration volumique de 25 %. Une cinquantaine de thermopompes sont distribuées dans les différentes pièces de l’école servant à chauffer et climatiser le bâtiment. Le système est fonctionnel depuis octobre 2013, assurant le chauffage et la climatisation de l’école.
Figure 4. Plan d’aménagement des puits de l’école Carignan-Salières.
6 CONTEXTE GÉOGRAPHIQUE ET GÉOLOGIQUE DE LA RÉGION
L’école Carignan-Salières est située sur la rive sud de Montréal dans la ville de Carignan. Elle a comme coordonnées 45º 27’43,22’’ N et 73º29’38,1’’ O. L’école est construite à côté du site de l’entreprise Eurovia Vinci qui exploite une carrière active et gère une carrière abandonnée.
L’école Carignan-Salières se situe dans la province géologique du bassin sédimentaire des Basse-Terres du Saint-Laurent qui repose en discordance sur le socle précambrien du Grenville (Bédard et al., 2011a). Les différentes formations géologiques des Basses-Terres du Saint-Laurent se sont déposées dans un bassin de rift évoluant ver une marge
passive puis un bassin d’avant-pays qui représentent un cycle complet de transgression et régression marine (Comeau et al., 2004, Globensky, 1987, St-Julien et al., 1975, Lavoie et al., 2003, Williams, 1979). Les interprétations de levés sismiques indiquent que le bassin des Basses-Terres du Saint-Laurent et le socle précambrien du Grenville ont été affectés par une série de failles normales s’étendant du SO vers le NE et inclinés vers le SE (Castonguay et al., 2010, Comeau et al., 2013, Konstantinovskaya et al., 2009, Séjourné et al., 2003). Ces dernières ont été associées à un régime tectonique en extension durant la séparation du supercontinent Rodinia et l’ouverture de l’océan Iapetus au Protérozoïque-Cambrien précoce (Carrier et al., 2013, Cawood et al., 2001, Hibbard et al., 2007, Rankin, 1976, Thomas, 2006). Ces failles normales ont été réactivées suite aux événements tectoniques successifs de la formation de l’orogène Appalachien (Globensky, 1987, Julien et al., 1975, Lavoie, 1994, Lemieux et al., 2003). Elles ont affecté les turbidites du Groupe de Lorraine (Séjourné et al., 2003), sur lequel l’école Carignan-Salières est construite.
Les séries sédimentaires des Basses-Terres du Saint-Laurent peuvent montrer une épaisseur totale dépassant 3000 m à 5000 m à certains endroits (Globensky, 1987, Lavoie, 1994). Les unités stratigraphiques d’importance pour ce projet sont ici décrites de la base vers le sommet (Figure 6). Le Groupe de Lorraine est observé sur la rive sud du fleuve Saint-Laurent, là où l’école Carignan-Salières est située. Il est formé des formations de Nicolet et Pontgravé. La Formation de Nicolet est formée essentiellement d’alternances rythmiques de shale et de grès quartzeux et des calcaires gréseux vers le sommet. Ces derniers sont exploités dans les carrières d’Eurovia Vinci, près de l’école Carignan-Salières. Ils forment des lits continus ou des lentilles selon des chenaux à laminations parallèles entrecroisés témoignant d’un milieu marin profond (Konstantinovskaya et al., 2010b). La Formation Pontgravé n’est pas observée près du site à l’étude puisque c’est la Formation de Nicolet qui affleure à cet endroit.
Figure 5. Carte géologique des Basses-Terres du Saint-Laurent et localisation de l’école Carignan-Salières (Comeau et al., 2004, Globensky, 1987).
Figure 6. Colonne stratigraphique des Basses-Terres du Saint-Laurent (Comeau et al., 2004, Globensky, 1987).
1 PREMIER ARTICLE
PERFORMANCE EVALUATION OF A GROUND-COUPLED HEAT PUMP
SYSTEM WITH A HEAT INJECTION TEST ANALYSIS
Titre traduit
Évaluation de la performance d’un système de pompes à chaleur couplées au sol selon l’analyse d’un test d’injection de chaleur
Auteurs
Nehed Jaziri1, Jasmin Raymond1 & Maxime Boisclair2
1- Centre Eau Terre Environnement – Institut national de la recherche scientifique, 490 de la Couronne, Québec, QC, Canada, G1K9A9 2- GBi, 17660, Mirabel, QC, Canada, J7J0C3
Publié
69th Canadian Geotechnical Conference – GeoVancouver, octobre 2016 Résumé
Les systèmes de pompes à chaleur géothermique offrent une meilleure efficacité énergétique et un faible coût d’opération par rapport aux systèmes de chauffage et de climatisation conventionnels. À l’école Carignan-Salières sur la Rive Sud de Montréal, un système géothermique à boucle fermée a été installé pour assurer le chauffage et la climatisation du bâtiment en opération depuis octobre 2013. Ce système est constitué par trente-et-un puits verticaux d’une profondeur d’environ 152 m. Les forages ont été remplis avec du sable d’olivine synthétique au lieu d’un coulis tel que prévu dans les plans de conception puisque les fines particules de coulis ont été lessivées par l’écoulement d’eau souterraine. Ce changement de matériaux de remplissage ainsi que les variations du régime d’écoulement d’eau souterraine pourraient avoir une influence sur les
performances du système à long terme. À l’aide d’un modèle calibré selon un test d’injection de chaleur réalisé sur l’ensemble du champ de puits, une étude a été effectuée dans le but de prédire la performance des échangeurs de chaleur et simuler numériquement la température de l’eau entrant dans les pompes à chaleur sur une période de vingt ans selon différents scénarios qui dépendent essentiellement des conductivités thermiques du sous-sol et des matériaux de remplissage. Les résultats ont montré que la conductivité thermique effective du sous-sol affectée par l’écoulement d’eau souterraine a plus d’impact sur la performance des échangeurs de chaleur que la conductivité thermique des matériaux de remplissage.
Abstract
Geothermal heat pump systems provide a better energy efficiency and a lower operating cost compared to conventional heating and cooling systems. Such a closed loop geothermal system was installed at the Carignan-Salières school on the south shore of the St-Lawrence River near Montreal to heat and cool the building in operation since October 2013. The system encloses thirty-one vertical ground heat exchangers having an approximate depth of 152 m. The boreholes were backfilled with synthetic olivine sand instead of a geothermal grout as specified in the design plans because the fine grout particles were washed out by groundwater flow. These changes in filling material and the variable groundwater flow setting can have an impact on the long-term performance of the system. A study was realized, using a model calibrated with a heat injection test conduct over the entire borehole field, to predict the performance of the ground heat exchangers and numerically simulate the water temperature entering the heat pumps for twenty years according to different scenarios, depending essentially on the thermal conductivity of the subsurface and the filling material. The simulation results have shown that the effective thermal conductivity of the subsurface affected by groundwater flow has a more important impact on the ground heat exchanger performance than the thermal conductivity of the filling material.
1.1 Introduction
Geothermal heating and cooling systems have increased in popularity in the institutional building sector. The Carignan-Salières Elementary School, located on the south shore of the St. Lawrence River near Montreal, is an example of such a building designed with a ground coupled heat pump system (GCHP). Thirty-one vertical ground heat exchangers (GHEs) equipped with a single U-pipe and fifty heat pumps distributed in the school building were installed in 2013.
The GCHP system of the school is located within a kilometer of two quarries, one of which is active and where groundwater is pumped. When grouting the GHEs upon installation, the fine particles of the grout mixture were lost in the subsurface and the boreholes could not be sealed. The boreholes have consequently been filled with olivine sand, which differed from the initial design, where it was planned to use thermally enhanced grout made of bentonite and quartz sand. This change in filling material and the varying groundwater conditions induced by the quarry operation may impact the GHE performances during the future operation of the heating and cooling system.
A heat injection test was carried out to evaluate the thermal response of the entire GHE field. The objective of this work was to evaluate the performance of the GCHP system affected by varying groundwater conditions. A simple modelling approach simulating conductive heat transfer in the subsurface and enclosing two secondary objectives was used as a first step. Those are to reproduce numerically the fluid temperature measurements recorded during the heat injection test by calibrating a model of the GCHP system, and then to predict the system operation over twenty years under different groundwater conditions affecting the effective thermal conductivity of the subsurface. This effective thermal conductivity is assumed to take into account advective heat transfer induced by groundwater flow. The development and calibration of a preliminary model for the GCHP system of the school building is described in this study. The subject links building to subsurface heat transfer processes and is believed to be of interest to geotechnical engineers involved in the construction industry.
1.2 Site Setting
The Carignan-Salières Elementary School is located in the city of Carignan, 24 km south of Montreal, and was built in 2013 above the Nicolet Formation in the St. Lawrence Lowlands sedimentary basin (Bédard et al., 2011a, Brisebois et al., 1994a). The Nicolet Formation belongs to the Lorraine Group and is constituted by sequences of fissile siliceous gray shale, mudstone and feldspathic sandstone. Calcareous sandstone marks the summit of the formation. The sediment beds of the Nicolet Formation are lens-shaped with a decreasing thickness toward the top depending on the presence of turbidity and channels, which are characteristics of a deep marine environment. The St. Lawrence Lowlands had been affected by a series of normal faults extending from southwest to northeast and tilted toward the southeast (Castonguay et al., 2010, Konstantinovskaya et al., 2010b, Séjourné et al., 2003).
One of the two gravel quarries located beside the school is still in operation (Figure 1-1). During a visit to the site in July 2016, the water level was at the base of the active quarry located more than 3 m below the sea level while the inactive quarry was filled with water. The average hydraulic gradient between the two quarries was evaluated at 0.028 m m-1,
with the measurements of the water level in the two pits. The regional aquifer is confined and located in fractured rocks. The groundwater flow direction is oriented toward the west but may locally change due to pumping of water in the quarry. The annual net recharge of the aquifer is approximately 100 mm y-1 and the average hydraulic conductivity for the
host rock is 10-5 m s-1, varying from 10-6.5 to 10-3.8 m s-1 (Carrier et al., 2013).
Two thermal response tests (TRTs) were realized in different boreholes using a single GHE to measure the subsurface thermal conductivity. The first test was carried out before the geothermal borehole field installation on the 6th of September 2012. A subsurface
thermal conductivity of 2.58 W m -1 K -1 was identified (Leblanc, 2012).The second test,
realized on the 3rd of June, 2013, after the installation of the borehole field with a different
GHE, indicated a subsurface thermal conductivity of 2.27 W m-1 K-1 (Renaud, 2013). This
difference between the two measured subsurface thermal conductivities may be due to varying groundwater flow conditions.
Carignan has a humid continental climate with an annual average temperature of 5.9 ºC and an amplitude of 30 ºC. This extended range of temperature requires heating and air conditioning for the school building.
The GCHP system has been in operation since October 2013 and has sufficient capacity to supply the entire heating and cooling loads of the building. The heating period is mostly from October to June while the cooling period is from July to September. The 31 vertical boreholes of the GCHP system are spaced by 6 m. Each borehole is 152.4 m deep (500 ft) and equipped with a single U-pipe made of high-density polyethylene. Omega (Ω) shaped spacers are used to separate the pipe legs. The boreholes were filled with olivine sand having a thermal conductivity of 1.75 W m-1 K-1, which was measured in the
laboratory (Côté et al., 2012). The fifty heat pumps distributed in the building each have a net heating capacity of 2.9 to 33.6 kW (9.96 to 114.81 kbtu h-1) and a net cooling
capacity of 3.62 to 44.2 kW (12.38 to 150.81 kbtu h-1).
Figure 1-1. Location of the Carignan-Salières School building with respect to the surrounding quarries.
1.3 Methodology
1.3.1 Heat Injection TestA heat injection test was realized during July 2015 to monitor the thermal response of the entire GHE field. The test was carried out by using the cooling system at its full capacity during hot summer days where windows had been opened for the outdoor heat to enter
the building. This resulted in the injection of heat in the GHE field at an average rate of 305 kW over 406 h. The cooling system of the building was then stopped and the heat carrier fluid was kept circulating in the GHE field to monitor the thermal recovery over 318 h. The temperature and the flow rate of the heat carrier fluid at the entrance and the exit of the GHE field were monitored during the test (Figure 1-2). The average heat injection rate was 9.8 kW per borehole and the average total flow rate was 39.3 L min-1.
Figure 1-2. Fluid temperature and flow rate recorded during the heat injection test at the Carignan-Salières School.
1.3.2 GCHP simulation
Simulations of the Carignan-Salières GCHP system were first achieved to reproduce the temperature recorded during the heat injection test. The thermal properties of the subsurface and the borehole filling material were adjusted to calibrate the model. Subsequent simulations were performed to evaluate the impact of filling material properties and varying groundwater conditions on the long-term operation of the system to predict water temperatures.
The program Hybrid Ground Coupled Heat Pump (HyGCHP; Hackel et al., 2011), which is a graphical interface to simulate GCHP systems with the Duct Ground Heat Storage (DST) model (Hellström, 1989) implemented in TRNSYS (Beckman et al., 1994), was used in this study. The DST model involves the storage of heat in the ground and it allows
0 100 200 300 400 500 600 0 5 10 15 20 25 30 35 0 200 400 600 Flow ra te (gp m ) h eat In jec tio n r at e (KW) Te m p era tu re ( ºC) Hours
Heat Pump inlet temperature (°C) Heat Pump outlet temperature (°C)
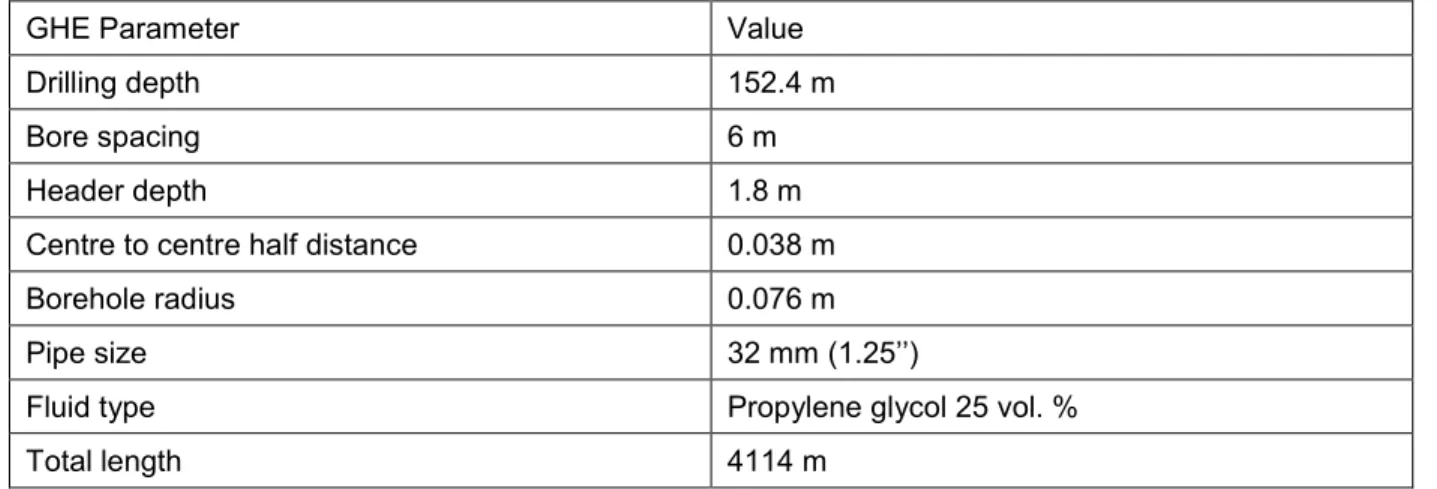
from the ground to the surface through a circulating heat carrier fluid. The model uses the finite difference method and solves heat transfer by conduction in cylindrical coordinates of a line source to reproduce the GHE field. The HyGCHP program utilized for this preliminary study cannot take into account advective heat transfer in the subsurface. An equivalent subsurface thermal conductivity having a higher value, as observed during thermal response tests influenced by groundwater flow (Bozdaǧ et al., 2008), was used to mimic the effect of groundwater flow to dissipate heat or cold around the boreholes. Hourly time steps were used for both the calibration and prediction simulations. Design parameters based on the installed GHE field and that were kept constant for all simulations are the drilling depth, the bore spacing, the header depth, the centre to centre half distance between the legs of the U-pipe, the borehole radius, the pipe size, the fluid type and the total GHE length (Table 1-1). The solution of water and 25 vol. % propylene glycol provides a freeze protection up to –9.62 °C in the GHE pipes.
Simulation of the water temperature entering the heat pumps during the heat injection test was achieved by imposing ground loads observed during the test, which were calculated with the measured temperatures and flow rate. Subsurface and borehole parameters remaining uncertain, which are the initial subsurface temperature, the thermal conductivity of the subsurface and the borehole filling material and the thermal diffusivity of the subsurface, were adjusted for simulated temperature to match observed temperature. A range of possible parameters were identified and used for long-term simulations to predict twenty years of operation. The unknown inputs for the subsurface thermal properties are assumed to reflect the varying groundwater conditions. The adjustment of the initial temperature is to account for a heat injection test that was performed during the cooling season of a system that has been operating for the past two years and likely changed the subsurface temperature.
Building loads determined hourly with an annual sum of heat gains and losses were used as an input for long-term simulations with HyGCHP under different scenarios. The heat pump nominal coefficient of performance (COP) in heating mode was 4.68 and the energy efficiency ratio (EER) in cooling mode was 14.11 for the long-term simulations. These two efficiency parameters were allowed to vary with the operating temperature of the water in
the GHE according to the performance curves specified in HyGCHP. The initial subsurface temperature was fixed to 11.5 °C for long-term simulations, which was determined according to the undisturbed temperature measured with the TRT in 2012 before the installation of the system. The beginning of operation simulations was October 2013, when the system was commissioned. Thermal conductivities of the subsurface and the filling material were varied to predict the long-term GHEs’ performance under pessimistic and optimistic conditions according to constrain identified with the calibration simulations.
The Carignan-Salières School is classified as a medium-power customer for Hydro-Québec, the electricity distributor in the area. The school demands 50 kW or more at least once every year. The rate is 0.493 $/kWh for the first 210 000 kWh, then 0.366 $ (kWh)-1
for the remaining consumption and a demand charge of 14.37 $ kW-1
(http://www.hydroquebec.com/business/rates-and-billing/rates/electricity-rates-business-customers/rate-m/). In the HyGCHP model, a rate of only 0.493 $ kWh-1 was considered
because the monthly energy use of the school is not expected to exceed 210 000 kWh, considering the simulated loads. Simulation of a conventional heating and cooling system with a gas boiler and a dry cooling tower for the school building was considered for comparison purposes. A gas price of 7.58 $ GJ-1 was considered in that case.
Table 1-1. Constant GHE parameters used for all simulations with HyGCHP.
GHE Parameter Value
Drilling depth 152.4 m
Bore spacing 6 m
Header depth 1.8 m
Centre to centre half distance 0.038 m
Borehole radius 0.076 m
Pipe size 32 mm (1.25’’)
Fluid type Propylene glycol 25 vol. %
Total length 4114 m
1.3.3 Building load simulation
eQuest/DOE2 (Hirsch, 2004). This program sums heat gains and losses on an hourly basis according to the dimensions of the building, the insulation material, the interior and exterior construction material and the operation schedule. The geographic location, the orientation and the regional climate are also taken into account. The Granby meteorological station was chosen to represent the Carignan City annual temperatures because of its proximity. The eQuest simulation allowed quantifying hourly energy consumption for heating and cooling the school building over 8760 hours.
1.4 Results
1.4.1 Simulation of the heat injection test and calibration of the model
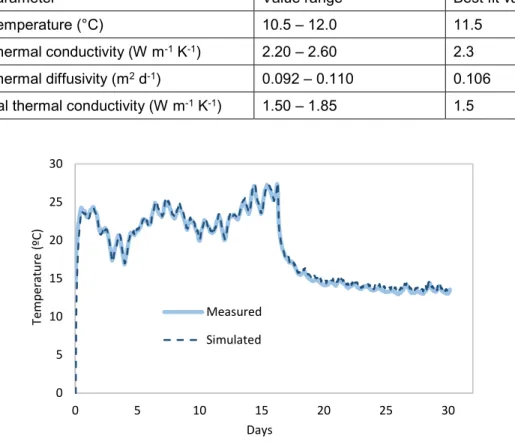
Water temperature measured at the exit of the GHE field or entering the heat pumps was at best reproduced within an average error of 1 % using HyGCHP (Figure 1-2). The range of unknown parameters, which are the thermal conductivity, diffusivity and initial temperature of the subsurface and the thermal conductivity of the filling material, were manually adjusted one at a time for the entering water temperature to have a maximum error of 15 % during the calibration simulations (Table 1-2). The thermal conductivity and diffusivity of the subsurface were linked according to its formula (𝛼 = λ
𝜌𝑐) and assuming
a volumetric heat capacity equal to 2.15 MJ m3 K-1.
As mentioned above, the boreholes were filled with olivine sand instead of a conventional grout made with bentonite and quartz sand. According to the design plans, the thermal conductivity of the thermally enhance grout should have been 1.64 W m-1 K-1. The
calibration simulations indicated a filling material thermal conductivity that can possibly vary from 1.5 to 1.85 W m-1 K-1. The modification of filling material composition during the
installation of the system has not significantly changed the thermal conductivity anticipated when designing the system. The range of thermal conductivity of the subsurface is within the results of both thermal response tests.
Table 1-2. Range of subsurface and borehole parameters identified with calibration simulations.
Calibration parameter Value range Best fit value Subsurface temperature (°C) 10.5 – 12.0 11.5
Subsurface thermal conductivity (W m-1 K-1) 2.20 – 2.60 2.3
Subsurface thermal diffusivity (m2 d-1) 0.092 – 0.110 0.106
Filling material thermal conductivity (W m-1 K-1) 1.50 – 1.85 1.5
Figure 1-3. Measured and simulated water temperature entering the heat pumps. 1.4.2 Long term simulations of the GCHPs operation
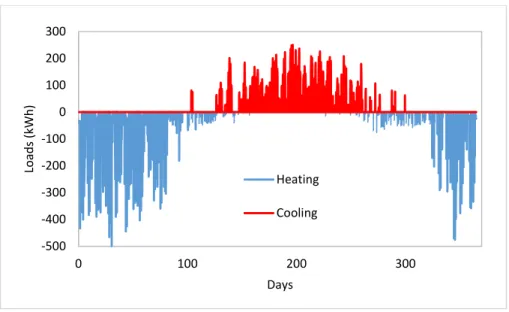
Building simulations with eQuest revealed that the Carignan-Salières School has a total annual heating load of -1.71×10⁵ kWh and a total annual cooling load of 1.19×10⁵ kWh
(Figure 1-4). The peak heating load occurred on January 16th and its magnitude was
494 kW, while the peak cooling load was on July 17th and its magnitude was 253 kW.
0 5 10 15 20 25 30 0 5 10 15 20 25 30 Te mp erat u re ( ºC) Measured Simulated Days
Figure 1-4. Heating and cooling loads for the Carignan-Salières School building.
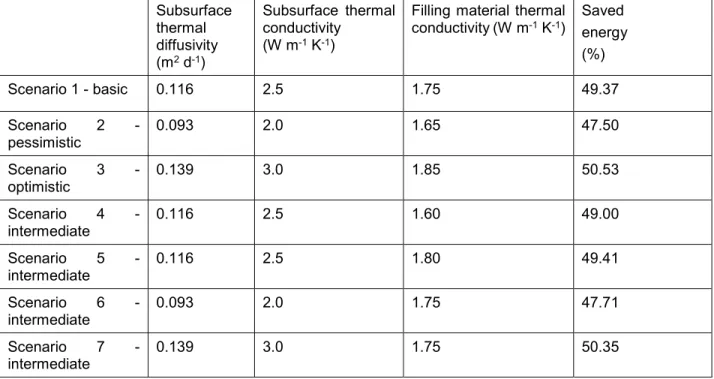
Seven different scenarios were considered for long-term simulations (Table 1-3). The first scenario is the base case, where the filling material thermal conductivity is that measured in the laboratory (Côté et al., 2012) and the subsurface thermal conductivity is close to that of the first TRT and the best fit value inferred with the calibration simulations. The second scenario is pessimistic and has the lowest possible values for the thermal conductivity of both the subsurface and the filling material. The third scenario is optimistic, and has the best possible values for these physical parameters. An effective subsurface thermal conductivity up to 3 W m-1 K-1 has been considered for a case with strong
groundwater flow. Scenarios four to seven are intermediate cases that have been used to evaluate separately the impact of the subsurface and filling material thermal conductivities.
According to the results for the base case scenario, the water temperature varies from less than -5 ºC to more than 25 ºC during the twenty years of simulation (Figure 1-5a). There is a continuous decreasing temperature since heating loads are greater than cooling loads. The water temperature leaving the GHE field becomes critical in the final eight years since it drops below -5 °C and begins to be close to the system minimum operation temperature that is equal to -9.62 °C.
-500 -400 -300 -200 -100 0 100 200 300 0 100 200 300 Lo ad s ( kWh ) Days Heating Cooling
Figure 1-5. Simulated water temperature at the entrance of the heat pumps for twenty years of -10 -5 0 5 10 15 20 25 30 0 5 10 15 20 Te mp erat u re ( ºC) Year Scenario 1 - Basic a) -10 -5 0 5 10 15 20 25 30 0 5 10 15 20 Te mp erat u re ( ºC) Year Scenario 2 - Pessimistic b) -10 -5 0 5 10 15 20 25 0 5 10 15 20 Te mp erat u re ( ºC) Year Scenario 3 - Optimistic c)
The pessimistic scenario indicated a maximum water temperature declining from about 27.0 ºC to 25.0 ºC and a minimum water temperature declining from -2.8 ºC to -8.0 ºC, approximately (Figure 1-5b). The water temperature reached a value below -5 °C for the last twelve years.
The optimistic scenario showed the same trend, with decreasing water temperature, but it indicated higher maximums and minimums (Figure 1-5c). In the first year, the maximum water temperature leaving the GHE field is 23.1 ºC and the minimum is 2.0 ºC. A water temperature below -5 °C only occurs for the last six years.
The seven simulated scenarios indicate different total energy consumption for the twenty years of operation, which has been expressed as a percentage of energy saved when compared to a system using a gas boiler and an air-cooling tower (Table 1-3).
The optimistic scenario allowed reducing energy cost by 50.53 % compared to 47.50 % for the pessimistic scenario, when considering a system with a gas boiler and a dry cooling tower. The simulation results for scenarios 4 and 5 with varying thermal conductivity of the filling material showed a percentage of saved energy differing by only 0.41 %. This indicates a small impact of the filling material thermal conductivity on the operation of the system. The simulation results for scenarios 6 and 7 with varying subsurface thermal conductivity indicated a larger difference in percentage of saved energy near 2.6 %. The thermal conductivity of the subsurface has a more important impact on GHE performance and the system energy saving when compared to the thermal conductivity of the filling material of the previous cases.
Table 1-3. Scenarios used for GCHP simulations and saved energy. Subsurface thermal diffusivity (m2 d-1) Subsurface thermal conductivity (W m-1 K-1)
Filling material thermal
conductivity (W m-1 K-1) Saved energy (%) Scenario 1 - basic 0.116 2.5 1.75 49.37 Scenario 2 - pessimistic 0.093 2.0 1.65 47.50 Scenario 3 - optimistic 0.139 3.0 1.85 50.53 Scenario 4 - intermediate 0.116 2.5 1.60 49.00 Scenario 5 - intermediate 0.116 2.5 1.80 49.41 Scenario 6 -intermediate 0.093 2.0 1.75 47.71 Scenario 7 - intermediate 0.139 3.0 1.75 50.35
1.5 Conclusions
The operation of the GCHP system at Carignan-Salières School was simulated over twenty years with a heat conduction model using the DST approach and calibrated according to a heat injection test to evaluate the global response of the GHE field. The heat injection test, similar to a TRT but performed on the whole borehole field with the operating system, allowed to evaluate the short-term response and infer the possible subsurface and filling material thermal conductivities that can reproduce the water temperature leaving the GHE field. Unknown parameters were manually adjusted with a model developed using the program HyGCHP.
The calibration and operating temperature simulations showed that the filling material thermal conductivity has a small impact on the geothermal system performance when compared to the thermal conductivity of the subsurface.
The effective value used for the subsurface thermal conductivity in this modelling exercise is thought to be influenced by groundwater flow since the school is located within less than one kilometer from an active quarry. Water pumping in the quarry can impact the
temperature of the GHE field affecting to a lesser extent, the energy savings provided by the GCHP system. However, the modelling approach used in this preliminary study, for which an effective subsurface thermal conductivity mimics the effect of groundwater flow, cannot take into account the flow direction that can impact the propagation of heat or cold around the borehole field. Subsequent work will consequently be carried out to better evaluate the impact of groundwater flow.
A detailed field characterization is required to infer the groundwater conditions at the site and develop a GCHP model for the school building that can directly take into account advective heat transfer in the subsurface. The following steps are recommended to better assess the long-term performance of the Carignan-Salières GCHP system under varying groundwater flow conditions. A conceptual model of the borehole field should be initially developed, considering hydraulic and thermal characteristics of the geological units. The thermal conductivity could be measured on rocks sampled in the quarries. An advanced numerical model of the GHE system including convective heat transfer in the subsurface may then help to improve the performance and energy saving predictions that will be more representative of the operating environment of the GCHP system. The heat injection test can still be used to calibrate the model for subsequent long term simulations, similarly to the work presented in this manuscript. The heat injection test performed on the whole borehole field, typically carried out with a single GHE through a TRT, is a new approach to evaluate the global response of the GCHP system to ensure quality control of the installations.
2
DEUXIÈME ARTICLE
LONG-TERM EVALUATION OF THE OPERATING TEMPERATURE IN A
LARGE-SCALE GROUND-COUPLED HEAT PUMP SYSTEM UNDER
VARIABLE GROUND WATER FLOW CONDITIONS
Titre traduit :
Évaluation à long terme de la température d’opération d’un système à grande échelle de pompes à chaleur couplées au sol soumis à des conditions variables d’écoulement d’eau souterraine.
Auteurs
Nehed Jaziri1, Jasmin Raymond1, John Molson2, Nicolò Giordano3
Article en vue de soumettre après l’évaluation du mémoire.
Abstract
A ground-coupled heat pump system has been installed at the Carignan-Salières elementary school located on the south shore of the St. Lawrence River near Montreal. The school is located near two quarries, one of which has water pumped irregularly to maintain dry working conditions. The heat pump system consists of thirty-one vertical ground heat exchangers (GHE), backfilled with olivine sand, coupled to fifty distributed heat pumps, and has been in operation since October 2013 for heating and cooling the school building. Pumping of water in the quarry induces variable groundwater flow conditions that can affect the GHE operating temperature and the system performance. The school operator has no control on the groundwater flow conditions and the quarry may stop pumping water in the future. A heat injection test was first carried out to evaluate the thermal response of the entire GHE field. Then, a numerical model was developed to predict and evaluate the long-term GHE operating temperature. Heat injection test results were used to calibrate the numerical model. Geological field investigations and laboratory
the subsurface with respect to thermal and hydrogeological parameters. Eight different scenarios were simulated to evaluate the impact of the main physical parameters affecting the system operating temperature, which are the thermal conductivity of the filling material, the thermal conductivity of the subsurface and the hydraulic gradient. The main purpose was to separately evaluate the impact of each parameter on the ground thermal response. Results have shown a small impact of the filling material thermal conductivity while the ground thermal conductivity had a more significant influence on the inlet and outlet temperature of the heat carrier fluid. However, the imposed hydraulic gradient has the greatest impact on operating temperature of the ground heat exchangers, which means that GHE performance is mostly dependent on the state of water pumping in the quarry. Constant water pumping in the active quarry will ensure a reliable performance of the GHE system at the Carignan-Salières elementary school.
Résumé
Un système de pompes à chaleur à boucle fermée a été installé à l’école de Carignan-Salières localisé sur la rive sud du fleuve Saint-Laurent près de Montréal. L’école est située à côté de deux carrières dont l’eau est pompée de façon irrégulière de l’une d’entre elles afin de maintenir des conditions de travail sèches. Le système de pompes à chaleur est constitué de trente-et-un forages géothermiques remblayés avec du sable d’olivine et couplés à une cinquantaine de pompes à chaleur en opération depuis octobre 2013 pour chauffer et climatiser le bâtiment de l’école. Le pompage de l’eau dans la carrière induit des conditions variables d’écoulement d’eau souterraine, ce qui peut affecter la température d’opération des échangeurs de chaleur donc la performance du système. L’opérateur de l’école n’a pas de contrôle sur les conditions d’écoulement souterrain et le pompage de l’eau dans la carrière pourrait être arrêté dans le futur. Un test d’injection de chaleur a été premièrement réalisé afin d’évaluer la réponse thermique de tout le champ de forages géothermiques. Ensuite, un modèle numérique a été développé dans le but de prédire et évaluer la température d’opération des échangeurs de chaleur à long terme. Les résultats du test d’injection de chaleur ont été utilisés pour la calibration du modèle. Des travaux de terrain et des mesures en laboratoire de la conductivité thermique d’échantillons de roche ont été réalisés pour la caractérisation de la sous-surface face à l’évaluation des paramètres thermo-hydrauliques. Huit différents scénarios
ont été simulés pour évaluer l’impact des paramètres physiques affectant la température d’opération du système, soit la conductivité thermique des matériaux de remplissage et de la sous-surface ainsi que le gradient hydraulique. Le but est d’évaluer séparément l’impact de chaque paramètre sur la réponse thermique du sous-sol. Les résultats ont montré que la conductivité thermique des matériaux de remplissage a un impact mineur alors que la conductivité thermique de la sous-surface a un impact plus significatif sur la température du fluide caloporteur à l’entrée et à la sortie des échangeurs de chaleur. Cependant, le gradient hydraulique imposé à l’impact le plus important sur la température d’opération, ce qui signifie que la performance des échangeurs de chaleur dépend du pompage de l’eau dans la carrière active. Un pompage constant de l’eau de la carrière active assurera une performance adéquate du système de pompes à chaleur géothermique de l’école Carignan-Salières.
2.1 Introduction
Groundwater flow can have a significant impact on the long-term performance of ground heat exchangers (GHE), especially when the Darcy flux is greater than 1×10⁻⁷ m s-1
(Dehkordi et al., 2014, Ferguson, 2015). Flow in the heterogeneous subsurface can actually improve heat exchange rates with the subsurface by dissipating heat injected into or extracted from the ground. Design of ground-coupled heat pump (GCHP) systems are, however, commonly based on the assumption of conductive heat transfer in the subsurface. Accurate prediction of GCHP system performance subject to groundwater flow remains problematic when systems are designed assuming thermal conduction only. Practitioners often assume that system performance can be better than expected when there is significant groundwater flow but neglect the fact that flow conditions may change. The Carignan-Salières elementary school is an example of such a building, which is heated and cooled with a GCHP system operating under varying groundwater flow conditions because of its location within a kilometer of two quarries, one of which is actively being dewatered. In addition, upon installation, the GHEs were backfilled with sand instead of using a geothermal grout because of significant groundwater flow, which
formations. This change of filling material from the initial design plans and the variable groundwater flow conditions are anticipated to affect the long-term performance of the GHEs. The objective of this study was, therefore, to better understand the effect of groundwater flow on the long-term operating temperature of the GHE to anticipate potential operational problems. Previous studies have been conducted to evaluate the impact of groundwater flow on the operating temperature of GHEs (Barla et al., 2015, Bauer et al., 2009, Trefry et al., 2007), but most are based on theoretical modelling exercises and have not been validated with operational data of systems being used under significant groundwater flow conditions.
Numerical simulation of a GHE operation calibrated with a large-scale heat injection test was carried out in this study to evaluate the temperature of the heat carrier fluid circulating in the bore field. Long-term simulations of the system temperature under different field-based scenarios were subsequently carried out for a period of 20 years. A comparison between the simulation scenarios allowed a quantitative evaluation of the ground parameters affecting the system performance including the site hydraulic gradient.
2.2 Description of the site
The Carignan-Salières elementary school is located on the south shore of the St. Lawrence River near Montreal (Figure 2-1) and was built above the Nicolet Formation in the St. Lawrence Lowlands sedimentary basin (Bédard et al., 2011a, Brisebois et al., 1994a). From a structural perspective, the St. Lawrence Lowlands are characterized by a series of normal faults extending from the southwest to the northeast, and which dip toward the southeast (Castonguay et al., 2010, Konstantinovskaya et al., 2010a, Séjourné et al., 2003). The Nicolet Formation belongs to the Lorraine Group. The numerical model of the GHEs field at the school was developed according to geological field observations.