ADVANCED PARTICLE CHARACTERIZATION FOR
IMPROVED UNDERSTANDING OF COLD SPRAY
COATING QUALITY
Pirard EricUniversité de Liège, GeomaC, 4000 Liège, Belgium
F. Campana, J.P. Janssen Advanced Coating S.A., 4000 Liège,
Belgium
1. INTRODUCTION
Metal particles are at the very heart of the spray process and as such it is obvious that their individual characterization is a necessary step to fully understand their behaviour. It is to be expected that a better understanding of the way the cold spraying affects individual particles will allow for developing more accurate powder specifications and for obtaining improved process performances.
The standard protocols for powder characterization rely on sieve size distributions and light scattering methods : ASTM-B214-99 : « Standard test method for sieve analysis of metal powders” and ASTM-B822-02 : « Standard Test Method for Particle Size Distribution of Metal Powders and Related Compounds by Light Scattering ». Such techniques deliver size distributions which provide only limited insight into the powder properties.
It is the purpose of this paper to explore the potential of new microscopic sensing techniques relying on high level image analysis for a better description of both the size and the shape of particles. Such results will be further correlated with classical physical testing experiments to evaluate their predicting potential for use as routine characterization methods in the quality control of spray experiments.
2. MATERIALS AND METHODS
Two different copper powders (A and B) have been selected to study their influence on the quality of the coatings obtained with the cold spray process. The powders were sprayed with a standard CGT spraying nozzle using nitrogen at a series of pressure / temperature conditions listed in table 1. The spraying distance was set to 40mm and the scanning velocity of the nozzle was set to 397 mm/s. As an indication the average powder flowrate was estimated to be 40 ±1g/min.
The velocity of individual particles with increasing diameter as a function of the gas input pressure (P0) and temperature (T0) has been modelled for a divergent/convergent
nozzle design. Results are shown in figure 1. It appears obvious that the velocity of the largest particles (> 15 µm) is almost similar at 520° - 22 bars or 320° - 30 bars. On the other hand, the low inertia of the smallest particles (< 5 µm), allows them to closely follow the same velocity profile as the gas.
Temperature (°C) T0 Pressure (bars) P0 320 22 320 30 420 26 520 22 520 30
Table 1 Selected pressure / temperature conditions for the cold spraying process
The evolution of the particle temperature as a function of their size was also estimated by modelling. It appears that the temperature of the particle is clearly dependent on the temperature of the gas. From this observation, it is reasonable to suppose that the largest particles, having a high thermal inertia, reach the substrate at a temperature close to the maximum. On the other hand, the smallest particles might be subject to cooling down during their transfer.
Fig. 1 Modelling of individual particle velocities as a function of their diameter (µm) for different combinations of input pressure (P0) / temperature (T0).
The selected copper powders A and B are both in the range of 5 – 25 µm and were obtained from atomisation. A quick observation under the scanning electron microscope does not reveal striking differences between both except maybe in terms of surface texture (Fig. 2). Moreover physical characterisation using the Hall flowmeter was impossible due to the very fine nature of both powders.
3. IMAGE ANALYSIS OF METAL POWDERS
3.1 From visual observation to quantitative image analysis
The traditional way of looking at properties of individual particles within a powder involves the use of an optical or an electron microscope and essentially relies on a visual appreciation of the particle features (fig. 2). Because of the inherent subjectivity of visual descriptions, researchers have been in search for quantitative descriptors for more than a century [1], but it is not until the advent of digital imaging that a new field of quantitative morphometrics has emerged [2]. Despite of the widespread availability of such equipments, it is only recently that some timid experiments have been done on spraying powders [3]. The availability of dedicated, accurate and productive instruments for powder granulo-morphometrics will probably break new ground in the field of spraying powder quality control within the next years.
In order to use the capabilities of automated digital image analysis in powder characterization, it is essential to disperse the individual particles so as to avoid any overlapping or even any contact between them. This is traditionally achieved by dropping a few particles on a transparent adhesive tape [3] or by gently tapping the glass slide used in microscopy. But, clearly, such empirical methods have their limitations and cannot be recommended when thousands of particles have to be analyzed and when any risk of size or shape segregation must be strictly avoided.
Therefore, the development of efficient image analysis solutions for the characterization of individual particles within a metal powder, requires three steps to be carefully considered and automated :
- the optimal dispersion of individual particles, - the high resolution imaging of individual particles,
- the real time computation of dedicated granulomorphometric (size and shape) parameters.
3.2 Image analysis using the Alpaga 500 nano instrument
The powder dispersion, powder imaging and image analysis techniques used in this work have been developed by Occhio Instruments. They are known respectively as VDD270, Alpaga 500 Nano and Callisto. The necessary graphical and statistical data analysis software that complements the analytical tools is designated as Callistat. Because, these techniques are used here for the first time in characterization of spraying powders their principles will be briefly explained.
The physical dispersion of fine powders (< 50 µm) is almost impossible to achieve using mechanical vibrations as applies for coarser size distributions. Another option is to rely on the projection of powder onto a hard surface (e.g. steel ball) that will break down the agglomerates, but it is hard to believe that such an impact does not affect the particle size and morphology to a certain extent. The principle used in the VDD270 is based on vacuum dispersion into a cylindrical chamber. The required powder sample (a few ml) is first deposited onto a membrane that covers a small pinhole at the top of the chamber. After this, a vacuum pump empties the cylindrical chamber. Once the desired depression is obtained (depending on the powder characteristics), the membrane is punched into its very centre with a needle and the sudden rupture of the membrane allows the powder to fill in the chamber. The individual particles are forced to settle down onto a circular glass slide that has previously been placed at the bottom of the chamber.
This principle has two major advantages : it does not affect the individual particle morphology and it has a central symmetry segregation pattern that will be taken into account by scanning a complete diametrical section of the glass slide during the image acquisition step.
The powder dispersion achieved with the VDD270 is particularly efficient with metallic powders and it is such that it can be considered that less than 1:500 particles are touching each other. This is statistically insignificant, not to say that touching particles can be
eventually identified and removed from the analytical results during the data analysis procedure.
Fig. 3 Atomized particles imaged with a 1 MPixels video camera using a superzoom objective. Individual thumbnail image of a 15 µm particle as obtained from grey level thresholding. Individual imaging of the particles is achieved using a high resolution digital video camera coupled to a superzoom objective. The optical device delivers a maximum resolution of 500 nm without having to deal with the cumbersome structure of the traditional optical microscope (fig. 3). Such an extreme resolution is achieved thanks to a violet LED illumination instead of the traditional white light. As a consequence, at standard magnifications, a 35 µm particle is represented by a 5000 pixels set and a 5 µm particle is still represented by a 100 pixels set. In practice, this means that accurate size analysis can be achieved in the range of 1µm to 200 µm, particle elongation can be estimated in the range from 5 µm to 200 µm and particle roughness can be accurately measured in the range from 20 µm to 200 µm. Smaller particle sizes are facing the optical limits induced by light diffraction, whereas larger particle sizes would only require to use lower magnification optics [4].
Fig. 4 Three views of an ellipsoidal particle (a>b>c) as it might appear perpendicular to the rest plane (a/b), randomly projected or parallel to its b axis (a/c).
(Sieving diameter=b; Elongation=a/b; Flatness a/c )
Computation of size and shape parameters from sets of pixels is a major concern in the scientific literature. It is clear for many authors that shape analysis is a multiple scale issue and that no universal shape descriptor is to be expected, whatever the sophistication of the method (Fourier, Fractals, Wavelets, etc.) [5]. Moreover, shape analysis will essentially remain two-dimensional and ignore the third dimension as long as no standard three-dimensional imaging technique is made available.
Occhio’s instruments take advantage of controlled particle orientation imaging (each particle is in rest position) to accurately estimate the mesodiameter or sieving diameter of a particle from its projected image (fig. 4.). Therefore the technique claims an almost perfect
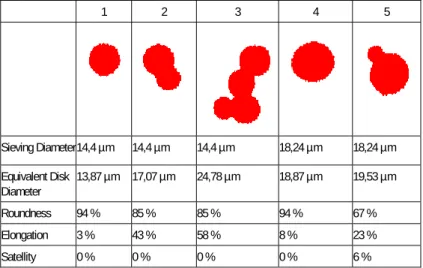
correlation with sieve size distributions when these are available [6]. Multi-purpose image analysis softwares, on the other hand, compute size as the projected area and convert it into the diameter of a disk with equivalent area. This might generate a significant difference in cases were the particle geometry departs from a disk (Table. 2). The use of a controlled particle orientation imaging mode also benefits to the computation of an aspect ratio that precisely coincides with particle elongation (computed as (a-b)/(a+b) in table 2 and 3 ). Otherwise, even if a system could achieve perfectly randomized particle orientations in 3D space, it would be most often impossible to derive elongation and flatness values from the aspect ratio distribution.
1 2 3 4 5 Sieving Diameter14,4 µm 14,4 µm 14,4 µm 18,24 µm 18,24 µm Equivalent Disk Diameter 13,87 µm 17,07 µm 24,78 µm 18,87 µm 19,53 µm Roundness 94 % 85 % 85 % 94 % 67 % Elongation 3 % 43 % 58 % 8 % 23 % Satellity 0 % 0 % 0 % 0 % 6 %
Table 2 A non-representative selection of copper particles from powder A to illustrate the main size and shape parameters. Notice the difference between sieving and equivalent disk diameter.
1 2 3 4 5 Sieving Diameter 14,4 µm 14,4 µm 14,4 µm 14,4 µm 20,64 µm Equivalent Disk Diameter 14,96 µm 16,76 µm 23,97 µm 26,73 µm 30,17 µm Roundness 98 % 75 % 74 % 87 % 58 % Elongation 8 % 36 % 25 % 66 % 66 %
Table 3 A non-representative selection of copper particles from powder B.
Image analysis also provides a detailed morphological analysis of the particle contour that can be expressed in many ways. There is no such thing as a universal shape descriptor, therefore parameters dedicated to a specific application or combinations of different parameters give the best insight into the particle properties.
Roundness (or wear index) which expresses the maturity of a particle suffering an abrasion process, has been shown to be well suited as a predictor of flowability [7]. However, in case of atomized particles where spheres might stick together, high roundness values are observed for particles that clearly depart from smooth spherical particles (table 2, n°3; table 3, n° 4). In the latter cases, elongation or concavity values bring additional information on the particle outline. For sake of quality control of atomized particles, an additional parameter called satellity helps to pinpoint the common problem of fine spheres sticking onto larger ones (table 2, n° 5).
4. RESULTS 4.1 Size distributions
Image analysis is unique in that it provides an individual measure of each particle. This allows histograms to be presented either using number weighted frequencies or volume weighted frequencies. Both graphics are useful for a better understanding of the powder characteristics, although the volume weighted histograms are often more intuitive because they are the natural output of the classical sieving procedure.
The volume weighted distribution obtained for both powders A and B is displayed in figure 5. It shows a size range from 5µm to 25 µm but hardly any difference in terms of size distribution. 0.00% 5.00% 10.00% 15.00% 20.00% 25.00% 30.00% 0 5 10 15 20 25 30 35 Sieving Diameter V ol um e Fre que nc y A B
Fig. 5 Volume weighted size distribution of powders A and B.
0.00% 5.00% 10.00% 15.00% 20.00% 0 5 10 15 20 25 30 35 Sieving Diameter (µm) N b Fr e qu e nc y A B
Figure 6 displays the same image analysis results as figure 5 but in number weighted values. This time a clear difference emerges between powder A and B. Powder A clearly appears to have an asymmetric, high dispersion but continuous size distribution with a mode around 4 - 5 µm, while powder B appears to be better calibrated around 12 µm but polluted with a significant amount of extremely fine particles (<3 µm)
Obviously, such characteristics could explain different aerodynamic behaviours of both powders during the spraying process.
4.2 Shape distributions
Figure 7 displays the number weighted roundness distribution curves as obtained for both powders. Such curves must be interpreted with caution, since it is particularly hazardous to compare shape properties at very different scales (particle sizes). In other words, the decreasing trend of roundness with size is poorly significant as are roundness values computed for very small particles. One should essentially note that powder B is statistically more rounded than powder A.
0.00% 20.00% 40.00% 60.00% 80.00% 100.00% 0 5 10 15 20 25 30 35 Sieving Diameter (µm) A v e ra ge R oundne s s A B
Fig. 7 Number weighted roundness distribution of powders A and B.
Figure 8 displays the number weighted satellity distribution curves as obtained for both powders. Here again, average values should only be compared within similar size classes. This reveals that the finest particles of powder B tend to stick on the surface of the larger particles, thereby giving higher satellity values in the larger size classes. Values for particles smaller than 15 µm should not be given too much attention for sake of poor pixel representation. 0.00% 1.00% 2.00% 3.00% 4.00% 5.00% 6.00% 0 5 10 15 20 25 30 35 Sieving Diameter (µm) A v e rag e S a te ll it y A B
4.3 Coating quality and operational conditions
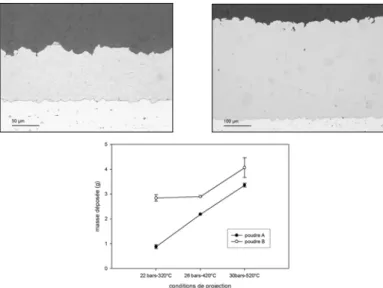
Figure 9 displays the trend in the total deposited mass as a function of the operational conditions for both powders. Powder B appears to have a systematically higher yield as compared to powder A. This might be attributed to the finer size distribution of A, which is confirmed by the fact that A appears to be more sensitive to the operational conditions. From the modelling results (Fig. 1), it appears that increasing from (P0=22 bars; T0=320°C)
to (P0=30 bars; T0=520°C) allows powder A to gain an average velocity of 140 m/s whereas
powder B only gains 80 m/s.
Fig. 9 Micrographs of coatings obtained for powders A and B and graph of total mass of deposited material (g) as a function of operational conditions.
Figure 10 displays the tensile bond strength of the coating layers obtained from powders A and B under different operational conditions. The higher tensile bond strength obtained from powder A is obvious and most probably related to the larger amount of fine particles. Here again, the modelling results suggest that more particles from powder A have high velocities, thereby inducing the formation of shear bands during the impact.
Fig. 10 Evolution of the tensile bond strength of the coating with operational conditions for both powders A and B.
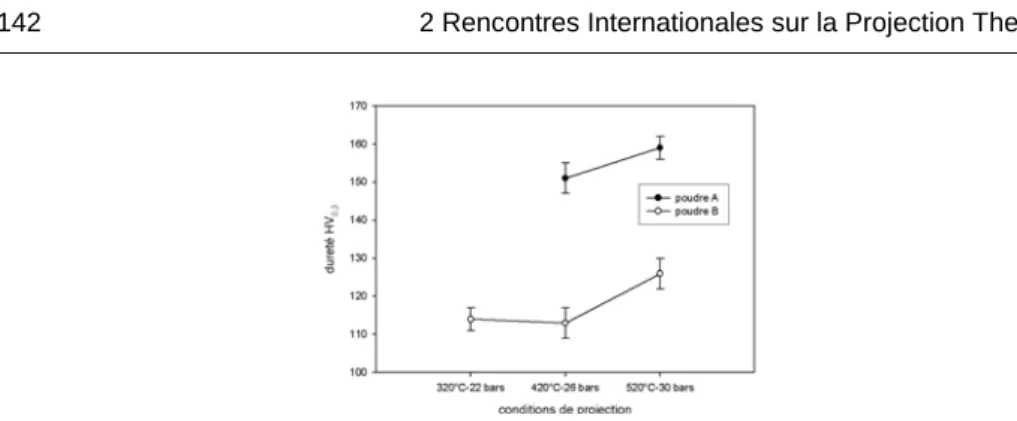
Figure 11 displays the Vickers microhardness as measured on coatings obtained from both powders. From the Hall-Petch effect it is well known that smaller particles will generate a higher coating microhardness. This is confirmed at all operational conditions. Powder A giving systematically higher microhardness values.
Fig. 11 Evolution of the coating microhardness (Vickers) with operational conditions of the cold spray process for both powders A and B.
5. SUMMARY AND CONCLUSIONS
Individual particle characterization is a necessary step for a better understanding of the quality of cold spray coatings. Image analysis brings new insights into the particle properties by allowing fast, fully-automated quantitative microscopy of the particle geometry (size and shape). The fact that the traditional bulk analysis (e.g. sieves) is replaced by individual sensing of particles allows for precise morphostatistical data analysis that might reveal subtle differences in terms of product properties. In this work, the size of particles appears to be the most critical parameter with regard to process performance and coating quality. The use of size distribution by number instead of size distribution by weight appears to be the clue for developing powders with improved properties.
6. ACKNOWLEDGEMENTS
The authors would like to thank Thomas Kairet for his cooperation and systematic experimental work. They are very much indebted to Vincent Chapeau and Christian Godino from Occhio Instruments who kindly provided their expertise and help during the data analysis procedure.
7. BIBLIOGRAPHICAL REFERENCES
[1] Wentworth, C. K. , « The shape of pebbles », U.S. Geological Survey Bull., vol. 730, 91-114, 1922 [2] Exner, H. E., « Shape : a key problem in quantifying microstructures », Acta Stereologica, vol. 6,
1023-1028, 1987.
[3] Dvorak, M., Schmid, H.G., and Fischer, F., « Fast quality control of spray powders », International
Thermal Spray Conference , E. Lugscheider and C.C. Berndt, Ed., March 4-6, 2002 (Essen, Germany), DVS Deutscher Verband für Schweißen, 580-583, 2002.
[4] Pirard, E., « Image analysis of PM powders adds a new dimension », Metal Powder Report, 14-18, 2003.
[5] Clark, M.W., « Quantitative shape analysis : A review », Mathematical Geology, vol. 13, 303-319, 1981.
[6] Pirard, E., Vergara, N. and Chapeau, V., « Direct estimation of sieve size distributions from 2-D image analysis of sand particles », Proc. Partec Conf., Nürnberg, 2004.
[7] Miserque, O., Tissot, S. and Pirard, E., « Caractérisation de particules d'engrais : corrélation entre les propriétés physiques et morphométriques », Récents progrès en génie des procédés, vol. 15, 2001.
[8] Pirard, E., « Shape processing and analysis using the calypter », J. Microscopy, vol. 175, 214-221, 1994.