Contents lists available atScienceDirect
Palaeogeography, Palaeoclimatology, Palaeoecology
journal homepage:www.elsevier.com/locate/palaeoUse of high-resolution seismic reflection data for paleogeographical
reconstruction of shallow Lake Yamanaka (Fuji Five Lakes, Japan)
L. Lamair
a,g,⁎, A. Hubert-Ferrari
a, S. Yamamoto
b, O. Fujiwara
c, Y. Yokoyama
d, E. Garrett
e,g,
M. De Batist
f, V.M.A. Heyvaert
f,g, the QuakeRecNankai Team (Evelien Boes
h,
Atsunori Nakamura
i, Stephen Obrochta
j, Masanobu Shishikura
i, Yosuke Miyairi
k,
Helmut Brückner
l, Eisuke Ono
o, Svenja Riedesel
m, Koen De Rycker
h, Yoshiki Sato
i, Jan Walstra
n)
aUniversity of Liège, Department of Geography, Liège, BelgiumbMount Fuji Research Institute, Yamanashi Prefectural Government, Yamanashi, Japan
cGeological Survey of Japan, National Institute of Advanced Industrial Science and Technology, Tsukuba, Japan dUniversity of Tokyo, Atmosphere and Ocean Research Institute, Chiba, Japan
eDurham University, Department of Geography, Durham, United Kingdom fGhent University, Department of Geology, Ghent, Belgium
gGeological Survey of Belgium, Royal Belgian Institute of Natural Sciences, Brussels, Belgium hGhent University, Department of Geology, Ghent, Belgium
iGeological Survey of Japan, National Institute of Advanced Industrial Science and Technology, Tsukuba, Japan jGraduate School of Earth Resource Science, Akita University, Japan
kUniversity of Tokyo, Atmosphere and Ocean Research Institute, Chiba, Japan lGeographisches Institut, Universität zu Köln, Köln, Germany
mDepartment of Geography and Earth Sciences, Aberystwyth University, Aberystwyth, United Kingdom nGeological Survey of Belgium, Royal Belgian Institute of Natural Sciences, Brussels, Belgium oNiigata University, Niigata, Japan
A R T I C L E I N F O Keywords:
Lake level fluctuations Seismic reflection profiling Depositional history Mt. Fuji
Volcanic eruptions Mass-transport deposit
A B S T R A C T
High-resolution seismic profiles, combined with the integration of published drilling data, provide a detailed paleoenvironmental history of Lake Yamanaka (Fuji Five Lakes, Japan). This study presents a detailed analysis of the different depositional stages of the area currently occupied by Lake Yamanaka (floodplain wetland, river and lake). From ca. 5500 cal yr BP to ca. 5050 cal yr BP, the Yamanaka basin was occupied by floodplain wetlands. During that period, the landscape was very stable and erosion on northeastern flank of Mt. Fuji was relatively limited. From ca. 5050 cal yr BP to ca. 3050 cal yr BP, the water level increased and the floodplain wetlands became a lake. From ca. 3050 cal yr BP to ca. 2050 cal yr BP, the water level progressively decreased, leading to a reduction in lake extent. During this lowering of the lake's water level, a 1 km2mass-transport deposit modified
the physiography of the lake floor. From ca. 2050 cal yr BP to ca. 1050 cal yr BP, the lake disappeared and a river flowing towards the northwest occupied the depression. Ponds occupied morphological lows formed by mass-transport deposits. From ca. 1050 cal yr BP to the present day, the lake water level rose again, connecting the ponds with the main lake. Since then, the lake water level has continued to rise to the current level. Lake water level fluctuations are the results of several factors that could be interconnected: (i) changes in precipitation rates; (ii) margin destabilization (the Yamanaka mass-transport deposit), (iii) changes in river inlets and therefore variation in water supplies, (iv) volcanic eruptions (scoria fall-out and lava flows) and (v) changes in vegetation cover. This study highlights the importance of coupling sediment cores and high-resolution seismic reflection profiling to identify lateral variation and modification of sedimentary inputs through time.
1. Introduction
Lake deposits are sensitive archives that provide continuous and
high-resolution records of environmental change (Last and Smol, 2001). Extracting information from such archives is best achieved by com-bining geophysical investigations with sedimentological studies.
https://doi.org/10.1016/j.palaeo.2018.09.028
Received 30 April 2018; Received in revised form 20 September 2018; Accepted 25 September 2018
⁎Corresponding author at: Clos Mercator 3, 4000 Liège, Belgium.
E-mail address:[email protected](L. Lamair).
Available online 12 October 2018
0031-0182/ © 2018 Elsevier B.V. All rights reserved.
Sediment cores offer information about the evolution of sedimentary processes at a specific location within the lake, while geophysical data, such as reflection seismic profiles, allow extrapolation of this in-formation across the entire lacustrine sedimentary system. Further-more, sediment cores are essential to confirm the geological inter-pretation of geophysical data. In this study, we obtained high-resolution seismic reflection data to investigate the depositional history of Lake Yamanaka, Japan. Lake Yamanaka is located at the northeastern foot of Mt. Fuji (3776 m above sea level (asl);Fig. 1) and is highly exposed to eruptions of this volcano. Consequently, it is ideally situated for in-vestigations of lake-volcano interactions. In shallow lakes, high-re-solution seismic reflection data often give poor results due to the pre-sence of shallow gas preventing acoustic penetration over extended areas. In this study, a dense grid of high-resolution seismic reflection profiles provides a detailed (although partial due to gas blanking) image of the architecture of the Yamanaka basin and of the various facies constituting its sedimentary infill. In the 1990's, diatom (Taba et al., 1990;Yoshizawa et al., 2004) and grain size analyses (Adhikari
et al., 2005) performed on sediment cores led to the suggestion that the Yamanaka basin has not always been occupied by a lake, but that la-custrine phases alternated with wetland and river intervals. The com-bination of seismic reflection data and sedimentological information allows the four-dimensional paleoenvironmental reconstruction of the Yamanaka basin.
This study is the first detailed, quantitative reconstruction of the depositional environments of Yamanaka basin based on high-resolution seismic reflection data and the integration of published sediment core analyses (Taba et al., 1990; Endo et al., 1992; Kosugi et al., 1992; Kosugi et al., 1993; Koshimizu and Uchiyama, 2002; YIES, 2004; Koshimizu et al., 2007;Yoshizawa et al., 2004;Adhikari et al., 2005). The primary objectives of the study are to: (i) couple seismic reflection data with published sedimentological analyses, (ii) reconstruct the de-positional history of the Yamanaka basin, (iii) develop a relative chronology of lake history based on published radiocarbon dates and identification of scoria fall-out, and (iv) identify the interactions be-tween water level fluctuations and Mt. Fuji volcano.
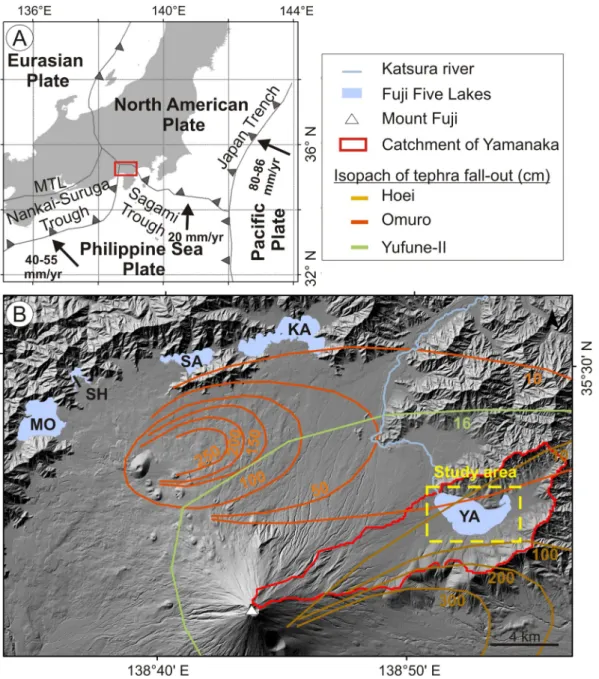
Fig. 1. Setting of the study area. A. General localization of Lake Yamanaka on Honshu Island (Japan). B. Fuji Five Lakes (YA: Lake Yamanaka; KA: Lake Kawaguchi; SA: Lake Sai; SH: Lake Shoji, MO: Lake Motosu). The tephra fall-out isopachs of the Yufune-II (2155–2039 cal yr BP;Suppl. data 1), Omuro (3260–3056 cal yr BP; Yamamoto et al., 2005) and Hōei eruption (1707 CE) followMachida (1964).
2. Setting
Lake Yamanaka (35.418° N, 138.878° E at the center of the lake; 980.5 m asl) reaches a maximum depth of 14.3 m, with a surface area of 6.89 km2. Its watershed covers an area of 69.81 km2 and drains the
northeastern flank of Mt. Fuji, which is characterized by gentle slopes of
~2–5°. To the north of Lake Yamanaka, the drainage area is restricted and is defined by the steeper slopes, ~13–18°, of the Tanzawa moun-tains, which reach ~1200–1300 m asl (Figs. 1, 2).
The lake is mainly fed by ground water flow from the Tanzawa mountains and Mt. Fuji (Hirabayashi et al., 2004). Additional inputs are rainfall and ephemeral streams, which are only active during snow
Fig. 2. A. Bathymetry of Lake Yamanaka (modified afterAdhikari et al., 2005) and geological map (modified afterOzaki et al., 2002) of the surroundings of Lake Yamanaka. The catchment of Lake Yamanaka is mainly composed of volcanic deposits. Four ephemeral streams feed the lake. Its natural drainage, the Katsura river, is located at the northwest of the Lake. The seismic reflection grid and the sites cored in 2014 are represented in grey dashed lines and in black dots, respectively. The location of the 17.65 m borehole (red square;Koshimizu and Uchiyama, 2002) and 2.55 m core (brown triangle;Taba et al., 1990;Endo et al., 1992) is also given. The solid black lines mark the border of the Western, Central and Eastern part of the Yamanaka basin.B. Lava flows and pyroclastic flow maps at the outlet of Lake Yamanaka, modified afterNakano et al. (2007). (For interpretation of the references to color in this figure legend, the reader is referred to the web version of this article.)
melt, monsoon, the typhoon season and torrential rain episodes. The outflow of the lake, the headwaters of the Katsura River, is located at the northwestern end (Figs. 1, 2).
The lake watershed is mostly composed of volcanic rocks of the old Fuji volcano (from 100 kyr BP to 17 kyr BP)and more recent pyroclastic deposits of the Younger Fuji volcano (< 17 kyr) (Takada et al., 2016). Due to the predominantly westerly wind direction in the region, Lake Yamanaka is directly affected by pyroclastic fall-out. From 8000 to 5600 cal yr BP, the volcano was quiescent; only 0.1 km3of pyroclastic
deposits were produced during this period. Pyroclastic falls R-I and R-II particularly impacted Lake Yamanaka (Miyaji, 1988, 2007). During the following period (5600–3500 cal yr BP), few pyroclastic falls (0.3 km3)
occurred (Miyaji, 1988, 2007). From 3500 to 2300 cal yr BP, pyroclastic falls were frequent. During this period, Omuro scoria fall (3260–3056 cal yr BP;Yamamoto et al., 2005) affected the northwest of the Fuji Five Lakes region including Lake Yamanaka and its catchment (Miyaji, 1988, 2007). During the next period (2300–243 cal yr BP), the largest eruptions were the Yufune-II (2155–2039 cal yr BP; Suppl. data 1) eruption and the 1707 CE Hōei pyroclastic falls (0.7 km3), which
both impacted Lake Yamanaka (Miyaji, 1988, 2007;Fig. 1). Moreover, several lava flows (LF), such as the Takamarubi LF (≥1190–1050 cal yr BP;Takada et al., 2007), flowed around the western edge of the lake (Fig. 2B). With the exception of the 1707 CE Hōei eruption, the volcanic activity of Mt. Fuji Volcano has been low during the last 900 years (Yamamoto et al., 2005).
In addition to eruptions from Mt. Fuji, two rhyolitic tephra markers have been recognized in the Fuji Five Lakes region (e.g.,Miyaji, 1988; Nakano et al., 2007): the Kawagodaira tephra (Kg), dated to 3160–3137 cal yr BP (Tani et al., 2013), and the Kikai-Akahoya tephra (K-Ah), dated to 7165–7303 cal yr BP using14C dating (Smith et al.,
2013).
3. Dataset and methods
3.1. Seismic reflection data
We performed a seismic reflection survey on Lake Yamanaka in October 2014 using a very high resolution 3.5 kHz GEOPULSE pinger sub-bottom profiler. In total we recorded 28 km of seismic lines, char-acterized by a lateral resolution of ~1.5 m and a vertical resolution of ~10 cm (Fig. 2). We used SMT's Kingdom Suite software package for seismic visualization, seismic-stratigraphic and geological interpreta-tion. We picked strong seismic reflections and mapped these across the lake. Picked seismic horizons were imported in ArcGIS 10.3.1 and isopachs calculated to illustrate thickness variations. We used acoustic velocities of 1480 m/s in the water column and of 1600 m/s in the subsurface. To confirm the geological interpretation of the seismic data, we correlated the seismic reflection data with two sediment cores taken in the 1990s by Taba et al. (1990) and Koshimizu and Uchiyama (2002).
3.2. Gravity cores
In October 2014 we recovered five short gravity cores using a Uwitec gravity corer (Fig. 2). The cores were split, photographed, and described. A Malvern Mastersizer 2000 provided grain size distributions at 0.5 cm resolution. Loss-on-ignition quantified water and organic matter (OM) content at 1 cm resolution following the protocol defined byHeiri et al. (2001).
3.3. Integration of previous sedimentological studies
We integrate published data from two sediment cores (a 2.55 m core and a 17.65 m borehole) and correlate based on stratigraphy, diatom assemblages and pollen analysis (Fig. 3). The core of 2.55 m is com-posed of clay and silt, interrupted by eight scoria layers (Taba et al.,
1990). The most recent scoria deposit, 0.15 m thick, is attributed to the 1707 CE Hōei eruption. Based on diatom assemblages, Taba et al. (1990)recognized two units (Fig. 3). The lower unit, from 2 to 2.55 m, is defined by partially pedogenized green silt with benthic diatoms, suggesting that the basin was probably a swamp or a river at that time (Taba et al., 1990). The upper unit (from 0 to 2 m) is characterized by brown gyttja in which planktonic diatoms are dominant, indicating a lacustrine environment (Taba et al., 1990;Endo et al., 1992).
In the 17.65 m borehole, three sedimentological units are re-cognized (Koshimizu and Uchiyama, 2002; Fig. 3). Unit III (17.65–13.5 m) is mainly composed of volcanic ejecta (scoria, lapilli) and silty clay. Unit II (13.5–11.4 m) consists of black silt and clay with scoria layers attributed to the Kuroboku soil stage, a black soil rich in humus (Yoshizawa et al., 2004). The top Unit I displays 28 horizons of scoria fall-out – 4.51 m in total thickness, with thicknesses of individual layers ranging from 0.02 to 0.62 m (Adhikari et al., 2005) – interlayered with silt and clay. A 0.2 m thick debris flow lies at ~5.10 m depth (Koshimizu and Uchiyama, 2002). Unit I contains four subunits (Koshimizu and Uchiyama, 2002) based on diatom assemblages (Yoshizawa et al., 2004) and grain size analysis (Adhikari et al., 2005). Subunit I.4 (11.4–9.2 m) is composed of silty sand and a high percen-tage of periphytic diatoms. Subunit I.3 (9.2–6.0 m) is characterized by a mixture of particles from medium sand to fine silt size and by plank-tonic diatoms. Subunit I.2 (6.0–2.5 m) is composed of mixed sand and silt with a high percentage of epiphytic and benthic diatoms. Subunit I.1 (2.5–0 m) is characterized by dark brown clayey silt with sandy layers and a high percentage of planktonic diatoms. The analyses show that the basin sustained two lacustrine stages alternating with two river or swamp stages (Yoshizawa et al., 2004). In addition, three tephra layers are identified: the first scoria layer at a depth of 0.83 m is related to the Hōei eruption (1707 CE); the Kg and K-Ah tephra markers are identified at 7.3 m and 11.8 m depth, respectively (Koshimizu et al., 2007).
4. Chronology
We construct a new age-depth model, which is mainly based on recalibrated published radiocarbon ages (Taba et al., 1990;Yoshizawa et al., 2004;Yamamoto et al., 2018) and on the occurrence of Kg tephra (Koshimizu et al., 2007). Additionally, the ages of four inferred scoria (S4, RI, RII and Yufune-II) are inserted in the age-depth model (Table 1). In order to have the most reliable ages for these four scoria layers, we integrate all of the published14C dates for each scoria layer
in Oxcal 4.2 using a combine function (Bronk Ramsey, 2008) (see Suppl. data 1).
The correlation between the 2.55 m core and the 17.65 m borehole shows that the dates retrieved from the 2.55 m core are inconsistent with the stratigraphic order (Fig. 3). The shift in14C ages between the
two records is caused by the type of material that was used for dating: i.e. bulk sediment for the 2.55 m core (Taba et al., 1990) and plant remains (leaves) for the 17.65 m borehole (Koshimizu and Uchiyama, 2002). The 14C ages obtained from bulk sediment are affected by a
~600–700 year reservoir age and therefore are not included in the age-depth model.
We built a P-sequence depositional age-depth model in Oxcal 4.2. (Bronk Ramsey, 2008;Bronk Ramsey, 2009) considering scoria deposits and the debris flow as near-instantaneous events. We remove the thicknesses of these event deposits from the total depth and calculate a corrected depth. In this paper, we present an age-depth model for the upper 11.4 m of the sedimentary infill of Lake Yamanaka.
5. Results and interpretations
5.1. Morphology of the present-day lake basin
understanding of the description of the following sections, we divide the basin into western, central and eastern parts (Fig. 2A). The western part corresponds to the northwestern extremity of the lake, which in-cludes the current outlet. The central part comprises a deep flat basin
located near the northern margin of the lake. In the south, the basin is constrained by a large shallow hummocky surface with arc-shaped ridges (Geospatial Information Authority of Japan, 1963).The eastern part is relatively flat and surrounded by a floodplain (Ozaki et al., Fig. 3. Summary of previous sedimentary studies. From left to right, log of 2.55 m core (modified afterTaba et al. (1990);Endo et al. (1992)), log of 17.65 m borehole (modified afterKoshimizu and Uchiyama, 2002) with identified scoria layers (1Koshimizu et al., 2007;2Suppl. data 1), diatom assemblages (Yoshizawa et al., 2004),
grain size analysis (Adhikari et al., 2005) and pollen analysis (YIES, 2004). The correlation is based on the lithology, the diatoms and pollen assemblages (Yoshizawa et al., 2004;Taba et al., 1990;Kosugi et al., 1993). Published radiocarbon dates are also reported (3Yoshizawa et al., 2004;4Taba et al., 1990;5Yamamoto et al.,
2002). It is characterized by gas blanking preventing acoustic pene-tration. The blankingis likely due to terrestrial organic matter content in the sediments, provided by the floodplain occupying the basin to the north-east of Lake Yamanaka. The present paper will therefore focus on the western and central parts of the lake that show good acoustic pe-netration.
5.2. Interpretation of seismic reflection data 5.2.1. Seismic facies characteristics
We identify five seismic facies (SF1-SF5) throughout the basin, based on seismic reflection amplitude, internal reflection character and continuity of the seismic horizons (Mitchum et al., 1977).Table 2 de-scribes the characteristics and interpretation of these facies.
SF1 is defined by low to moderate seismic reflection amplitudes with moderate to good continuity of seismic reflectors. This seismic facies is confined to the depocenter of the Yamanaka basin. SF2 is characterized by high-amplitude continuous parallel reflections cov-ering the sedimentary infill of the basin. SF3 is defined by low- to moderate-amplitude reflections, defining a chaotic to semi-transparent facies. SF3 occurs as a unit with an irregular upper boundary and a hummocky topography. The facies unit has an overall wedge-like geo-metry with a lens-shaped tip. Such seismic characteristics are typical for
a large mass-transport deposit (e.g.,Schnellmann et al., 2005;Moernaut and De Batist, 2011; Van Daele et al., 2013). SF4 is located at the margin of the Yamanaka basin. This seismic facies is associated with low- to moderate-reflection amplitudes, and with shingled to sigmoid reflections showing a clinoform geometry. Clinoforms have been widely described in modern sediments (e.g., Mitchum et al., 1977; Pirmez et al., 1998;Liu et al., 2007) and are interpreted as delta fan/alluvial fan deposits. SF5 presents poor continuity, low seismic reflectivity of the seismic horizons and diffraction hyperbolae.
5.2.2. Seismic stratigraphy
Based on the seismic reflection profiles, we identify nine strati-graphic units (SU1 to SU9) reflecting distinct stages of the Yamanaka basin's depositional history (Fig. 4).The definition of unit constraining boundaries follows the concept ofMitchum et al. (1977). The bound-aries correspond either to unconformities (UB7) or to conformable boundaries between different seismic facies (UB1-5, 7-9). We identified and mapped the eight seismic horizons defining these boundaries through the imaged part of the Yamanaka basin (Figs. 4, 5, 6). Isopach maps constructed for each seismic unit provide valuable information on the three-dimensional depositional geometries and associated sedi-mentary processes.
The acoustic basement of the Yamanaka basin consists of a large paleodepression, with a minimum area of0.79 km2, bordered to the
west, east and north by ~8–9 m high margins. These western, eastern and northern paleomargins display slopes ranging from 2.9° to 5.4° and lie in direct continuation of the Tanzawa mountains. By contrast, the southern border of the Yamanaka basin corresponds to the continuation of the E-N-E flank of Mt. Fuji and is characterized by gentle slopes of ~1.1°.
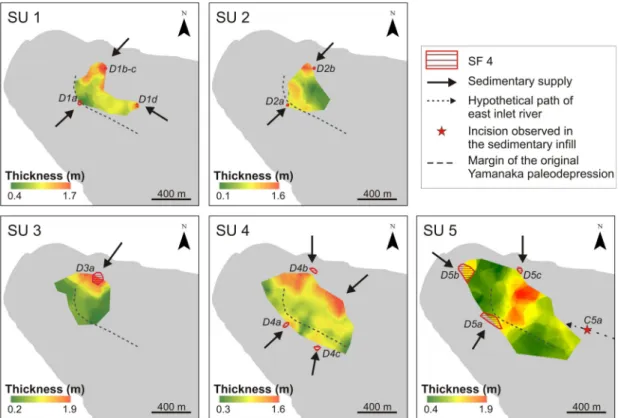
SU1, the oldest seismic unit, is only identified in the western basin, overlying the top of SF5. SU1 mainly consists of SF1 and SF4 on the margins. On the southern and northern margins of the paleodepression, clinoforms (D1a and D1b;Fig. 6and Suppl. datas 2, 3) of SF4 downlap onto SF5. The D1b clinoforms are the direct extension of a present-day, active alluvial fan further north that is related to a small steep catch-ment draining the Tanzawa mountains. The isopach map shows that sediment accumulation related to the SF4 pattern reached 1.7 m in the north (Fig. 7). The difference in thickness between the northern and the southern alluvial fans (D1a–b) imply that the main sediment supply during that period came from the Tanzawa mountains. By contrast, the thickness of SU1 is reduced in the central part of the paleodepression (0.4–0.7 m).
As was the case for SU1, SU2 is only imaged in the western part of the paleodepression and consists mainly of SF1 and of SF4 on the margins. We identify clinoforms (SF4) on the southern (D2a) and northern margins (D2b) of the paleodepression (Figs. 6, 7; Suppl. datas 2, 3). The D2a clinoforms are stacked above D1a clinoforms, presenting an aggradational structure (Fig. 6). To the south, the D2b clinoforms are formed by subparallel to oblique reflections downlapping onto UB1. The isopach map shows that SU2 is thicker close to the margin at the location of the clinoforms. At 1.60 m, D2b is twice as thick as D2a, suggesting that most of the sedimentary input came from the Tanzawa mountains. In the center of the paleodepression, SU2 is relatively thin (on average, 0.6 m).
SU3 occurs in the same area as SU2 and, as was the case for SU1 and SU2, consists of SF1 and SF4 on the margins. On the northern margin, thin D3a clinoforms (SF4) downlap onto SU2, suggesting that sediment was supplied from the north. No clinoforms are present along the southern margin. SU3 is mainly restricted to the center of the paleo-depression. Its maximum thickness of 1.9 m corresponds to the D3a alluvial fan located in the lowest part of the paleodepression (Fig. 7).
SU4, present in the central and western part of the basin, consists of SF1 and SF4 on the northern (D4a and D4c)and southern (D4b)margins, contrasting with SU3 in which no SF4 occurred along the southern margin. On the southern margin, D4a clinoforms characterized by a
Table 1
Tephra markers and radiocarbon dating performed on the 2.55 m and 17.65 m long cores.
Core Depth Sample 14C age (yr BP) Calibrate age (cal yr BP) 2.55 m ~1.76 m Bulk sediment 1890 ± 170 1,2,9 2185–1516 (89.5%) 2306–2231 (3.2%) 1463–1416 (1.7%) ~2.01 m Bulk sediment 1830 ± 260 1,2,9 2380–1261 (94.9%) ~2.22 m Bulk sediment 2460 ± 170 1,2,9 2925–2116 (95.4%) ~2.53 m Bulk sediment 2470 ± 170 1,2,9 2929–2123 (95.4%) 17.65 m borehole 0.83 m Hoei 243 3 3.53 m Plant remains 1640 ± 60 4 1639–1400 (87.1%) 1698–1646 (8.3%) 4.20 m Yufune-II 2131 ± 217 2155–2039 (88.3%) 2295–2271 (5.5%) 2021–2010 (1.6%) 4.94 m Plant remains 2307 ± 56 5 2485–2152 (95.4%) Plant remains 2290 ± 38 5 2357–2299 (58.4%) 2255–2158 (37%) 7.30 m Kg tephra 3160–31376 8.00 m Plant remains 3300 ± 30 5 3592–3453 (95.4%) 9.80 m R II 4580 ± 508 5196–5049 (38.7%) 5332–5211 (36.2%) 5459–5375 (20.6%) 10.30 m R I 4680 ± 508 5485–5311 (80.1%) 5580–5515 (15.3%) 11.00 m S4 4750 ± 508 5590–5445 (80.1%) 5409–5325 (15.3%) 11.60 m Bulk sediment 6160 ± 80 4 7256–6858 (95.2%) 1Taba et al. (1990). 2Endo et al. (1992). 3YIES (2004). 4Yoshizawa et al. (2004). 5Yamamoto et al. (2018).
6Dated by wiggle matching -Tani et al. (2013). 7SeeSuppl. data 1.
8Yamamoto et al. (2005)
9Biased14C, not in the stratigraphic order. Therefore, biased14C dates were
shingled pattern, are present at the same location as the D1a and D2a clinoforms (Figs. 6, 7 and Suppl. data 3). SF1 mainly occurs in the center of the paleodepression. It is defined by reflections of moderate continuity onlapping onto SU3. The SU 4 isopach map shows large sedimentary accumulations in front of the alluvial fans (1.6 m to the north and 1.2 m to the south). The sedimentary infill is thin in the central part of the basin, reaching a maximum of 0.85 m (Fig. 7).
SU5 is composed of SF1, SF2 and SF4. SU5 alternates between low-to moderate- amplitude reflections (SF1) and continuous high-ampli-tude reflections (SF2). SF1 seismic horizons onlap onto D4a (Fig. 6and Suppl. data 4). Two small clinoform units (D5a and D5c in Fig. 7), backstepping the D4a and D4b clinoforms, are present on the southern shoulder and along the northern paleomargin. For the first time, clinoforms (D5b) are present in the northwestern part of the Yamanaka basin (Fig. 8D). Clinoform package D5b progrades towards the south-east from the northwest edge of the basin, providing evidence for a northwestern sedimentary input. The locations of the clinoform packages suggest an increase of the water level. However, we observe one minor unconformity at ~0.025 s TWT (~6.30 m depth below lake bottom), indicating that the water level fluctuated during this period (Fig. 6). Along the north-eastern edge of the paleodepression, truncated reflections evidence a paleochannel (C5a) incising SU5 (Suppl. data 4). The maximum thickness of SU5 occurs in the center of the depression (1.9 m), from where it progressively decreases towards the edge of the basin (Fig. 7).
SU6 is present in a large part of the basin (Fig. 8). It is a complex unit in which reflections with low to moderate continuity (SF1) are dominant in the lower half of the unit and SF2 in the upper part.
Numerous and large packages of SF4 (D6a–d;Fig. 8) occur all along the depression margins. At the northwestern end of the lake, D6b is formed by four laterally stacked lens-shaped bodies (D6b_1–4;Fig. 8). D6b 1–3 are characterized by aggradational/retrogradational patterns. D6b_4 progrades towards the southeast. At the top of D6b4, a small frontal channel is observed (Fig. 8), indicating a lowering of the lake level. Additional clinoform bodies (SF4) are present along the southern and northern margins of the lake (D6a,c,d;Fig. 8). In the southeast of the Yamanaka basin, the chaotic pattern of SF3 is present (Fig. 9, Suppl. data 4). It corresponds to a mass-transport deposit, with an average thickness of 4 m and a minimum area of ca. 1 km2. Towards the south
and east, the thickness of the MTD is not well constrained as the acoustic signal does not penetrate it completely (Fig. 4). The geometry of the MTD varies strongly within the basin. In its most proximal part along the lake's southern margin, the MTD shows a broad ~4.5 m high relief, giving way towards the northeast to depressions and 3 to 4 m high ridges. The bathymetric map (Geospatial information, 1963) shows that the ridges have a crescent shape. The MTD ends with a wedge with a semi-transparent facies. In the following sections, the MTD is referred to as the Yamanaka MTD. In the east of the central part of the basin, truncated reflections imply river incision (C6a inFig. 8) is present in the lower part of SU6 (Suppl. data 4). This paleochannel (C6a) was filled by the Yamanaka MTD. The great variability in thickness of SU6 (from 0.8 up to 7.8 m) is caused by the presence of alluvial fans (SF4) and the Yamanaka MTD (SF3) (Fig. 8).
SU7 mainly consists of SF2 and of two small packages of SF4 on the northern margin (D7a, D7b;Fig. 10). The lower boundary of the unit (UB6) is a major unconformity well expressed at the northwestern end
Table 2
Seismic facies and their geological interpretations.
Seismic facies (SF) Reflection characteristics Geological interpretation
SF1 Low to high amplitude, moderate continuity reflections Terrigenous, organic rich lacustrine/ marshy sediments
SF2 High amplitude, good continuity reflections Scoria layers
SF3 Low to moderate amplitude, chaotic seismic facies,
hummocky top surface and flat bottom, large scale wedge geometry with lenses at its tip
Large mass-transport deposits that correlated with debris flow identified in the borehole.
SF4 Low to moderate amplitude inclined reflections Alluvial Fan deposits; no lithological
information available as the borehole did not sample it.
SF5 Low amplitude and poor continuity reflection, hyperbola Soil stage made of Fuji scoria in a silty matrix: base of sedimentary infill.
of the lake and on its southern margin where alluvial fans (D6b and D6a) in the underlying unit SU6 are truncated (Fig. 10D). Along the lake's northern margin, SF4 comprises three small stacked lens-shaped bodies (SF4) showing an aggradational pattern (D7a and D7b). D7b is characterized by higher seismic amplitudes, suggesting a coarser-grained composition. The total thickness of the stacked deposits reaches up to ~2.1 m. At the western end of the lake, SU7 shows two deep channel incisions (C7a_1 and C7a_2) carved up to 1.6 m into the un-derlying SU6 and the lower part of SU7 (Fig. 10). The incisions are draped by the upper SF2 package of SU7. They correspond to the river channel described byTaba et al. (1999). The river path suggested by Taba et al. (1999) is generally in agreement with our observations. Slight differences between the two datasets are related to the geometry of the data grid. To the east of the central part of the basin, another
incised channel (C7b) is present at the same location as C6a and C5a (Suppl. data 4). In the north, blanking occurs, covering an area of 84,000 m2 (Fig. 10A). The thickness of SU7 is relatively constant at
around 0.7–1.0 m in the western and central part of the basin and reaches a maximum at the northern foot of the Yamanaka MTD (Fig. 10A). Above the MTD, the thickness is drastically reduced: 0.15 to 0.3 m at the top of ridges and up to 0.6 m in the depression behind the frontal crescent-shaped ridge. SU7 is thin at the incised channel C7b (~0.5 m).
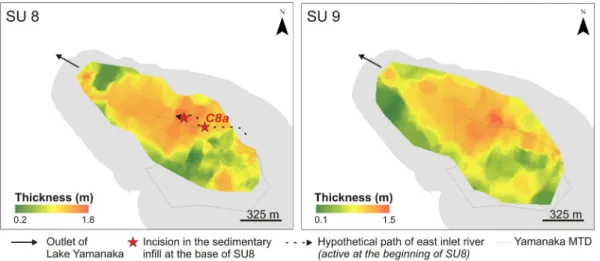
SU8 is composed of SF1 and of SF2 at the top (i.e., the 1707 CE Hōei eruption). The basal reflections in SU8 onlap onto UB7 (Figs. 6 and 10D) and progressively fill the C7a paleochannels (Fig. 10). To the east, a paleochannel (C8a) is still present, incising into the underlying SU7 (Suppl. data 4). In the upper part of SU8 the paleochannel starts to be
Fig. 4. WNW-ESE seismic profile (A) and its interpretation (B). The seismic profile (YAM1419) is dominated by the Yamanaka MTD and acoustic blanking in the east-south-east. Seismic boundaries (UB1 to UB9) determine nine seismic units (SU1 to SU9).
filled by sediments. The thickness of SU8 ranges from 0.2 m above the Yamanaka MTD and 0.6 m above the alluvial fan in SU6 (D6b) to 1.8 m in the other parts of the basin and above the C7a paleochannel. Above some of the lows of the Yamanaka MTD, SF1 reflections onlap the
surface of the MTD (Figs. 9, 11).
SU9 consists only of SF1. In this seismic unit, the subparallel seismic reflections onlap onto UB8 (Figs. 5, 6, 8D,10, Suppl. datas 2, 3). The maximum thickness of SU9 is about 1.50 m in the central part of the
Fig. 5. Correlation between NW – SE seismic reflection profile (YAM19) and the projection of the 17.65 m deep borehole. A. NW – SE seismic reflection profile of the central part of Lake Yamanaka. B. Interpretations of NW – SE seismic reflection profile. C. Correlation between NW – SE seismic reflection profile and the projection of the 17.65 m borehole (Koshimizu and Uchiyama, 2002) located 300 m from the seismic reflection data.
lake (Fig. 11). The thickness decreases towards the south and reaches ~0.10 m at the margin of the lake. Above the Yamanaka MTD, the thickness of SU9 is still strongly reduced to ~0.4 m.
5.2.3. Correlation of seismic reflection data and the sediment cores
We present a detailed correlation between the seismic reflection profiles and the sediment cores. Due to the presence of acoustic blanking at depth, we correlate the 17.65 m borehole (Koshimizu and Uchiyama, 2002) with a northwest-southeast seismic reflection profile located 300 m to the west of the borehole site. (Fig. 5). As the central basin is relatively flat and the entire sedimentary sequence well imaged, correlation to the 300 m distant borehole is justified (Fig. 5).
Sedimentological analyses of sediments sampled by the short gravity cores show that the uppermost interval (UI.1) is made of clayey
silt characterized by 75–80% water and 12% of organic matter content on average. On the seismic reflection profiles, the water-sediment in-terface is characterized by very weak reflectance (e.g., Suppl. data 2). The uppermost part of the lacustrine sedimentary infill (fine silt) is imaged as a parallel-stratified facies with low-amplitude continuous reflections (SF1) (Fig. 5). In the sediment cores, the fine silt interval is interrupted by a scoria layer of up to 0.15 m thickness (SF2) from the 1707 CE Hōei eruption (Fig. 5). On the seismic reflection profiles, the Hōei scoria deposit is represented by a band of three distinct high-amplitude continuous reflections at about 0.019 s (~1.2 m) draping the sub-bottom lake morphology. Below the Hōei scoria, the 17.65 m borehole shows a 1.6 m thick lacustrine interval consisting of fine silt (Fig. 5). On the seismic reflection profile presented inFig. 5, the drill section is characterized by parallel-stratified, low-amplitude continuous
Fig. 6. SSW-NNE seismic profile (YAM04) and the seismic boundaries. SSW-NNE seismic profile (A) and its interpretation (B). On the seismic reflection profile, ancient alluvial fans are recognized during SU1 (D1a), SU2 (D2a), SU 4 (D4a,b), SU5 (D5a,c), SU6 (D6a,c) and SU7 (D7a).
reflections, similar to the seismic pattern of the uppermost lacustrine interval (SF1) (Fig. 5). The unit below UI.1 (UI.2;Fig. 3) is dominated by scoria deposits interbedded by sand and coarse silt layers. The high-amplitude continuous reflections draping and overlying the sedimen-tary infill on the seismic reflection profile represent scoria deposits (SF2) (Fig. 5). The intervals of high-amplitude continuous reflections are separated by unconformities or thin semi-transparent discontinuous seismic horizons in the morphological lows corresponding to the in-tercalated sand and coarse silt layers. A 0.20 m thick debris flow identified in the 17.65 m borehole is imaged in the seismic data as a unit with an irregular geometry and a chaotic to semi-transparent seismic facies (SF3). Below the debris flow, two thick scoria layers (~0.30 m and ~0.40 m) are located close to the base of UI.2 and at the top of UI.3 in the 17.65 m borehole. They correspond to high-amplitude continuous reflections forming a distinct reflective layer just below the chaotic interval. Except for the ~0.55 m thick scoria layer at the top of the unit, UI.3 is mostly composed of medium to fine silt showing the same seismic pattern as UI.1 (parallel-stratified, low-amplitude con-tinuous reflections; SF1). Below, the seismic reflection profile shows high-amplitude semi-continuous reflections and low- to moderate-am-plitude discontinuous reflections. This pattern corresponds to the coarsesilty sand layers interbedded with scoria deposits (UI.4). The top of unit UII consists of black volcanic ash-rich soil and corresponds to an interval with seismic horizons of poor continuity and low amplitude with hyperbolae (SF5). The deepest sedimentary unit (UIII) is not identified in the seismic reflection profiles.
5.2.4. Age-Depth model
We present the age-depth model for the upper 11.4 m of the 17.65 m borehole inFig. 12. The age-depth model allows us to constrain the age of the different seismic units, which we present inTable 3. According to the age-depth model, the Yamanaka MTD occurred around 2696–2307 cal yr BP. The model cannot constrain the age of SU8; however, the identification of the Hōei scoria layer at the top of SU8 limits its age. SU8 started around 1050 cal yr BP and ended with the
Hōei eruption (243 cal yr BP; 1707 CE).
5.3. Depositional history of Lake Yamanaka
Fig. 13summarizes the depositional history of Yamanaka. From ca. 5500 cal yr BP to ca. 5050 cal yr BP (SU1–SU4;Fig. 13), the sedimen-tary infill in the Yamanaka basin was mostly restricted to the center of the paleodepression and within the alluvial fans at its margin. During this period, the basin was occupied by a floodplain wetland. The pre-sence of wetlands has previously been inferred from benthic diatoms identified in the 17.65 m borehole (Fig. 3;Yoshizawa et al., 2004). The emplacement of the alluvial fans shows that the water level was stable, except during the deposition of SU3 during which the water level reached its lowest level. The sedimentary infill of the basin consisted mostly of fluvial deposits. This is supported by the thick sandy layers recorded in the 17.65 m borehole (Koshimizu and Uchiyama, 2002).
Based on the distributions of the alluvial fans, two main sedimen-tary sources can be inferred: (i) the Tanzawa mountains for the alluvial fans along the northern margin of the paleobasin and (ii) the north-eastern flank of the Mt. Fuji for the alluvial fans along the southern margin. The northern alluvial fans were fed by streams that drained steep, but smaller catchments, covering only 2.75 km2, whereas the
southern alluvial fans were fed by streams draining the northeastern flank of Mt. Fuji (min. 33 km2). The difference in thickness between the
northern and southern alluvial fans suggests that surface erosion on the east-north-east flank of the volcano was limited. The landscape was probably very stable at that time. During this period, the activity of Mt. Fuji was very low (Miyaji, 1988, 2007) with only three main scoria fall-outs (S4, RI and RII;Fig. 3). Additionally, no river channel outlet in-cised the paleodepression margin or the sedimentary infill, again sug-gesting a stable landscape.
From ca. 5050 cal yr BP to ca. 3050 cal yr BP (SU5;Fig. 13), alluvial fans were active in the northern and southern parts of the Yamanaka basin. During this period, two additional river inlets were present. The presence of a prograding alluvial fan in the northwest, close to the
Fig. 7. Isopach maps and distribution of the sedimentary facies and seismic units (SU1–SU5). The thickness of the isopach was calculated using an average uniform seismic velocity of 1600 m/s. Only the western and central parts of the lake are imaged.
current lake outlet, indicates that a river was flowing directly into the paleodepression from the northwest, contrasting to the present situa-tion. The presence of a northwestern river inlet suggest that the catchment of the Yamanaka depression was larger. The second river inlet, evidenced by a C5a channel (Suppl. data 4), was located at the east of the paleodepression. During this period, we assume that there was no outlet river. Significant amounts of sediment accumulated in the center of the paleodepression; this is not represented by alluvial fan
facies but by a lacustrine sediment facies, therefore indicating the presence of the first restricted lacustrine body (Fig. 7). Diatom assem-blages indicate that the water level was sufficient for the occurrence of planktonic diatoms at the borehole location (Fig. 3;Yoshizawa et al., 2004). The backstepping of the northern and southern alluvial fans supports a rise in the water level. As the water level rose, lacustrine sediments progressively filled the eastern river inlet channel. The oc-currence of one unconformity within SU5 shows that the lake level
Fig. 8. Seismic unit 6. A. Isopach map of SU6. The thickness varies from 0.8 m to 7.8 m. B. Map of the seismic facies. C. NW-SE seismic reflection profile (YAM01) crossing SU6. D. Interpretation of the NW-SE seismic reflection profile. Prograding alluvial fans are observed during SU6. “C” represents small river incision at the top of the alluvial fans.
fluctuated significantly (Fig. 6). The grain size analysis indicates an overall upward fining trend with large fluctuations, supporting lake water level variations (Fig. 3;Adhikari et al., 2005).
From ca. 3050 cal yr BP to ca. 2050 cal yr BP (SU6;Fig. 13), the lake water level fluctuated but tended to increase during the first half of the period and decrease in the second half of the period. Four lines of evidence support the decrease in lake water level: (i) the progradation associated with the lowering of the topset/foreset/bottomset locations of the alluvial fans (e.g., D6b3 and D6b4;Fig. 8D), (ii) the incision of the most inward alluvial fans (Fig. 8D), (iii) the occurrence of large unconformities (Fig. 6) and (iv) the presence of an eastern river inlet channel (Figs. 8B, Suppl. data 4). Shortly after the lake-level fall, the southern margin of the lake collapsed, resulting in a large mass-trans-port deposit covering 1 km2 (Fig. 9). The Yamanaka MTD, emplaced
around 2696–2307 cal yr BP, strongly modified the morphology of the basin (Fig. 9) and dammed the eastern river inlet channel leading to a decrease in water supply to the lake (Suppl. data 4). Detailed analysis of
satellite images and onland investigations show no trace of a subaerial scarp or landslide deposits, suggesting that the Yamanaka MTD was triggered by the destabilization of the southern lake margin. The hummocky surface of the Yamanaka MTD formed closed depressions and ridges. Progressively, the small depressions were occupied by ponds (Fig. 9).In terms of sedimentary inputs, alluvial fans prograded significantly, indicating an increase in sediment supply (Fig. 8). During this period, Mt. Fuji was particularly active, with numerous scoria fall-outs covering the lake and its entire catchment (Miyaji, 1988, 2007). The reworking of this loose volcanic cover provided an additional se-dimentary source. The northwestern alluvial fan prograded the most, covering at least 157,000 m2, an area much larger than any other fan
observed in the seismic grid. The associated volume of sediments re-presents about ~220,000 m3. This is an order of magnitude larger than
the volume associated with the northern fan (~11,790 m3), related to
the erosion of the Tanzawa mountains, and still significantly higher than the volume of sediments accumulated on the southern alluvial fan
Fig. 9. Location and geometry of the Yamanaka MTD. The detailed bathymetric map (modified afterGeospatial Information Authority of Japan, 1963) with isopach thickness map superimposed shows the spatial distribution of the Yamanaka MTD within the center part of the lake. The morphology of the Yamanaka MTD is imaged on the A–B, C–D, E–F seismic reflection profiles. On the seismic reflection profiles, the Yamanaka MTD appears as a semi-transparent chaotic seismic facies showing an upper hummocky surface (SF3). The A–B seismic reflection profile shows that low amplitude continuous seismic horizons are observed above the Yamanaka MTD. These seismic features are interpreted as ponds. Ponds are mainly focused in the center part of the central basin occupying closed depressions formed at the surface of the MTD. The seismic profile C–D suggests that the MTD is the result of the collapse of the southern lake margin. The A–B seismic reflection profile show that the sedimentary infill dip changed towards the northwest after the Yamanaka MTD.
(58,700 m3), which is directly related to the erosion of the northeastern
flank of Mt. Fuji. The importance of the sediment supply from the northwest is probably partly linkedto the Omuro eruption (3260–3056 cal yr BP; Yamamoto et al., 2005). The thickness of the
prograding alluvial fan (max. 3 m), emplaced at the western end of the Yamanaka depression, would be related to the reworking of the Omuro scoria by the northwestern river inlet.Omuro scoria fall-out mostly af-fected the northwestern extremity of Lake Yamanaka's catchment
Fig. 10. Seismic unit 7. A. Isopach map of SU7. The thickness of the sedimentary infill deposited during SU7 ranges from 0.2 to 1.2 m. Two sources of sedimentary supply (black arrows) are located in the north. Blanking occurring at the beginning of SU7 is represented by grey hatched area and is interpreted as a floodplain. B. Black lines indicate river incisions observed in the seismic reflection data.The ancient river incision mapped byTaba et al. (1999)is represented in blue. C. SSW-NNE seismic reflection profile (YAM 03) crossing the northwestern extremity of the lake. D. Interpretation of the SSW-NNE seismic reflection profile above. A river incised alluvial fan deposits from SU6 (D6b) during SU7 (C7a_1 and C7a_2). Sediment progressively filled the incision during SU8. (For interpretation of the references to color in this figure legend, the reader is referred to the web version of this article.)
Fig. 11. Isopach maps of SU8 (left) and SU9 (right). The black arrows represent the outlet of the lake. The sediment infill deposited during SU8 evidences the river incisionthat occurred during SU7. Above the Yamanaka MTD, the thicknesses of the lacustrine deposits are reduced in both units.
Fig. 12. Age-Depth Model of the upper 11.4 m of the 17.65 m borehole using a P-Sequence model in Oxcal 4.2. (Bronk Ramsey, 2009;Reimer et al., 2013). The corrected depth is represented in meters. The grey shaded area represents the time period where the age-depth model is poorly constrained.
(Fig. 1). Therefore, only the northwestern alluvial fans are impacted by this scoria. As the western end of the Yamanaka depression is covered by a younger lava flow, we have not at present observed geological evidence for a northwestern river inlet feeding the northwestern allu-vial fan (Fig. 2A; Takamarubi lava flow) (Takada et al., 2016).
From ca. 2050 cal yr BP to ca. 1050 cal yr BP (SU7), the lake ceased to exist (Fig. 13). This observation is supported by: (i) the absence of planktonic diatoms in the borehole (Fig. 3;Yoshizawa et al., 2004), and (ii) the presence of a now submerged forest in the south of Yamanaka basin. The submerged forest is currently lying at a water depth between 4 m and 11 m and dates to 1860–1320 cal yr BP (Taba et al., 1999). A river channel deeply incised the northwestern alluvial fans. The ab-sence of an alluvial fan at the northwestern end of the Yamanaka basin contrasts with the previous period and suggests that the northwestern
Fig. 13. Reconstruction of the evolution of Lake Yamanaka. Between ca. 5500 cal yr BP and ca. 5050 cal yr BP (SU1 to SU4), the paleodepression was occupied by a floodplain wetland. The extent of the floodplain wetlands is a minimum and is inferred from the seismic reflection data. From ca. 5050 cal yr BP and ca. 3050 cal yr BP (SU5), the first lacustrine body was recognized. The extent of Lake Yamanaka varied through time due to water level fluctuations. Around 2050 cal yr BP, the water level decreased and small ponds occurred above the Yamanaka MTD. The water level decreased drastically and Lake Yamanaka became a river between ca. 2050 cal yr BP and ca. 1050 cal yr BP. After ca. 1050 cal yr BP, the Takamarubi lava flow dammed the northwestern outlet of the lake. As a result, lake water level increased. At present the maximum water depth is 14.3 m.
Table 3
Modeled age of the seismic units (SU1-SU9) using Oxcal 4.2. (Bronk Ramsey, 2009).
Modeled age (cal yr BP)
From To
SU1-SU4 5697–5323 5440–4717
SU5 5440–4717 3256–2861
SU6 3256–2861 2154–2007
SU7 2154–2007 1030–243a
SU8 1030–243⁎ 243 (Hoei eruption)
SU9 243 (Hoei eruption) Present day (1998 CE)
water inflow disappeared. A river occupied the Yamanaka basin, flowing from the east to the northwest. The imaged channel suggests that the river was located at the foot of the Yamanaka MTD and close to northern alluvial fans. The floodplain associated with the river is im-aged on the seismic reflection profiles by the wide blanking area, probably related to the presence of organic-rich sediments (Fig. 10A, Suppl. data 2). It is during this period that a river outlet initiated at the western extremity of the lake. Above the Yamanaka MTD, the number of ponds occupying depressions decreased, and only one depression (min. 33,450 m2) was still occupied by a pond (Fig. 13). In terms of
sedimentary input, only the northern alluvial fans draining the Tan-zawa mountains were active. The thickness of these deposits and their high reflection amplitudes suggest that the deposits are mainly com-posed of reworked scoria from the steep northern slope of the Tanzawa mountains. Indeed, during that period, three large scoria fall-outs oc-curred (Fig. 3), the largest one being the Yufune-II fall-out, creating a deposit of up to 0.42 m in thickness. The reworking of scoria fall-out is also well imaged above the Yamanaka MTD, where the thickness of the deposited sediments is a direct consequence of the erosion of the scoria fall-out (e.g., Yufune-II) on its highs and redeposition in the ponds (Fig. 9).
Between ca. 1050 cal yr BP and 243 cal yr BP (SU8), a lake formed again, expanding and occupying the western and central part of the Yamanaka basin (Fig. 13). At the beginning of this period, the eastern river inlet was still active (Suppl. data 4). Lacustrine sediments pro-gressively filled the river channels (Fig. 10). In the southeast, above the Yamanaka MTD, a series of ponds were again formed in the depressions created by its hummocky surface (Fig. 9).
During the most recent period, i.e. after the Hōei eruption (243 cal yr BP; SU 9), onlap configurations on the lake margin indicate an increase in water level. The water level rose and connected the ponds located above the Yamanaka MTD with the main lake.
5.4. Cause of lake water fluctuation
In Lake Yamanaka, water level fluctuations are directly related to the variation in water supply (i.e. precipitation rate, surface runoff, ground water input and modification of river inlet/outlet paths). Surface runoff and ground water supply may have changed through time due to the eruptive history of Mt. Fuji. The permeability of the soil changed after volcanic eruptions due to the deposition of porous vol-caniclastic sediments. Therefore, surface runoff may have reduced after a volcanic eruption. Underground water flow may also have been modulated by the vegetation cover. An extended arboreal cover will depend on ground water and would use a larger amount of water than non-arboreal plants (e.g.,Zhou et al., 2013). Additionally, the filling of the paleodepression by sediments also contributed to the increase of water level.
From ca. 5500 cal yr BP to ca. 5050 cal yr BP (SU1-SU4), the pa-leodepression was occupied by floodplain wetlands.Yamamoto et al. (2018)show a decrease in δ13C and average chailength values of
n-alkanoic acids from ca. 6400 to 4000 cal yr BP suggesting a shift to-wards a wetter climate around Lake Yamanaka. The increase of pre-cipitation rate contributed to the growth of the wetlands. At the same time, S4, RI and RII scoria fall-outs accumulated in Yamanaka basin's catchment, leading to an increase in soil porosity. The soil modification and the increase in precipitation would have helped establish the ar-boreal forest documented by pollen assemblages during this period (Fig. 3).
The first lacustrine stage (SU5 and partly SU6) occurred after ca. 5050 cal yr BP. From ca. 5050 cal yr BP to ca. 3050 cal yr BP, the basin was occupied by a shallow lake. The water level tended to increase during this period. We attribute this increase to three connected factors: (i) the increase in the precipitation rate (Yamamoto et al., 2018), (ii) the presence of two additional river inlets at the eastern and north-western end of the existing paleodepression (Fig. 13), and (iii) the
reduction of the volume of the paleodepression caused by the accu-mulation of sediments during the previous period on the inner side of the depression (Fig. 8D).
From ca. 3050 cal yr BP to ca. 2050 cal yr BP (SU6), the water level of Lake Yamanaka fluctuated. In the second half of the period, the water level started to decrease,even though the climate around Lake Yamanaka became wetter.Three factors may have contributed to the lowering of the water level: (i) the modification of the soil permeability following large volcanic eruptions; (ii) a change in the vegetation cover following volcanic eruptions and (iii) the occurrence of the Yamanaka MTD. Diatom analysis shows that the largest decrease in lake water level occurred after the deposition of three thick scoria layers in a short time span. Scoria deposits increase the soil permeability, leading to a decrease of the surface runoff.Pollen analysis suggests that the volcanic eruptions also affected the vegetation cover, with a disappearance of non-arboreal species at that time (Fig. 3; YIES, 2004). The arboreal vegetation around Lake Yamanaka required a greater water supply, increasing evapotranspiration and, therefore, potentially contributing to the decrease of the lake water level. The last factor is the emplace-ment of the Yamanaka MTD (2696–2307 cal yr BP), which dammed the eastern river inlet, which previously provided runoff water to the western paleodepression. The damming of the river lead to the reduc-tion of water input into Lake Yamanaka.
From ca. 2050 cal yr BP to ca. 1050 cal yr BP (SU7), the water level decreased drastically leading to the formation of a river. During the same period, the northern river inlet disappeared, curtailing the input of water and sediments at the northwestern end of the depression. The northwestern river inlet was probably dammed by a lava flow.Uesugi et al. (1995) identified two old pyroclastics flows (1900 BP and 1500–1600 BP) close to the current outlet of Lake Yamanaka. They could potentially have impacted and dammed the western river inlet of the lake. During this period, the Yamanaka MTD modified the mor-phology of the Yamanaka basin, shifting its depocenter towards the north and reversing the slope gradient (Fig. 9). Consequently, the river flowed towards the north-west and incised the ancient northwestern alluvial fan deposits.
Since ca. 1050 cal yr BP, the water level increased leading to the formation of the current Lake Yamanaka. This increase of the lake level has been attributed to the damming of the river by the Takamarubi lava flow (≥1190–1050 cal yr BP;Takada et al., 2007) (Taba et al., 1990; Endo et al., 1992;Kosugi et al., 1992;Kosugi et al., 1993;Adhikari et al., 2005). The age of the transition given by our age-depth model is concurrent with the emplacement of the Takamarubi lava flow. In ad-dition to the damming of the outlet, precipitation also increased during this period.Shimada et al. (2002)noted an increase in the precipitation rate after 1250 cal yr BP in Lake Yogo (240 km west of Lake Yamanaka), which is correlated with the precipitation pattern in South Korea (Wada, 1916; Korea Meteorological Administration,www.kma.go.kr/ intro.html), suggesting a regional change.
The lake level was not strongly affected by the Hōei eruption (243 cal yr BP) and the water level continued to rise in the aftermath of the eruption. In October 2014, the maximum water depth was 14.3 m.
6. Conclusions
Combining borehole information with high-resolution seismic re-flection data allows us to obtain a more complete understanding of paleoenvironments at the foot of Mt. Fuji. The development of an age-depth model helps us to trace a regional history of the Yamanaka area. The water level of Lake Yamanaka has fluctuated since its formation (ca. 5500 cal yr BP). From ca. 5500 cal yr BP to ca. 5050 cal yr BP, the sediment infill was very limited and mostly restricted to alluvial fans draining the north slope. The landscape was very stable and the erosion on northeastern flank of Mt. Fuji was relatively limited. During this period, the Yamanaka basin was occupied by floodplain wetlands. From ca. 5050 cal yr BP to ca. 3050 cal yr BP, the water level increased and
the wetland became a lake. We infer large water level fluctuations. From ca. 3050 cal yr BP to ca. 2050 cal yr BP, the water level decreased progressively, leading to a reduction in lake extent. During the lowering of the water level, a 1 km2mass-transport deposit (the Yamanaka MTD)
occurred, modifying the physiography of the lakefloor. From ca. 2050 cal yr BP to ca. 1050 cal yr BP, the lake disappeared and the de-pression was occupied by a river flowing towards the northwest. Ponds occupied morphological lows formed by the mass-transport deposit. From ca. 1050 cal yr BP to present day the water level rose again, connecting the ponds with the main lake situated at the front of the mass-transport deposit. Since then, the water level has continued to rise to the current level.
Fluctuations in lake water level are the results of several factors that may be interconnected: (i) volcanic eruptions (scoria fall-out and lava flows), (ii) margin destabilization (the Yamanaka MTD), (iii) changes in river inlets and therefore variation in water supplies, (iv) changes in precipitation patterns, and (v) changes in vegetation cover. In the fu-ture, the age-depth model could be refined with more radiocarbon dating samples to better constrain the age of the sedimentary deposits. Supplementary data to this article can be found online athttps:// doi.org/10.1016/j.palaeo.2018.09.028.
Acknowledgments
This research was undertaken as part of the QuakeRecNankai pro-ject, funded by the Belgian Science Policy Office (BELSPO BRAIN-be BR/121/A2). K. De Rycker and E. Boes are acknowledged for technical support during the survey in 2014. We are thankful to the two anon-ymous reviewers for constructive feedback that significantly improved the manuscript. Laura Lamair is currently funded by BELSPO.
References
Adhikari, D.P., Koshimizu, S., Uchiyama, T., 2005. Variation in particle size distribution in the core sediment of Lake Yamanaka, northeastern foot of Mt. Fuji and its pa-leoenvironmental significance. In: Proceeding of the 15th Symposium on Geo-en-vironments and Geo-Technics, pp. 191–196.
Bronk Ramsey, C., 2008. Deposition models for chronological records. Quat. Sci. Rev. 27 (1–2), 42–60.
Bronk Ramsey, C., 2009. Bayesian analysis of radiocarbon dates. Radiocarbon 51 (1), 337–360.
Endo, K., Taba, Y., Miyaji, N., Nakai, N., Shinohara, T., Miyahara, T., Kosugi, M., 1992. Geomorphological study on the formation of Lake Yamanaka, along the foot of Fuji Volcano. In: Proceeding of the Institute of Natural Sciences, Nihon University (Applied Earth Sciences). 27. pp. 33–36 (In Japanese with abstract in English). Geospatial Information Authority of Japan. 1963. 1:10,000 scale bathymetric map “Lake
Yamanaka”.
Heiri, O., Lotter, A.F., Lemcke, G., 2001. Loss on ignition as a method for estimating organic and carbonate content in sediments: reproducibility and comparability of results. J. Paleolimnol. 25, 101–110.
Hirabayashi, K., Yoshizawa, K., Yoshida, N., Kazama, F., 2004. Progress of eutrophication and change of chironomid fauna in Lake Yamanakako, Japan. Limnology 5, 47–53. Koshimizu, S., Uchiyama, T., 2002. Geological outline of the borehole cores from
Fuji-Five Lakes surrounding Mt. Fuji, Central Japan. Daishiki 34, 9–18.
Koshimizu, S., Uchiyama, T., Yamamoto, G., 2007. Volcanic history of Mt. Fuji recorded in borehole cores from Fuji Five Lakes surrounding Mt. Fuji. Fuji. In: Aramaki, S., Fujii, T., Nakada, S., Miyaji, N. (Eds.), Fuji Volcano, Yamanashi Institute of Environmental Sciences, pp. 365–374 (in Japanese with English abstract). Kosugi, M., Ikeda, M., Eguchi, S., 1992. Origin and evolution of Lake Yamanaka, Fuji
Volcanic Region, Central Japan - (2) record on the natural history of environments during Last 2500 years, based on multiple fossil analyses. In: Proceeding of the Institute of Natural Sciences, Nihon University (Applied Earth Sciences). 27. pp. 37–44 (In Japanese with abstract in English).
Kosugi, M., Ikeda, M., Endo, K., 1993. Environmental history during the last 2500 years recorded in sediments of Lake Yamanaka, based on the fundamental study of trans-portation and sedimentation of pollen grains. Mem. Geol. Soc. Jpn.: Lakes-Origin, Environ. Geol. 39, 41–52 (In Japanese with abstract in English).
Last, W.M., Smol, J.P. (Eds.), 2001. Tracking Environmental Change Using Lake Sediments. Volume 1: Basin Analysis, Coring, and Chronological Techniques. Kluwer Academic Publishers, Dordrecht (548 pp).
Liu, J., Saito, Y., Wang, H., Yang, Z., Nakashima, R., 2007. Sedimentary evolution of the Holocene subaqueous clinoform off the Shandong Peninsula in the Yellow Sea. Mar. Geol. 236, 165–187.
Machida, H., 1964. Tephrochronological study of volcano Fuji and adjacent areas. J. Geogr. (Chigakuzasshi) 73, 337–350 (in Japanese with English abstract). Mitchum, J.R.M., Vail, P.R., Sangree, J.B., 1977. Seismic stratigraphy and global changes
of sea level, part 6: stratigraphic interpretation of seismic reflection patterns in de-positional sequences. In: Payton, C.E. (Ed.), Seismic Stratigraphy Applications to Hydrocarbon Exploration, American Association of Petroleum Geologists Memoir 26, pp. 117–133.
Miyaji, N., 1988. History of younger Fuji volcano. J. Geol. Soc. Jpn. 94, 433–452 (in Japanese with English abstract).
Miyaji, N., 2007. Eruptive history, eruption rate and scale of eruptions for the Fuji Volcano during the last 11,000 years, Fuji volcano. In: Aramaki, S., Fujii, T., Nakada, S., Miyaji, N. (Eds.), Fuji Volcano. Yamanashi Institute of Environmental Sciences, pp. 79–95 (in Japanese with English abstract).
Moernaut, J., De Batist, M., 2011. Frontal emplacement and mobility of sublacustrine landslides: results from morphometric and seismostratigraphic analysis. Mar. Geol. 285, 29–45.
Nakano, S., Takada, A., Ishizuka, Y., Suzuki, Y., Chiba, T., Arai, K., Kobayashi, M., Tajima, Y., 2007. Eruption ages of younger-stage lava flows and older stage pyroclastic cones on the North Eastern foot of Fuji Volcano, Japan. Bull. Geol. Surv. Jpn 57 (11/12), 387–407.
Ozaki, M., Makimoto, H., Sugiyama, Y., Mimura, K., Sakai, A., Kubo, K., Kato, H., Komazawa, M., Hiroshima, T., Sudo, S., 2002. Geological map of Japan 1: 200 000, Kofu. Geological Survey of Japan, AIST, Tsukuba, Japan (in Japanese with English abstract).
Pirmez, C., Pratson, L.F., Steckler, M.S., 1998. Clinoform development by advection-dif-fusion of suspended sediment: modeling and comparison to natural systems. J. Geophys. Res. 103, 24141–24157.
Reimer, P.J., Bard, E., Bayliss, A., Beck, J.W., Blackwell, P.G., Bronk Ramsey, C., Buck, C.E., Cheng, H., Edwards, R.L., Friedrich, M., Grootes, P.M., Guilderson, T.P., Haflidason, H., Hajdas, I., Hatté, C., Heaton, T.J., Homann, D.L., Hogg, A.G., Hughen, K.A., Kaiser, K.F., Kromer, B., Manning, S.W., Niu, M., Reimer, R.W., Richards, D.A., Scott, E.M., Southon, J.R., Staff, R. A, Turney, C.S.M., van der Plicht, J., 2013. IntCal13 and Marine13 radiocarbon age calibration curves 0–50,000 years cal BP. Radiocarbon 55, 1869–1887.
Schnellmann, M., Anselmetti, F.S., Giardini, D., McKenzie, J.A., 2005. Mass movement-induced fold-and-thrust belt structures in unconsolidated sediments in Lake Lucerne (Switzerland). Sedimentology 52, 271–289.
Shimada, T., Kashiwaya, K., Hyodo, M., Masuzawa, T., 2002. Hydro-environmental fluctuation in a lake catchment system during the late Holocene inferred from Lake Yogo sediments. Trans. Jpn. Geomorphol. 23, 415–431 (in Japanese with English abstract and captions).
Smith, V.C., Staff, R.A., Blockley, S.P.E., Bronk Ramsey, C., Nakagawa, T., Mark, D.F., Takemura, K., Danhara, T., Suigetsu 2006 Project Members, 2013. Identification and correlation of visible tephras in the Lake Suigetsu SG06 sedimentary archive, Japan: chronostratigraphic markers for synchronising of east Asian/West Pacific palaeocli-matic records across the last 150 ka. Quat. Sci. Rev. 67, 121–137.
Taba, Y., Kosugi, M., Endo, K., Miyaji, N., 1990. Origin and evolution of Lake Yamanaka, Fuji Volcanic Region, Central Japan - (1) stratigraphy and paleoenvironments based on the borehole core in the lake. In: Proceeding of the Institute of Natural Sciences, Nihon University (Applied Earth Sciences). 25. pp. 39–44 (In Japanese with abstract in English).
Taba, Y., Seino, H., Endo, H., Komori, J., 1999. Subaqueous topography by acoustic survey in the Westernmost part of Lake Yamanaka. In: Proceeding of the Institute of Natural Sciences, Nihon University (Geosystem Sciences). 34. pp. 121–128 (In Japanese with abstract in English).
Takada, A., Ishizuka, Y., Nakano, S., Yamamoto, T., Kobayashi, M., Suzuki, Y., 2007. Characteristic and evolution inferred from eruptive fissures of Fuji volcano, Japan. In: Aramaki, S., Fujii, T., Nakada, S., Miyaji, N. (Eds.), Fuji Volcano. Yamanashi Institute of Environmental Sciences, pp. 183–202 (in Japanese with English abstract). Takada, A., Yamamoto, T., Ishizuka, Y., Nakano, S., 2016. Geological Map of Fuji
Volcano, 2nd Edition (Ver.1). Geological Survey of Japan, AIST, Tsukuba, Japan. Tani, S., Kitagawa, H., Hong, W., Park, J.H., Sung, K.S., Park, G., 2013. Age determination
of the Kawagodaira volcanic eruption in Japan by 14C wiggle-matching. In: Proceedings of the 21st International Radiocarbon Conference. 55 (2–3). pp. 748–752.
Uesugi, Y., Ikeda, K., Suda, A., Yanagisawa, T., Okamoto, M., Suzuki, S., 1995. On the Takamarubi lavas erupted from the northeastern flank of Fuji Volcano. Bull. Assoc. Kanto Quat. Res. 19, 3–21 (in Japanese).
Van Daele, M., Versteeg, W., Pino, M., Urrutia, R., De Batist, M., 2013. Widespread de-formation of basin-plain sediments in Aysén Fjord (Chile) due to impact by earth-quake-triggered, onshore-generated mass movements. Mar. Geol. 337, 67–79. Wada, Y., 1916. Chosen Kodai Kansoku Kiroku Chousa Houkoku (aReport on Past
Observational Records in Korea). Observatory at Governor of Korea's Office, Seoul (in Japanese).
Yamamoto, T., Takada, A., Ishizuka, Y., Nakano, S., 2005. Chronology of the products of Fuji volcano based on new radiometric carbon ages. Bull. Geol. Surv. Jpn 50, 53–70 (in Japanese with English abstract).
Yamamoto, S., Uchiyama, T., Miyairi, Y., Yokoyama, Y., 2018. Volcanic and environ-mental influences of Mt. Fuji on the δ13C of terrestrially-derived n-alkanoic acids in
sediment from Lake Yamanaka, Central Japan. Org. Geochem. 119 (C), 50–58. YIES, 2004. YIES Research Report 8. Yamanashi Prefecture, Japan: Yamanashi Institute of
Environmental Sciences. (106 pp (in Japanese with English captions)). Yoshizawa, K., Koshimizu, S., Uchiyama, T., 2004. Environmental change based on
diatom assemblages from Lake Yamanaka at the northern foot of Mt. Fuji, Central Japan. Rep. Res. Edu. Ctr. Inlandwat. Environ. 2, 105–110.
Zhou, Y., Wenninger, J., Yang, Z., Yin, L., Huang, J., Hou, L., Wang, X., Zhang, D., Uhlenbrook, S., 2013. Groundwater–surface water interactions, vegetation de-pendencies and implications for water resources management in the semi-arid Hailiutu River catchment, China – a synthesis. Hydrol. Earth Syst. Sci. 17, 2435–2447.