Université de Montréal
Performances de la puce exon et son application
dans l’analyse de l’épissage alternatif associé à la
métastase du cancer de sein
Par
Amandine Bemmo
Faculté de médecine
Programme de bio-informatique
Mémoire présenté à la Faculté des études supérieures en vue de l’obtention du grade de maitrise es sciences (M. Sc.) en Bioinformatique
Université de Montréal
Faculté des études supérieures
Ce mémoire intitulé :
Performances de la puce exon et son application
dans l’analyse de l’épissage alternatif associé à la
métastase du cancer de sein
Présenté par :
Amandine Bemmo
a été évalué par un jury composé des personnes suivantes :
Sébastien Lemieux
Président-rapporteurMiklós Csürös
Directeur de rechercheJacek Majewski
CodirecteurMichael Hallett
Membre du juryRésumé
Nous montrons l’utilisation de la puce exon d’Affymetrix pour l’analyse simultanée de l’expression des gènes et de la variation d’isoformes. Nous avons utilisé les échantillons d’ARN du cerveau et des tissus de référence qui ont été antérieurement utilisés dans l’étude du consortium MicroArray Quality Control (MAQC). Nous démontrons une forte concordance de la quantification de l’expression des gènes entre trois plateformes d’expression populaires à savoir la puce exon d’Affymetrix, la puce Illumina et la puce U133A d’Affymetrix. Plus intéressant nous montrons que la majorité des discordances entre les trois plateformes résulterait des positions différentes des sondes à travers les plateformes et que les variations d’isoforme exactes ne peuvent être identifiées que par la puce exon. Nous avons détecté avec succès, entre les tissus de référence et ceux du cerveau, une centaine de cas d’évènements d’épissage alternatif.
La puce exon est requise dans l’analyse de l’épissage alternatif associé aux pathologies telles que les cancers et les troubles neurologiques. Comme application de cette technologie, nous avons analysé les variations d’épissage dans la métastase du cancer de sein développé dans le model de la souris. Nous avons utilisé une gamme bien définie de trois lignées de tumeur mammaire ayant différents potentiels métastatiques. Par des analyses statistiques, nous avons répertorié 2623 transcripts présentant des variations d’expression et d’isoformes entre les types de tumeur. Une analyse du réseau de gènes montre qu’environ la moitié d’entre eux est impliquée dans plusieurs activités cellulaires, ainsi que dans nombreux cancers et désordres génétiques.
Abstract
We demonstrate how the Affymetrix Exon Array, can be used to simultaneously profile gene expression level, and detect variations at the isoform level. We use a well studied set of brain and reference RNA samples previously used by the MicroArray Quality Control (MAQC) consortium study. We demonstrate a high concordance of gene expression measurements among three popular expression platforms – Affymetrix Exon Array, Illumina, and Affymetrix 3’ targeted array (U133A). More interestingly, we show that in many cases of discordant results, the effect can be explained by differential probe placements across platforms, and that the exact isoform change can only be captured by the Exon Array. Finally, we are able to detect hundreds of cases of splicing, transcript initiation, and termination differences between the brain and reference tissue samples.
We propose that the Exon Array is a highly effective tool for transcript isoform profiling, and that it should be used in a variety of systems where such changes are known to be associated with diseases, such as neurological disorders and cancer. As application, we used the Affymetrix Exon Array to identify metastatis-specific alternative splicing in mouse model of breast cancer at the whole genome level. We utilize a well characterized series of three mouse mammary tumor lines exhibiting varying levels of metastatic potential. We catalogued 2623 transcripts which exhibit splicing aberrations during the progression of cancer. A genetic pathway analysis shows the half of them implicated in several cell activities, cancers and genetic disorders.
Table des matières
Résumé...iv
Abstract... v
Table des matières ...vi
Liste des tableaux ...ix
Liste des figures... x
Sigles et abréviations...xii
Remerciements...xiii
Introduction ... 14
Épissage alternatif ... 14
Rôle de l’épissage alternatif ... 17
Épissage alternatif et la pathogenèse ... 18
Identification de l’épissage alternatif ... 19
Objectifs et méthodologie... 23
Contribution... 24
Chapitre I Performances de la puce exon d’Affymetrix dans l’analyse de l’expression des gènes et la variation d’isoformes ... 25
Abstract... 29
Background ... 29
Results... 29
Conclusions... 30
Variability across labs... 32
Variability across summarization methods... 35
Variability across platforms. ... 35
Alternative Isoform Detection. ... 36
Differences in Amplification and Labelling Protocols. ... 39
Using the Exon Array to Profile Alternative Isoforms. ... 41
Edge Bias Effect... 46
Discussion ... 51
Conclusions ... 55
Methods... 56
Exon Array Hybridization... 56
Data Pre-processing and Analysis ... 57
Probeset and Gene Mapping ... 57
Authors' contributions ... 57
Acknowledgements ... 58
Additional files ... 59
Chapitre II Application de la puce exon d’Affymetrix à l’épissage alternatif dans la métastase du cancer de sein... 61
Synopsis ... 62
Abstract... 64
Introduction... 64
Results... 67
Gene expression patterns in tumors ... 67
Tumor-specific gene expression and isoform variations... 69
Discussion ... 92
Conclusion and perspective ... 101
Materials and methods ... 102
Cell Culture and Transfections... 102
Mammary gland injection and spontaneous Metastasis Assay ... 102
RNA extraction and microarray hybridization... 103
Data pre-processing and analysis... 104
Authors' contributions ... 108
Acknowledgments ... 108
Appendix– outlier identification and verification of metastatic potential ... 109
Supplementary Data... 114
Discussion et conclusion générales... 115
Liste des tableaux
Table 2.1: List of some alternatively expressed probesets... 80 Table 2.2: Top biological functions and diseases retrieved by the gene pathway analysis ... 81 Table 2.3: List of some significant genes that have important implications in normal biological processes and diseases ... 83 Table 2.4: For the three studies compared (our study against two prior studies), number of common genes differently expressed between the least metastatic sample and the most metastatic sample ... 94 Table 2.5: Common consistent differently expressed genes between the least metastatic and the most metastatic samples of each study... 96 Table 2.6: Common inconsistent differently expressed genes between the least metastatic and the most metastatic samples of each study... 98 Table 2.7: Correlation of the gene expression fold-changes of our study with two prior studies
Liste des figures
Figure 0.1: Différents types d’épissage alternatif... 16 Figure 1.1: PCA plots at the probe set level show two main sources of variation among the 20 samples... 33 Figure 1.2: Comparison of log2(FC) detected between the biological samples for the two labs
... 34 Figure 1.3: Exon array analysis of the ELAVL1 gene expression differences between brain and reference tissues... 37 Figure 1.4: Visualization of expression patterns of ELAVL1 gene... 38 Figure 1.5: Correlation of fold changes between Affymetrix U133, Illumina, and the Affymetrix Exon Array ... 40 Figure 1.6 : Examples of Candidates from Splicing Index Analysis ... 451
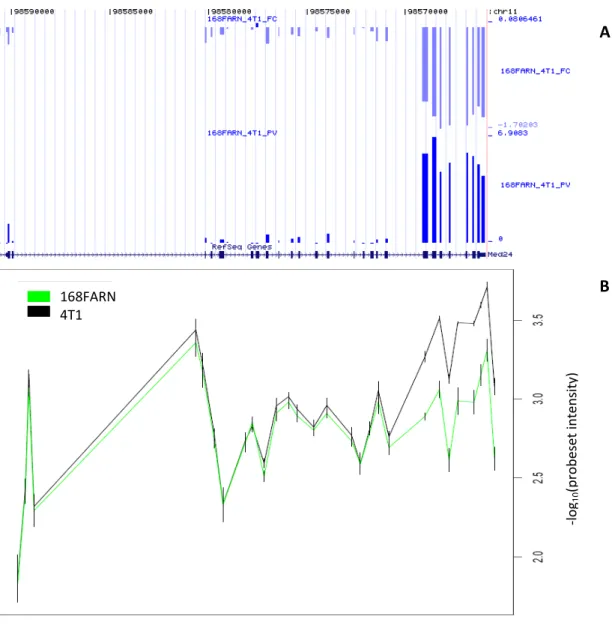
Figure 1.7: Edge bias... 48 Figure 1.8: Exon Array average gene expression index as a function of transcript (mRNA) length ... 50 Figure 2.1: PCA plot at the metaprobeset level shows the clustering of samples... 68 Figure 2.2: Visualization of the expression pattern of MED24 gene showing an alternative initiation or termination event... 71 Figure 2.3: Visualisation of the expression pattern of CD44 gene showing several internal cassette exons and intron inclusions ... 72 Figure 2.4: Visualisation of the expression pattern of CDH1 gene showing a whole gene expression change... 73
Figure 2.6: Visualisation of the expression pattern of SLC25A29 gene showing a differential
3’ UTR site ... 75
Figure 2.7: Visualisation of the expression pattern of SLC39A14 gene showing a cassette exon ... 76
Figure 2.8 : Proportion of gene expressions variation ... 781 Figure 2.9: Network of molecular interactions containing products of statistically significant genes in breast cancer... 88
Figure 2.10: Network of molecular interactions containing products of statistically significant genes in breast cancer... 90
Figure 2.11: Network of molecular interactions containing products of statistically significant genes in breast cancer... 91
Figure 2.12: workflow of probeset and metaprobeset filtering steps ... 106
Figure 2.13: protocol flow of gene viualisation and manual curation... 107
Sigles et abréviations
ADNc : acide désoxyribonucléique complémentaire ARN: acide ribonucléiqueARNm: acide ribonucléique messager AS : alternative splicing
ASE : alternative splicing event ESE: exonic splicing enhancer ESS: exonic splicing silencer EST: expressed sequence tag FDR: false discovery rate ISE: intronic splicing enhancer ISS: intronic splicing silencer mRNA: messenger ribonucleic acid PCA: principal component analysis PCR: polymerase chain reaction
pré-ARNm : acide ribonucléique prémessager
qRT-PCR: quantitative reverse transcription polymerase chain reaction RNA: ribonucleic acid
RT-PCR: reverse transcriptase polymerase chain reaction SI : splicing index
Remerciements
L’accomplissement de ce travail de maitrise est le fruit de nombreux échanges et collaborations.
Je tiens tout d’abord à remercier mon codirecteur Dr Jacek Majweski qui m’a fait confiance en m’accueillant dans son laboratoire et en m’offrant l’opportunité de réaliser ce projet. Je lui exprime également ma gratitude pour sa contribution à la mise en forme de mon anglais boiteux.
Je remercie mon directeur Dr Miklos Csuros pour son encadrement et son soutien.
Je remercie tous les membres de mon laboratoire, en particulier David Benovoy, pour leur aide et leur esprit d’équipe.
Je remercie tout les membres du jury de s’être mis au service de l’évaluation de mon mémoire : les professeurs Sébastien Lemieux et Michael Hallett.
Enfin je remercie toute ma famille en particulier mon fiancé Clovis Simo et ma mère Odette Djuidje pour leur soutien moral, leurs encouragements et tous leurs sacrifices pour que je poursuive mes études dans les meilleurs conditions.
Introduction
Épissage alternatif
Chez les eucaryotes, la plupart des gènes sont constitués de parties transcrites (exons) interrompues par des parties non-codantes (introns). L’épissage est un processus qui consiste à l’excision des introns et la ligature des exons. Chez les eucaryotes supérieurs ce processus est effectué lors de la maturation du pré-ARNm à l’intérieur du noyau cellulaire. Le spliceosome qui catalyse cette réaction est constitué d’un ensemble de cinq ribonucléoprotéiques et de plus d’une centaine de protéines [1]. A travers plusieurs interactions protéine-protéine, ARN-ARN ou protéine-ARN, le spliceosome reconnaît la jonction exon-intron et déclenche deux réactions de trans-estérification qui retirent les introns du pré-ARNm et lient les exons. L’ARNm mature sera transporté dans le cytoplasme et traduit en protéine.
Dans la cellule, il existe une variante de l’épissage qui produit différents ARNm d’un même locus génomique. Ce processus, appelé épissage alternatif, est un mécanisme régulateur permettant à un pré-ARNm d’être épissé en plusieurs ARNm matures pouvant coder pour des protéines différentes. Les facteurs cis-régulateurs (ESE, ISE, ESS et ISS) qui dans la plupart des cas sont des sites de liaison des facteurs d’épissage, inhibent (ISS, ESS) ou induisent (ESE, ISE) l’usage d’un site d’épissage (exon ou intron) ou créent une structure secondaire de l’ARN qui affecte la reconnaissance du site d’épissage [2, 3]. La génération de plusieurs isoformes d’un même ARNm précurseur augmente la diversité protéique. Chez
Il existe plusieurs types d’épissages alternatifs (Figure 0.1 [6]) : le saut d’exon, l’exclusion mutuelle d’exons, la rétention d’intron, le site d’épissage alternatif en 5’ et le site d’épissage alternatif en 3’. Le saut d’exon c’est lorsque pour deux isoformes d’un même gène, un exon est présent dans l’un et absent dans l’autre. On parle d’exclusion mutuelle d’exons lorsque pour deux exons et deux isoformes donnés, dans le premier isoforme un exon est inclus et l’autre absent tandis que celui absent dans le premier isoforme est inclus dans le second isoforme et celui présent dans le premier est absent dans le second isoforme. La rétention d’intron c’est lorsqu’une partie ou la totalité d’une séquence intronique est incluse dans l’ARNm mature. La sélection alternative du site 5’ d’épissage de l’exon est lorsque la partialité du côté 5’ de l’exon est incluse dans le transcrit; lorsque le même phénomène se produit à l’extrémité 3’ on parle de sélection alternative du site 3’ d’épissage.
Figure 0.1: Différents types d’épissage alternatif
Les exons sont représentés par des boxes verts (exons constitutifs) et marrons (exons alternatifs) et les introns par des traits noirs. Les différents événements possibles sont le saut d’exon (Cassette exon), l’exclusion mutuelle d’exons (Mutually exclusive exon), la rétention d’intron (Intron rétention), le site d’épissage alternatif en 5’ (Alt 5’ss) et le site d’épissage alternatif en 3’ (Alt 3’ss). Cependant le choix multiple du promoteur d’initiation à la transcription (Alternative promoters) peut imposer le type d’épissage. L’épissage alternatif peut conduire à l’utilisation de sites de polyadenylation différents (Alternative polyadenylation).
Rôle de l’épissage alternatif
La regulation de l’épissage alternatif est soumise à plusieurs facteurs telles que la spécificité des tissus, le stade de développement, les activités physiologiques, la détermination du sexe et la réponse aux facteurs de stress. L’activité physiologique peut varier d’un isoforme à l’autre; les changements de la séquence de l’ARNm par l’épissage alternatif peuvent se répercuter sur la protéine résultante et modifier ainsi ses propriétés et sa fonction. C’est le cas des gènes Bcl-x, Caspase-9, Ced-4, Caspase-2/Ich-1 et hTid-1 qui encodent à la fois la variante anti-apoptose et la variante pro-apoptose [7, 8].
Près de 9.5% des mutations cataloguées par le Human Gene Mutation Database (HGMG) affecteraient l’épissage [9]. Les variations dans les éléments cis-régulateurs pourraient être responsables d’un nombre substantiel d’épissages alternatifs. Une transition de G à A dans l’exon 18 du gène de susceptibilité au cancer de sein BRCA1 altère le ESE et cause ainsi le saut de l’exon 18 [10]. Une insertion d’un T devant le di-nucléotide très conservé GT dans le site donneur de l’intron 4 du gène FAP, qui est un un suppresseur de tumeur, mène au saut de l’exon 4 et conduit à une forme atténuée de la Polypose recto-colique familiale [11]. Plusieurs études ont montré le lien entre le changement du niveau d’expression des facteurs trans-acting et l’épissage alternatif associé aux formations cancéreuses. En utilisant le modèle de la souris du cancer de sein, Stickeler et al [12] ont observé lors du développement du cancer, l’augmentation progressive du niveau d’expression des protéines SR en parallèle avec l’épissage alternatif du gène CD44. Les protéines SR (riches en dipeptides sérine/arginine) forment une famille de facteurs d’épissage trans-acting qui jouent un rôle important dans la régulation de l’épissage alternatif de nombreux gènes incluant CD44.
L’ajout, le retrait ou la variation de la taille des exons ou encore la rétention d’intron peut causer un décalage du cadre de lecture de la traduction introduisant des codons stop prématurés ou absents, ainsi que des substitutions d’acides aminés. La traduction de tels transcrits donnerait des protéines troncaturées ou dysfonctionnelles. Ce type d’ARNm aberrant est en général reconnu et dégradé par les mécanismes de control de qualité de l’ARNm tels que nonsense-mediated mRNA decay [9] ou le nonstop Mediated mRNA Decay [13, 14]
Épissage alternatif et la pathogenèse
La variation de l’épissage alternatif entre les individus crée une diversité phénotypique et peut également causer des désordres génétiques. Plusieurs maladies, telles que la fibrose kystique et les cancers, ont un lien avec les mutations ou variations dans les facteurs cis-acting ou trans-acting qui conduisent aux transcrits aberrants et à la production de protéines défectueuses. La surexpression du facteur trans-acting HMGA1a (HydroxyMethylGlutaryl coenzyme A1a) qui lie l’exon 5 cause un isoforme aberrant du gène PS2 (presenilin-2) dans lequel l’exon 5 est absent; cet isoforme est une caractéristique de la maladie d’Alzheimer [15].
Nombreux pré-ARNm subissent des variations d’épissage dans plusieurs types de cancer durant les phases de développement, progression et/ou de métastase. Par exemple, le gène CD44 codant pour une protéine d’adhésion, de prolifération et de migration cellulaires montre une variante d’épissage inhabituelle dans le cancer de sein. Il inclut une
métastatique [12]. Un autre cas est le saut de l’exon 18, dû à une mutation du gène BRCA1, qui altère l’ESE de cet exon. Ce saut entraîne la suppression de 26 acides aminés dans une région essentielle aux fonctions de réparation de l’ADN, de régulation de la transcription et de suppression de tumeur de BRCA1 [16]. Un grand nombre de transcrits aberrants du gène FHIT, un suppresseur de tumeur, ont été découverts dans plusieurs tumeurs humaines telles que les tumeurs gastriques, cervicales, thyroïdiennes et testiculaires [9]. Ces transcrits résultent des sauts d’exons, des sites d’épissage alternatif en 3’ et 5’ et des inclusions d’introns. L’impact de ces variantes est l’inactivation du suppresseur de tumeur en réduisant la concentration de l’ARNm de la forme fonctionnelle de FHIT [9]. Pour mieux élucider le mécanisme et la régulation de l’épissage alternatif, une étape cruciale serait l’identification des événements d’épissage alternatif.
Identification de l’épissage alternatif
Jusqu'à présent, la technique la plus fiable d’identification et de validation des événements d’épissage alternatif est le séquençage de l’ADNc. Diverses méthodes telles que la RT-PCR et le Northem blot sont également très utilisées. Toutefois, la puissance de ces méthodes demeure limitée pour l’analyse des formes d’épissage alternatif dans l’ensemble des tissus ou dans des conditions pathologiques telles que les stades de développement d’un cancer. Plusieurs approches d’identification de l’épissage alternatif dans l’ensemble du génome ont vu le jour notamment les approches bioinformatiques basées sur l’alignement des ARNm et des ESTs de la séquence génomique correspondante, les puces à ADN et les puces à oligonucleotides.
Plusieurs études sur l’épissage alternatif ont utilisé la méthode de l’alignement des ARNm et des ESTs ou l’alignement de l’ARNm, des ESTs et de la séquence génomique correspondante. Le cluster des ESTs correspondant à la séquence génomique est aligné avec l’ARNm, et parfois avec la séquence génomique également, en utilisant les outils d’alignement tels que BLAST [17]. Cependant, cette méthode présente plusieurs inconvénients : le biais de couverture proche de l’extrémité 3’ du transcrit, les erreurs de séquençage des ESTs, la faible qualité des bases de données des ESTs due à la contamination par les séquences génomiques ou les séquences d’ARNm partiellement épissées et pouvant introduire de faux positifs d’évènements de rétention d’introns; on note également la faible couverture de plusieurs types de tissus et les différents types de protocoles entre les laboratoires.
Les puces ADN se sont révélées être des outils puissants pour analyser le niveau d’expression de plusieurs gènes en une seule expérimentation. Plusieurs approches utilisant la technologie des puces ADN telles que la puce à jonction d’exons et la puce à fibre optique ont été utilisées avec succès [18, 19] mais présentent toutefois des limites. Plusieurs études [18, 20] ont démontré l’utilisation de la puce à jonction d’exons pour l’analyse de l’épissage alternatif. Les sondes de cette dernière ciblent les jonctions exon-exon puisque les différents isoformes d’un gène ont des jonctions exon-exon différentes. Cette approche est très efficace pour l’analyse des variations d’épissage connues. Cependant elle est en général incapable d’identifier les nouveaux sites d’épissage notamment aux extremités 3’ et 5’ ainsi que les combinaisons de plusieurs types d’événements d’épissage alternatif dans le même ARNm. Yakley et al [19] ont développé une nouvelle approche combinant la puce à fibre
cette technique ne permet pas l’identification de nouveaux événements d’épissage alternatif car elle requiert une connaissance préalable des structures exon-intron.
Un autre exemple de plateforme d’analyse de l’épissage alternatif est la puce SpliceArray [21] de la firme Exonhit qui estime l’intensité d’expression des isoformes des transcrits. Cette dernière combine les sondes interrogeant les jonctions exon-exon et celles interrogeant les corps d’exons pour mesurer le niveau d’expression des isoformes. Mais comme la puce à jonctions exon-exon, elle requiert une connaissance préalable de la structure de l’isoforme et ne permet donc pas l’identification de nouveaux isoformes. On note également la puce SpliceExpress [22] de la firme Jivan Biologics, ayant un principe similaire à la puce spliceArray, qui interroge les jonctions exon-exon et les jonctions intron-exon pour tester l’occurrence d’un isoforme; cependant elle est également limitée pour la découverte de nouveaux événements d’épissage alternatif.
A fin d’augmenter la probabilité de découvrir les variations et structure d’épissages inconnues, un nouvel outil est né. Il s’agit de la puce exon, une innovation d’Affymetrix [23]; elle permet l’analyse de l’épissage alternatif à l’échelle des transcrits et également à l’échelle des exons. C’est un outil pouvant analyser individuellement les exons (ou les parties d’exons) comme des objets indépendants et permet ainsi d’observer les sauts ou inclusions d’exons dans les transcrits. Ceci n’est pas possible ou est non optimal avec les puces traditionnelles. Cet outil prend également en charge les événements d’épissage alternatif aux extremités 3’ et 5’ du gène. Les algorithmes de conception de sondes utilisent une vaste variété de collections d’exons et transcrits prédits ou identifiés telles que ceux des banques Ensembl et GenScan. La puce exon contient approximativement 5.4 millions de sondes constituant 1.4 millions d’ensemble de sondes (probeset) interrogeant
individuellement plus d’un million d’exons dans les régions transcrites connues ou prédites. Les probesets d’un gène sont regroupés ensemble (en un metaprobeset) pour estimer l’intensité d’expression du gène. Les probesets sont conçus à partir des PSRs (probe
selection region) qui sont des séquences génomiques cibles. Dans la majorité des cas, un
PSR interroge un exon. La taille moyenne d’un PSR est de 123 paires de base avec une taille minimale de 25 paires de base. Près de 90% des PSRs sont représentés par 4 sondes. L’interrogation de chaque région génique cible par plusieurs sondes (les 4 sondes qui constituent chaque probeset) a pour avantage d’améliorer la confiance statistique, de réduire l’impact des sondes inconsistantes et d’améliorer le ratio signal-bruit comparativement aux puces (exemple de SpliceArray et SpliceExpress) qui utilisent une sonde par région génique cible. De plus, à l’echelle du transcrit, la puce exon fournit une estimation robuste du niveau d’expression des gènes car le nombre de sondes par séquence de référence du gène varie entre 30 et 40 et est reparti sur tout l’ensemble du transcrit comparativement aux puces à extremités 3’ ciblées dont les sondes sont situées uniquement vers l’extrémité 3’ du transcrit.
Il serait très couteux pour les puces à jonctions d’exons et/ou d’introns de tester l’expression de tous les isoformes possible d’un même transcrit. Les nouvelles structures de transcrits prédites par la puce exon peuvent être utilisées comme cibles par ces puces, ceci en profilant les isoformes résultants des nouveaux événements d’épissage alternatif identifiés par la puce exon.
Objectifs et méthodologie
La puce exon a été utilisée avec succès dans plusieurs étude [24-26]. Cependant ses performances sont peu connues en particulier comparativement aux puces classiques. Nous voulons démontrer que la puce exon est effectivement un outil puissant et flexible permettant l’analyse des variations d’épissage y compris l’initiation et la terminaison de la transcription. Pour ce faire, nous utilisons l’ARN du jeu de données de l’étude MAQC pour l’hybridation de la puce exon que nous comparons avec deux autres puces très communes à savoir Illumina et Affymetrix U133. Par la suite nous voulons appliquer cette nouvelle technologie à l’investigation des variations d’épissage dans le cancer de sein développé dans le modèle de la souris. Trois lignées cellulaires cancéreuses mammaires humaines (168FARN, 4T07 et 66C14) ayant des potentiels métastatiques différents ont été utilisées. Les lignées seront injectées aux souris et formeront des tumeurs après un certain temps de croissance. L’ARN sera extrait des cellules tumorales et l’expression des gènes sera quantifiée avec la puce exon d’Affymetrix. Par des méthodes statistiques, les gènes différemment exprimés ou présentant des variations d’isoformes dans les tumeurs seront répertoriés et par la suite utilisés dans une analyse de réseau de gènes pour identifier leur pertinence biologique et pathologique.
Contribution
Dans la première partie, j’ai fait les analyses statistiques et la production des figures pour :
- la variation et concordance entre les laboratoires
- la variation due au type de méthode de sommation utilisée pour déterminer le niveau d’expression des gènes
- la variation entre les différentes plateformes
- l’effet du biais du protocole d’amplification de la puce exon aux extrémités du transcrit.
Dans la seconde partie, j’ai effectué la rédaction de l’article et la totalité des analyses informatiques et statistiques à savoir :
- l’estimation du niveau d’expression des exons et des gènes
- les différents étapes de filtrage des données pour obtenir les gènes et exons les plus significatifs
- les analyses d’événements d’épissage alternatif entre les différents types de tumeurs
- l’analyse du réseau des gènes significatifs - la préparation des figures.
Chapitre I Performances de la puce
exon d’Affymetrix dans l’analyse
de l’expression des gènes et la
variation d’isoformes
Correction
After the publication of the paper presented in this chapter, we were alerted to an error in our manuscript. The x-axis labels for Figure 1.7 were inverted. They should read from left to right: “Distance from the 5’ end” and “Distance from the 3’ end”, respectively. This does not affect our original interpretation of the edge bias effect presented in our original publication in any way.
In this chapter we have taken into account the erratum by replacing the original Figure 7.1 by the figure of the erratum published (BMC Genomics. 2009 Mar 23;10).
BMC Genomics
This Provisional PDF corresponds to the article as it appeared upon acceptance. Fully formattedPDF and full text (HTML) versions will be made available soon.
Gene Expression and Isoform Variation Analysis using Affymetrix Exon
Arrays
BMC Genomics 2008, 9:529 doi:10.1186/1471-2164-9-529
ISSN 1471-2164
Article type Methodology article Submission date 25 July 2008 Acceptance date 7 November 2008 Publication date 7 November 2008
Article URL http://www.biomedcentral.com/1471-2164/9/529
Like all articles in BMC journals, this peer-reviewed article was published immediately upon acceptance. It can be downloaded, printed and distributed freely for any purposes (see
copyright notice below).
Articles in BMC journals are listed in PubMed and archived at PubMed Central.
For information about publishing your research in BMC journals or any BioMed Central journal, go to
http://www.biomedcentral.com/info/authors
© 2008 Bemmo et al., licensee BioMed Central Ltd.
This is an open access article distributed under the terms of the Creative Commons Attribution License (http://creativecommons.org/licenses/by/2.0), which permits unrestricted use, distribution, and reproduction in any medium, provided the original work is properly cited.
Amandine Bemmo David Benovoy Tony Kwan Daniel J Gaffney Roderick V Jensen Jacek Majewski
Gene Expression and Isoform Variation Analysis using
Affymetrix Exon Arrays
Amandine Bemmo1,3*, David Benovoy2,3*, Tony Kwan2,3, Daniel Gaffney2,3, Roderick V. Jensen,4 Jacek Majewski2,3§
1 Université de Montréal, Montreal, QC, Canada
2 Department of Human Genetics, McGill University, Montreal, QC, Canada
3 McGill University and Genome Quebec Innovation Center, Montreal, QC, Canada
4 Department of Biological Sciences, Virginia Tech, Blacksburg, Virginia, USA
*These authors contributed equally to this work
Abstract
BackgroundAlternative splicing and isoform level expression profiling is an emerging field of interest within genomics. Splicing sensitive microarrays, with probes targeted to individual exons or exon-junctions, are becoming increasingly popular as a tool capable of both expression profiling and finer scale isoform detection. Despite their intuitive appeal, relatively little is known about the performance of such tools, particularly in comparison with more traditional 3’ targeted microarrays. Here, we use the well studied Microarray Quality Control (MAQC) dataset to benchmark the Affymetrix Exon Array, and compare it to two other popular platforms: Illumina, and Affymetrix U133.
Results
We show that at the gene expression level, the Exon Array performs comparably with the two 3’ targeted platforms. However, the interplatform correlation of the results is slightly lower than between the two 3’ arrays. We show that some of the discrepancies stem from the RNA amplification protocols, e.g. the Exon Array is able to detect expression of non-polyadenylated transcripts. More importantly, we show that many other differences result from the ability of the Exon Array to monitor more detailed isoform-level changes; several examples illustrate that changes detected by the 3’ platforms are actually isoform variations, and that the nature of these variations can be resolved using Exon Array data. Finally, we show how the Exon Array can be used to detect alternative isoform differences, such as alternative splicing, transcript termination, and alternative promoter usage. We discuss the possible pitfalls and false positives resulting from isoform-level analysis.
Conclusions
The Exon Array is a valuable tool that can be used to profile gene expression while providing important additional information regarding the types of gene isoforms that are expressed and variable. However, analysis of alternative splicing requires much more hands on effort and visualization of results in order to correctly interpret the data, and generally results in considerably higher false positive rates than expression analysis. One of the main sources of error in the MAQC dataset is variation in amplification efficiency across transcripts, most likely caused by joint effects of elevated GC content in the 5’ ends of genes and reduced likelihood of random-primed first strand synthesis in the 3’ ends of genes. These effects are currently not adequately corrected using existing statistical methods. We outline approaches to reduce such errors by filtering out potentially problematic data.
Background
Alternative pre-mRNA splicing is a process that allows for the production of numerous protein variants from a single genomic locus. As researchers are becoming aware of the importance of splicing and mRNA processing in generating transcriptomic diversity, isoform-sensitive microarrays are rapidly gaining popularity in gene expression analysis [27, 28]. In particular, Affymetrix Exon Arrays are becoming a standard for both general and isoform-level expression analysis [25, 29-36]. Briefly, the Exon Array platform relies on 25-mer oligonucleotide probes to target the individual exons of a gene. The expression level of each exon can be detected independently, and summarized to monitor transcript expression levels as well as changes of individual transcript isoforms. The more universal coverage of the "Whole-Transcript" (WT) arrays renders them an attractive alternative to the traditional 3' biased expression microarrays.
We have previously successfully used Exon Arrays to demonstrate variation in isoform level expression in human populations [37] and associate this variation with underlying genetic differences [33]. We showed that the Exon Array is indeed a powerful and flexible tool, allowing for the detection of changes in splicing, transcript initiation, and termination. However, analysis of exon-level data is considerably more complicated than traditional analysis of gene expression. The complexity of the analysis may prevent many researchers from using WT arrays and profiting from associated advances in gene expression profiling.
Here, we use the example of a well studied system to outline the analysis and present results of a typical Exon Array experiment. We use the brain and reference human
mRNA samples previously studied by the MicroArray Quality Control (MAQC) consortium [38, 39]. These commercially available samples provide a high quality reference dataset for comparing microarray results across various platforms and laboratories. The human brain has very distinct gene expression signatures, and the comparison with the reference (combined) tissue pool results in detection of numerous genes with differential expression levels. The original MAQC study relied on these samples to demonstrate high concordance between various microarray platforms. Incidentally, the human brain is also rich in specific isoforms, and constitutes a highly suitable system for assessing the performance of the Exon Array as both an expression and isoform-sensitive platform.
Results
Variability across labs.
Five technical replicates of brain and reference were hybridized in two independent labs: McGill University (MU) and Virginia Tech (VT), for a total of 20 samples. Principal component analysis, which is a commonly used method to visualize sources of variability in the data, is shown in Figure 1.1. Our experience with Exon Arrays indicates that in general the ribosomal RNA reduction step is the most inconsistent part of the protocol and is likely to be a major contributor to the differences across labs.
Variability in hybridization intensities, background noise, and random errors across labs may contribute to differences in final conclusions resulting from microarray analyses. In the case of the MAQC data, the final goal was to quantify differences in gene expression levels between the human brain and reference tissues. A relevant metric of such expression difference is the fold change (FC), calculated as FC =
comparing the calculated fold changes in genes expression between the two labs. Despite the inter-lab variability in expression levels shown in the PCA plots, the final results (fold changes) are highly consistent for the two labs, with a correlation coefficient of greater than 0.97.
Figure 1.1: PCA plots at the probe set level show two main sources of variation among the 20 samples
PCA plots at the probe set level show two main sources of variation among the 20 samples. The first principal component explains 65% of the variance and corresponds, as expected, to the biological source of the sample: brain (B) vs. reference (R). The second principal component explains 20% of the variance and corresponds to the “lab effect” between VT (blue), and McGill (red) – that is, it illustrates the technical variability across labs.
Figure 1.2: Comparison of log2(FC) detected between the biological samples for the two labs Despite significant variation in expression measure across test sites, the fold change estimates are highly correlated.
Variability across summarization methods.
The aim of the summarization step in microarray analysis is generally to combine signals from multiple probes, which target the same expression unit, into a single expression index. Most of the popular methods strive for robustness against outlier probes (e.g. cross hybridizing, saturated, or non-responsive probes). We used our fold change results to compare two commonly used summarization methods: PLIER and RMA. We noted that RMA does result in a slight compression of fold changes, as has been observed in prior studies using other microarray platforms [38]. However, we find that the correlation of fold changes obtained from the two approaches is very high (r = 0.99).
Variability across platforms.
The original MAQC studies demonstrated that microarray results are highly consistent across different platforms [38]. Here, we compare the performance of the Exon Array in determining gene expression levels with two other popular platforms previously used by MAQC: Illumina Bead Array and Affymetrix U133 Gene Chip. In order to facilitate comparison across labs as well as platforms, we selected a number of genes which are reliably annotated and targeted by a common set of probesets (see Methods).
For the Exon Arrays, the fold changes were calculated by combining the results from the two labs (MU and VT). For the sake of consistency in the comparison, two test sites were chosen at random and combined for each platform within the MAQC dataset. We find that the 3’ targeted platforms, Illumina Human-6 BeadChip and Affymetrix U133, produce the most consistent results (R = 0.92). This is not surprising, since the probe selection regions for the two platforms largely coincide, and the amplification protocols are poly-A
primed and biased towards the 3’ ends of genes. The correlation with the Exon Array is slightly lower: R = 0.89 for U133 and 0.85 for Illumina. It has been previously shown [40-42], that the Exon Arrays are effective tools for gene expression profiling. Therefore, it is of interest, to examine the main sources of differences between the Exon Arrays and other platforms. Thus, in the analysis below we will concentrate on the genes whose predicted expression patterns are not consistent across platforms. In particular, the Exon Array is able to distinguish between specific isoforms of a given genomic locus, whereas the Illumina and Affymetrix U133 platforms generally target only a single isoform.
Alternative Isoform Detection.
It has previously been pointed out that some discordant results in the original MAQC [38] study were caused by differential isoform expression, and differences in probe placement across platforms. One particular discordant gene, ELAVL1, was suspected to express two alternative isoforms, differing in the 3’ UTR region. In Figure 1.3, we use the example of ELAVL1 to illustrate the advantages of using the Exon Array for profiling individual isoforms.
It is clear that although the Exon Array does not report the entire gene as differentially expressed (p > 0.02), individual probesets within the gene reach much higher statistical significance levels (p < 10-9). More interestingly, the gene appears to be composed of two “blocks”, with the first block on the 3’ end showing elevated expression in the brain, while the second block has elevated expression in the reference sample. In order to understand the more precise nature of this isoform change, it is advantageous to visualize this data in the context of known gene annotation, EST, and mRNA data. Generally, our lab
uses the custom track feature of the UCSC genome browser [43], in order to export our own information and combine it with publicly available data (Figure 1.4).
In Supplementary Figure 1, we present other examples of discordance between the platforms, further illustrating the value of additional information present on the Exon Array in profiling both “whole transcript” and “isoform-level” changes.
Figure 1.3: Exon array analysis of the ELAVL1 gene expression differences between brain and reference tissues
The horizontal scale corresponds to each probeset within the gene from the 3’ to 5’ ends. The height of the blue bars indicates the log2(fold change) in expression between the samples. The red line
Figure 1.4: Visualization of expression patterns of ELAVL1 gene
The top two custom tracks display the Exon Array information from Figure 1.3: statistical significance and fold change. Note that the two probeset “blocks” correspond to the two isoforms of the gene. The long 3’UTR isoform is predominantly expressed in the brain, whereas the short isoform is more abundant in the reference tissues.
Differences in Amplification and Labelling Protocols.
The four most discordant genes between the 3’ arrays and the WT array (see Figure 1.5) are histone genes: HIST1H3B, HIST1H1B, HIST1H3C, HIST1H3I, all of which are part of the histone gene cluster on chromosome 6p21.3. The Exon Array identifies those RNAs as over 50 fold less abundant in the brain than in the reference sample, while the 3’ targeted platforms register no expression differences and very low overall expression levels. It has been shown that most histone genes lack a poly-A tail [44] and that the stability of such non-adenylated transcripts varies greatly with intracellular conditions such as those present in brain tissues [45]. Both Illumina and the Affymetrix U133 arrays use 3’, poly-T primed RNA amplification protocols and do not detect histone gene expression. In contrast, the Exon Array uses WT random primed amplification, which does not necessitate the presence of a poly-A tail. The difference of histone RNA abundance is the most striking example of a result that is specifically detected by the Exon Array, but not the other platforms. However, there are many other such differences within the dataset (see Supplementary Figure 1).
Figure 1.5: Correlation of fold changes between Affymetrix U133, Illumina, and the Affymetrix Exon Array
Fold changes (log2 transformed) between brain and reference expression levels for 8391 genes
common to all three platforms. The arrow points to the highly discordant detection of 4 histone genes: HIST1H3B, HIST1H1B, HIST1H3C, HIST1H3I.
Using the Exon Array to Profile Alternative Isoforms.
One of the biggest challenges in profiling alternative isoforms using Exon Arrays is the deconvolution of mRNA processing and transcription. A simple comparison of probeset intensities across samples is not sufficient; if an exon belongs to a transcript that is differentially expressed, the examination of a single exon out of its genomic context will lead to an incorrect conclusion. A very simple and intuitive solution to this problem is the use of the Splicing Index (SI), which is calculated by dividing the probe set intensity by the metaprobeset intensity (i.e. exon expression/gene expression), after the addition of a stabilization constant to both the probeset and meta-probeset scores [6]. This simple procedure normalizes the expression level of each exon and accounts for any possible gene expression differences between samples. However, we find that the splicing index has some undesirable statistical properties (arising from large errors in the estimates in both the numerator and the denominator) as well as being prone to methodological artefacts (see below), and should be used with caution. Thus, we have also used a simpler, but more labour intensive method, of carrying out the entire analysis at the probeset level, and relying on visualization and manual curation (description of the workflow in chapter 2 – materials and methods – data pre-processing and analysis – Filtering signal data) of the results in order to distinguish splicing and expression differences between samples. While more robust statistical approaches are being developed, we strongly advocate visualization of results in the context of genome annotation and EST evidence in order to filter out false positive signals. We have relied on custom scripts and modifications of the UCSC and ENSEMBL genome browsers, but increasingly useful and user-friendly commercial packages for the Exon Arrays are available (e.g. Partek Genomics Suite, Biotique XRay) along with academic BioConductor packages [46-48]. Below, we describe in more detail two
approaches to alternative isoform detection. For the case of simplicity, only the core (most confident) subset of Exon Array probesets was considered in this analysis.
Probe set level analysis. At this level of the analysis, each probeset (roughly corresponding
to an exon) is used as a unit of expression, instead of a meta probeset (a transcript) as is done in more traditional gene expression analysis. With appropriate statistical significance cut-offs (e.g. a Benjamini-Hochberg [49] False Discovery Rate correction), it is generally possible to select a highly confident set of probesets exhibiting significantly altered expression. However, it is not immediately possible to classify the “hits” as results of alternative isoform expression (e.g. alternative splicing), differential gene expression, or both. The easiest way of factoring out of gene expression is to consider only the genes whose expression does not change across samples or treatments. That is, we can select probesets that are statistically significant, but which belong to genes whose meta-probe set expression does not appear to be significantly altered (nominal p > 0.05). For the MAQC samples, we generated a list of the top 100 such genes. The list and links to the UCSC browser are provided in the Supplemental File 2. The top candidates show evidence for differential promoter usage, polyadenylation, and alternative splicing. A few examples appear to be annotation errors, where the Affymetrix annotation combines two distinct genes into a single transcript cluster. In general, we advocate RT-PCR based validation of alternative isoforms. However, cross validation with existing information is also extremely useful. Extensive EST and mRNA based information on tissue specific splicing is available from many sources, e.g. from the ASAPII [50] or Hollywood [51]. Most of the source data can be viewed directly in the UCSC genome browser by displaying the mRNA, spliced EST, or
Splicing Index (SI) analysis. SI is calculated by dividing the probe set intensity by the
metaprobeset intensity. This simple procedure normalizes the expression level of each exon and should account for any possible gene expression differences between samples. An example of a successful use of SI analysis is illustrated in Figure 1.6A. Intuitively, the splicing index may be viewed as an approximate fractional inclusion level of a probeset within a transcript. However, we find many statistical and methodological problems arising from the use of the SI metric. Specifically, comparing SI values across samples makes the assumption that all probesets within a gene have comparable response (linear or log-linear) to changes in RNA levels. This assumption is generally violated, and hence SI comparisons result in high false positive rates. The most severe non-linearities in response are exhibited by probesets that are expressed close to the background levels, and probesets within highly expressed genes whose detection range is saturated. One of the most common methodological artefacts is illustrated in Figure 1.6B; probesets that are close to the 3’ ends of genes are not amplified as efficiently as interior probesets while probesets close to the 5’ end have elevated GC content and reduced specificity (see below). In addition, probesets that belong to skipped exons, which are included at low levels in both samples – i.e. these are actually alternatively spliced exons, but are NOT differentially spliced across samples. It should be noted that such artefacts are not limited to the use of the splicing index, and also applied to other commonly employed methods that attempt to correct for expression differences, such as the two-way ANOVA method implemented by Partek and Biotique XRay software. Some of the arising problems may be avoided by various filtering approaches; e.g. removing probesets with extremely high or low SI values, or probesets with extremely low coefficients of variation (possibly saturated). A more detailed discussion of these effects is presented at the Affymetrix website [6] and methods are being developed to enable these filtering
criteria in an automated fashion [52]. Such approaches are likely to reduce false positive rates, at a cost of a reduced coverage of the genome. In Supplemental File 3 we present the top 100 candidates resulting from the SI analysis of the MAQC data, after filtering out all probesets expressed below background (average detection above background [DABG] p-value > 0.05).
Figure 1.6: Examples of Candidates from Splicing Index Analysis
Top panels show the p-values (dotted line) and fold-changes (blue bars) for the expression of individual probesets. The centre panels show the values normalized for overall difference in gene expression (SI). Bottom panels show the raw hybridization levels of each probeset. A) MADD - successful use of the splicing index. In this example, in the presence of an overall 3-fold gene expression difference between the samples, the SI factors out the expression difference and indicates three alternatively spliced probesets – 3329761, 3329771, and 33291783 – all of which have strong supporting RefSeq annotation evidence for alternative splicing. B) TYMS - a typical false positive, where differences in probe response levels close to the edges of the transcript suggest alternative isoform usage. Such results are often erroneous, resulting from non-uniform response of individual probesets to large (in this case ~ 20 fold) changes in gene expression. Note the elevated signal intensity (bottom panel) at the 5’ end of the gene, suggesting saturation, and a reduced intensity at the 3’ terminus, possibly to reduced amplification efficiency.
Edge Bias Effect.
In the course of the splicing index analysis described above, we noted an excess of “hits” occurring in the 3’ and 5’ regions of transcripts. We hypothesized that this effect could arise partly due to a bias during the first strand synthesis in the random primed amplification step used in Exon Array processing. Briefly, first strand synthesis proceeds from the 3’ end to the 5’ end of each transcript, initiating at random points along the mRNA molecule. Each probeset in the interior of the mRNA is likely to be represented by multiple randomly primed initiation events. However, probesets towards the 3’ end of the mRNA have a lower chance of coverage – simply because the molecule ends and priming cannot occur at any point downstream of the 3’ end. In order to test this hypothesis and quantify
distance from the 3’ and 5’ edge of the targeted mRNA molecule. The results are shown in Figure 1.7. It is evident that the intensity of the signal increases depending on the distance from the polyA site. No such effect is seen for the distance from transcription start site (5’). This effect is further illustrated in Figure 1.8, which shows that Exon Array gene expression levels are highly correlated with gene length, i.e. short genes appear to be expressed at lower levels than long genes, which is most likely caused by relatively lower efficiency in amplifying short mRNA molecules.
We also noted that the ability of the Exon Array to detect hybridization above background noise levels is not uniform across transcripts. The Exon Array allows the calculation of DABG p-values, which signify the probability that signal originates from the background noise distribution, rather than true gene expression. In general, probesets with DABG values lower than 0.05 can be accepted to represent true signal. Average DABG values are least significant at both 3’ and 5’ ends of the gene. The reduction at the 3’ end results from the reduced signal intensity levels described above. The reduction at the 5’ end is more puzzling, in the absence of a corresponding reduction in signal. We hypothesize that the 5’ effect is most likely the result of an elevated GC content of probes located close to promoter regions which are generally unmethylated, GC-rich and enriched in CpG islands [53, 54]. In fact the DABG trend at the 5’ end inversely mirrors the GC content of the probesets (data not shown).
Figure 1.7: Edge bias
This figure illustrates variation of hybridization intensity across transcripts. For each probeset expressed above background levels, we determined the average hybridization intensity as a function of distance from the 5’ and 3’ ends of the mRNA molecule. Top panels show the average signal intensity as a function of probeset distance from the 5’ and 3’ ends of transcripts. A significant decrease in signal strength is seen at the 3’ end, while a slight increase occurs at the 5’ end. Bottom panels illustrate the ability of the array to detect the hybridization signal above background levels. Mean DABG values decrease at both 5’ and 3’ extremities of genes. The 3’ effect results directly from
of the 5’ probes located close to unmethylated gene promoters and CpG islands. Both effects cause false positive results in Splicing Index and Splicing ANOVA analyses in the presence of changes in expression of the whole transcript. Only genes with detectable expression (average DABG p-value < 0.05) and total mRNA length greater than 1000 nucleotides were included in this analysis. The values were calculated as log-averages of core probeset intensity across all samples. Each point on the plot corresponds to all probeset ending within a bin of length 10 bp, at the indicated distance from mRNA termini.
In effect, probesets that are close to the ends of a gene are likely to exhibit response properties different from the rest of the transcript, and hence produce excess false positive results. Such artefacts are difficult to correct using filtering methods, because the terminal probesets in question are usually detected as expressed above background, but do not respond to expression changes as well as those in the remainder of the gene. In the future, it may be possible to correct for the edge bias by improving the amplification protocol, or computational adjustments. However, at this point interesting Exon Array results in the 3’ and 5’ ends of genes, particularly those obtained from SI or two-way ANOVA analyses, should be treated with extra caution.
Figure 1.8: Exon Array average gene expression index as a function of transcript (mRNA) length There is a highly significant positive correlation of expression and length (R = 0.18, p < 10-20). This effect is most likely an artefact of the edge bias illustrated in Figure 1.7; short transcripts have a lower overall efficiency of first strand synthesis and appear to be expressed at lower levels. The effect is not observed in the 3’ amplified U133 (R = 0.05) and Illumina (R = -0.03) results.
Discussion
The recognition of alternative splicing and alternative isoform expression as an important component in gene expression analysis has prompted the introduction of isoform sensitive microarray platforms. By targeting individual exons, exon junctions, and annotated isoform variants, such platforms possess the ability to profile not only the expression levels of the entire transcript, but also variations in the types of expressed isoforms. The Affymetrix Exon Array 1.0 ST is one of such commercially available platforms. To date, it has been shown that the Exon Array produces gene expression measurements that are comparable with the previous generation 3’ targeted arrays. However, little is known about the in-depth level of similarities and particularly differences among WT and 3’ based technologies.
This comparison utilizes the well studied brain and reference samples previously used in the MAQC study to determine sources of variability in profiling gene expression using microarrays. These samples are particularly valuable for the purposes of benchmarking the performance of the Exon Array for two reasons: 1) they allow easy comparison of gene expression level measurements with other platforms that have already been tested, and 2) they allow detection of alternative splicing and isoform difference, since neural tissues are known to be particularly prone to alternative splicing.
Our first conclusions concern the utility of the Exon Array as an expression profiling tool. We note that although the Exon Array results are very consistent with 3’ profiling methods, the level of agreement between the Exon Array and 3’ targeted platforms (Illumina and Affymetrix U133) is slightly lower than the agreement between the 3’ platforms. There are at least two reasons for the decreased concordance.
Firstly, the Exon Array uses a whole transcript, randomly primed amplification protocol, while the two other platforms rely on polyA tail priming. As a result, the two approaches amplify a slightly different RNA pool. This is illustrated very well by the example of several histone genes (known to lack a polyA tail), which the Exon Array indicates are expressed at a much lower level in the brain than in the reference, while the other two platforms indicate a uniform very low level of expression of histone transcripts. As far as we know, differences in expression of histone genes across tissues and treatments have not previously been detected by microarray analysis, and this result is only detectable using the WT approach.
Secondly, many of the outliers in the correlation plot (Figure 1.5) are due to the presence of real variations in the expression of specific isoforms. This is illustrated using a previously noted example of the ELAVL1 gene, which showed discordance across platforms in the original MAQC study, as well as in additional new examples (Supplementary Figure 1). The detected expression differences of transcript variants may have important biological significance. For example the longer 3’ UTR in the dominant ELAVL1 transcript in brain has a different set of putative micro RNA binding sites than the shorter 3’ UTR in the reference RNA.
It should also be noted that discordant results will often be obtained because of differences in the annotation provided by microarray manufacturers. We circumvented most of such problems here by re-mapping the probes and selecting only a subset of genes that we were confident were correctly targeted by all three platforms, but researchers should keep in mind that the annotations and gene assignments provided by manufacturers
common annotation error resulted from joining together distinct transcripts into single meta-probesets, particularly in the case of transcripts that partially overlap. Thus, we recommend that lists of candidates from individual experiments should be carefully curated.
We also outline how the Exon Array can be used to detect alternative splicing and alternative mRNA processing events. Although are analysis methods are not in themselves novel, and most of them have been briefly described elsewhere [6, 37], our goal is to convey to the potential users their intuitive appeal and potential pitfalls. The most challenging step remains the decoupling of whole transcript expression, and individual probeset inclusion. The simplest solution to this problem is to consider only the genes that do not change overall expression levels, but contain probesets that exhibit individual variations. Although this approach produces a highly confident set of alternative events, it can result in a huge reduction of the dataset, particularly in case of comparisons across samples with highly heterogeneous gene expression levels. In the case of MAQC dataset, which has been chosen for the exact reason of it’s extreme gene expression variability, imposing the restriction of expression fold change of less than 2 reduces the total number of genes considered by 31% (from 17665 to 12198).
A more inclusive approach is to attempt to correct for gene expression differences that may occur concurrently to splicing differences. We discuss two such approaches: 1) the splicing index, which compares probeset inclusion across samples after normalizing by gene expression levels, and 2) two-way ANOVA, where the interaction term between sample type and probeset can be used to indicate differential inclusion of probesets within transcripts. Both approaches suffer from similar systematic biases; they assume a uniform (linear or log-linear) response of each probeset within a meta-probeset. This assumption is violated in
many cases, particularly for probesets that hybridize at very high levels (saturated response) or probesets with hybridization levels close to background (poorly or non-responsive). As a result, in the presence of significant gene expression changes, such analyses predominantly indicate three types of events: dead probesets, saturated probesets, and probesets that may be predominantly skipped (alternative), but not necessarily differentially included across samples. All three types of results constitute false positives, and contribute to the high false positive rates of such analyses.
We also point out two major systematic errors. First, we show that hybridization intensity decreases for probesets close to the 3’ mRNA ends, an effect that we believe stems from the random amplification protocol used by the Exon Array. We argue that this is not an annotation artefact, but most likely results from the end of template and reduced random priming potential in the first strand synthesis step amplification. As a result, 3’ regions of genes are detected at near background levels, and frequently indicate alternative isoform presence using the SI or ANOVA approaches. A similar problem exists at the 5’ end of transcripts, where we hypothesize that the reduction in DABG levels is caused by the elevated GC content of the probesets. These problems are particularly troubling, since many cases of alternative polyadenylation and promoter usage may in fact be associated with changes in transcript expression. This may be due to different promoter strength, or microRNA mediated regulation in 3’ UTR (as is likely to be the case in the ELAVL1 example shown in Figures 1.3 and 1.4). Such real and potentially extremely interesting cases may be difficult to distinguish from differences in probe hybridization potential.
probeset with low inclusion levels (close to background), and genes with extremely high differences in expression levels across samples. However, such filtering decreases the false positive rates at the cost of reduced genomic coverage.
In our earlier studies, we have also pointed out that in many experimental designs, particularly when samples originate from different genetic backgrounds (e.g. different individuals), the presence of sequence variants within probe target sequences may be a very significant source of errors [33, 37]. This effect can be especially prominent in eQTL association studies, where we have shown that it can be responsible for a false positive rate > 80% in alternative splicing analysis [56]. Thus, unless all tested samples are isogenic, we highly recommend additionally “masking” all probes containing known polymorphisms before performing the analysis.
Conclusions
In summary, the WT profiling provides a wealth of valuable information, which is either not available or misrepresented in traditional 3’ gene expression arrays. However, it should be noted that the isoform-level analysis of Exon Arrays is significantly more complicated, suffers from higher false positive rates, and requires more manual intervention than traditional gene expression analysis. We strongly advocate visualization of candidate isoform changes in the context of available genome annotation as a means to both reduce false positive rates and interpret the nature of detected variants.
Methods
Exon Array Hybridization
The Universal Human Reference RNA (catalogue no. 740000) and Human Brain Reference RNA (catalogue no. 6050) were obtained from Stratagene and Ambion, respectively. The RNA quality was assessed using RNA 6000 NanoChips with the Agilent 2100 Bioanalyzer (Agilent, Palo Alto, USA). Five technical replicates of each sample were hybridized independently at two test sites: McGill University and Genome Quebec Innovation Centre (Montreal, Quebec, Canada) and Virginia Tech (Blacksburg, Virginia, USA). Biotin-labelled target for the microarray experiment were prepared using 1µg of total RNA. The RNA was subjected to an rRNA removal procedure with the RiboMinus Human/Mouse Transcriptome Isolation Kit (Invitrogen) and cDNA was synthesized using the GeneChip® WT (Whole Transcript) Sense Target Labelling and Control Reagents kit as described by the manufacturer (Affymetrix). The sense cDNA was then fragmented by UDG (uracil DNA glycosylase) and APE 1 (apurinic/apyrimidic endonuclease 1) and biotin-labelled with TdT (terminal deoxynucleotidyl transferase) using the GeneChip® WT Terminal labelling kit (Affymetrix, Santa Clara, USA). Hybridization was performed using 5 micrograms of biotinylated target, which was incubated with the GeneChip® Human Exon 1.0 ST array (Affymetrix) at 45˚C for 16-20 hours. Following hybridization, non-specifically bound material was removed by washing and detection of specifically bound target was performed using the GeneChip® Hybridization, Wash and Stain kit, and the GeneChip® Fluidics Station 450 (Affymetrix). The arrays were scanned using the GeneChip® Scanner 3000 7G (Affymetrix) and raw data was extracted from the scanned images and analyzed with the Affymetrix Power Tools software package (Affymetrix). The microarray data has been
Data Pre-processing and Analysis
The Affymetrix Power Tools software package (Affymetrix) was used to quantile normalize the probe fluorescence intensities and to summarize the probe set (representing exon expression) and meta-probe set (representing gene expression) intensities using a probe logarithmic intensity error model (PLIER, [57]) or robust multichip analysis (RMA, [58]). The above procedures were carried out separately for the two test sites (McGill University and Virginia Tech). The raw data (.cel files) was downloaded from the MAQC website for the Illumina and U133 arrays. In order to keep the number of replicates and test sites consistent across platforms, we only used two of the MAQC test sites (a total of 10 technical replicates of each sample). For the probeset-level analysis and alternative isoform detection, we only used the most confident subset of core probesets from the Exon Array.
Probeset and Gene Mapping
To determine a subset of genes common to the three platforms, we used the mapping provided by the MAQC study [39] to select 12091 probesets common Illumina and Affymetrix U133 arrays. Subsequently, we used the Exon Array probeset annotation and retained only the genes where the Exon Array meta-probeset coordinates contained both the Illumina and U133 probesets. This procedure resulted in 8391 genes with a high confidence concordant mapping across the three platforms.
Authors' contributions
A.B. and D.B. performed the statistical and computational analysis, and prepared the figures. T.K and D.G. carried out parts of the alternative splicing analysis. R.J. and J.M.
conceived of the study and supervised the hybridization of the microarrays. J.M. wrote the manuscript.
Acknowledgements
This work was supported by grants from CIHR and Genome Canada/Genome Quebec (to J.M.). J.M. is a Canada Research Chair recipient. D.G. is supported by a FRSQ post-doctoral fellowship. We would like to thank the staff of the Genome Quebec Microarray Platform as well as Clive Evans and the technical staff of the Core Laboratory Facility at the Virginia Bioinformatics Institute for expert help and microarray processing."