%411t’ 33/L(,
/ nUniversité de Montréal
The effect of a VAChT-saporin immunotoxin on retinal cholinergic amacrine celis during post-natal development in rats
par
Manishha Patel
Sciences de la Vision École d’Optométrie
Mémoire présenté à la Faculté des études supérieures en vue de l’obtention du grade de
Maître es sciences (M.Sc.) en Sciences de la Vision
option: Sciences fondamentales et appliquées
Mai 2005 /Gtadeconfére°\
2005 AOUi 4 © Manishha Patel, 2005
(N
n
Université
(II
de Montréal
Direction des bibliothèques
AVIS
L’auteur a autorisé l’Université de Montréal à reproduite et diffuser, en totalité ou en partie, par quelque moyen que ce soit et suc quelque support que ce
soit, et exclusivement à des fins non lucratives d’enseignement et de
recherche, des copies de ce mémoire ou de cette thèse.
L’auteur et les coauteurs le cas échéant conservent la propriété du droit
d’auteur et des droits moraux qui protègent ce document. Ni la thèse ou le mémoire, ni des extraits substantiels de ce document, ne doivent être
imprimés ou autrement reproduits sans l’autorisation de l’auteur.
Afin de se conformer à la Loi canadienne sur la protection des renseignements personnels, quelques formulaires secondaires, coordonnées
ou signatures intégrées au texte ont pu être enlevés de ce document. Bien
que cela ait pu affecter la pagination, il n’y a aucun contenu manquant.
NOTICE
The author of this thesis or dissertation has granted a nonexclusive license allowing Université de Montréal to teproduce and publish the document, in
part or in whole, and in any format, solely for noncommercial educational and research purposes.
The author and co-authors if applicable retain copyright ownership and moral
rights in this document. Neither the whole thesis or dissertation, flot
substantial extracts from it, may be printed or otherwise reproduced without the author’s permission.
In compliance with the Canadian Privacy Act some supporting forms, contact information or signatures may have been removed from the document. While this may affect the document page count, it does flot represent any Ioss of
111
Université de Montréal Faculté des études supérieures
Cet mémoire intitulé:
The effect of a VAChT-saporin immunotoxin on retinal cholinergic amacrine cells during post-natal development in rats
Présenté par: Manishha Patel
a été évalué par un jury composé des personnes suivantes:
Dr. Jean-François Bouchard, PhD président-rapporteur Dr. Christian Casanova, PhD directeur de recherche Dr. Maurice Ptito ,PhD membre du jury
iv fRENCH SUMMARY
Pour mon projet de maîtrise, j’ai étudié le rôle de l’acétylcholine rétinienne dans le développement du système visuel. Les cellules amacrines ‘starburst’ (AS) sont les seules cellules cholinergiques présentes dans la rétine et il a été démontré qu’elles étaient cruciales pour l’établissement de la sélectivité à la direction dans la rétine du lapin (Vaney et al, 1989). Chez le rat, néanmoins, le rôle de ces cellules dans l’établissement de la sélectivité à la direction n’a pas été clairement démontré.
Pour déterminer l’influence des cellules AS sur la sélectivité à la direction des neurones, nous avons injecté une immunotoxine (anti-VAChT:saporine) dans le vitré de rats nouveau-nés. Cette dernière est spécifiquement dirigée contre le transporteur vésiculaire de l’acétylcholine et devrait donc éliminer toutes les cellules cholinergiques amacrines de la rétine. Lorsque les rats attaiguent l’âge adulte, nous avons fait des enregistrements électrophysiologiques dans le colliculus supérieur (CS). Suite aux enregistrements, l’analyse immunohistochimique a démontré que seule la moitié des neurones cholinergiques était détruite. Nos résultats électrophysiologiques préliminaires suggéraient qu’il n’y avait pas de différence majeure dans les propriétés des champs récepteurs du CS, ce qui pourrait être dû à élimination partielle des cellules AS.
Nous sommes donc intéressés au développement des cellules AS, dans le but de déterminer à quel moment l’injection de notre toxine causerait une élimination complète de ces cellules. Nos injections, faites dans des rats d’âges différents (P0 à P60), ne permettent pas de conclure dû à l’inefficacité de la toxine immunologique.
V
acétylcholine
cellule amacrine ‘starburst’ collicule supérieur développement immunotoxine rats rétine FRENCH KEYWORDS
vi ENGLISH SUMMARY
This project investigates the role of retinai acetylcholine in neuronal
deveiopment of the visual system. Starburst amacrine (SA) ceils are the oniy cholinergic celis present in the retina and have been deemed crucial for direction selectivity in the rabbit retina (Vaney et aÏ, 1989). In the rat, however, it is stili unclear if SA celis are necessary for direction selectivity.
In order to determine the influence of SA neurons on direction seiectivity, intravitreal injections of an immunotoxin (anti-VAChT saporin) were carried out on rat pups. This toxin is specific for the vesicular acetyichoiine transporter, and therefore shouM have eiiminated ail retinai cholinergic amacrine ceils (Gunhan et ai, 2002). When rats reached aduithood, electrophysiologicai recordings were done in the superior coiiicuius (SC). Foiiowing the recordings, immunohistochemistry was performed on the retinae of these animais. Jnterestingiy, these retinae showed that oniy about 50% of choiinergic neurons were eiiminated and preliminary resuits suggest that there was no major difference between normai and toxin-treated animaIs in terms of receptive fieid properties of the SC. This resuit could be attributed the partial eiimination of SA celis.
Aiming to obtain the fuii eiimination of SA ceils, we then focused on determining the deveioprnentai course of SA celis, and when intravitreal injections of the immunotoxin would aiiow for complete elimination of SA ceils from the retina. from the resuits of injections performed on rats of various age groups (P0 to P60), no
conclusions couid be made definiteiy from this part of the study since the imumnotoxin was ineffective in eliminating any choiinergic fleurons.
vii acetylcholine development immunotoxin rats retina
starburst amacrine ccli superior coliiculus
viii
TABLE 0F CONTENTS
Jury identification page iii
French summary iv
French keywords V
English summary vi
English keywords vii
Table of contents viii
List of tables xii
Liste of figures xiii
List of abbreviations xv
1. INTRODUCTION 1
1.1 The visual system 2
1.2 The retina 2
1.2.1 Structural organization 2
1.2.2 Developmental course ofthe retina 5
1.2.3 Functional organization 6
1.2.3.1 Neurotransmitters and neuromodulators 7
1.3 Amacrine ceils 8
1.3.1 Starburst amacrine celis 8
1.3.1.1 Characteristic properties of SA celis 9 1.3.2 Acetylcholine release by SA ceils 9 1.3.3 Implications in visual direction selectivity 11
ix
1.4 Superior Colliculus 17
1.4.1 Anatomical organization 17
1.4.2 Functional organization 19
1.4.3 Afferences ofthe SC 20
1.4.4 The role ofthe SC in vision 21
1.4.5 Direction selectivity in the SC 22
1.5 The objective ofthis study 24
2. MATERIAL AND METHODS 25
2.1 Experimental model 26
2.2 Preparation of animal for intravitreal injection 26
2.3 Testing of anaesthesia protocols 33
2.4 Preparation of animal for electrophysiological recordings 35
2.5 Single-unit extracellular recordings 36
2.6 Visual stimulation 36
2.7 Receptive field properties studied 37
2.7.1 Direction selectivity 38
2.7.2 Spatial frequency 39
2.7.3 Temporal frequency 39
2.7.4 Velocity 40
2.7.5 Contrast sensitivity 40
2.8 Verification ofneuroanatomical sites ofrecordings in the SC 41
X
3. RESULTS . 44
3.1 Introductory remarks 45
3.2 Teclmical improvements in material and methods 46
3.2.1 Anaesthesia 46
3.2.2 Intravitreal injections 47
3.3 Effect of VAChT-saporin immunotoxin using the new injection protocol ... 47
3.4 Jnipact ofretinal cholinergic on activity ofthe SC 50 3.4.1 Physiological properties of visual SC neurons in normal rats 50
3.4.1.1 Direction selectivity 50
3.4.1.2 Spatial frequency 51
3.4.1.3 Temporal frequency 56
3.4.1.4 Contrast sensitivity 56
3.4.1.5 Cholinergic celis in the retinae of normal rats 61
3.4.2 Physiological properties ofvisual SC neurons in immunotoxin-treated
rats 61
3.4.2.1 Direction selectivity 63
3.4.2.2 Spatial ftequency 63
3.4.2.3 Temporal frequency 66
3.4.2.4 Contrast sensitivity 70
3.4.2.5 Cholinergic celis in immunotoxin-treated retinae 70
3.5 HistologyofSC lesions 74
3.6 General observations on integrity ofinjected eyes 75 3.7 Development of cholinergic neurons at various ages 75
xi
4. DISCUSSION 80
4.1 Methodological considerations 81
4.1.2 Intravitreal injections 81
4.1.2 Anaesthesia $2
4.2 Justification ofthe animal model used 82
4.3 General observations 83
4.4 Rationale for the use of anti-VAChT:saporin immunotoxin 85 4.5 Short-term development of SA celis after immunotoxin treatment
atPl 85
4.6 Properties of SC neurons $7
4.6.1 Direction selectivity 87
4.6.2 Spatio-temporal properties 8$
4.6.3 Contrast sensitivity $9
4.7 Developmental course of SA celis 90
4.7.1 Short-term verus Iong-term effects ofthe immunotoxin 90 4.7.2 Development of SA ceils at various stages of postnatal
development 92
4.8 Conclusions 92
4.9 Critics and prospectives 93
5. REFERENCES 95
6. APPENDIX I 104
xii LIST 0F TABLES
Table I: Group ofsubjects that were submitted to intravitreal injections using
the ‘old’ protocol 27
Table II: Group of subjects that were submitted to intravitreal injections using
the ‘new’ protocol 29
xiii
LIST 0F FIGURES
Figure 1: Illustration showing the cellular organization of a vertebrate retina 3 Figure 2: Image ofa starburst amacrine ceil from a rabbit retina labeled with
Lucifer yeflow 10
Figure 3: Illustration depicting a cholinergic neuron 13
figure 4: Selective SA celi outputs to direction-selective GCs with different
preferred directions yellow 16
Figure 5: Location and laminar organization ofthe rat superior colliculus 18 Figure 6: Schematic representation of an intravitreai injection in the rat eye 34 Figure 7: Cholinergic amacrine celis in the developed rat retina 49 figure 8: Distribution of DIs and bandwidths for normal animais 52 Figure 9: Exampie ofa direction and orientation selective neuron from
A normal subject 53
Figure 10: Response ofSC ceils to the spatial frequency ofdrifting
gratings from normal rats 55
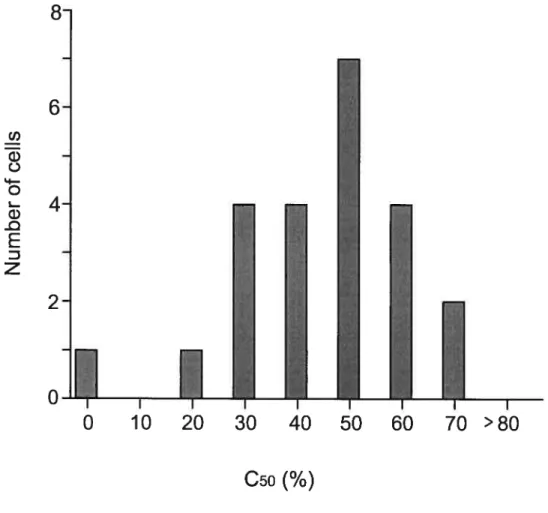
figure 11: Temporal frequency tuning and distribution of optimal TFs 58 Figure 12: Response ofa ccii as a function of stimulus contrast 60 Figure 13: Distribution of C50 values from normal animaIs 62 Figure 14: Representative example of an ‘orientation’ selective ccli from
a treated subject 64
Figure 15: Distribution of DIs and bandwidths ofthe two groups 65 Figure 16: Response of SC celis to the spatial frequency of drifting
xiv
Figure 17: Temporal frequency tuning and distribution of optimal Ifs
for treated animais 69
Figure 18: Distribution of C50 values from treated animais 71 Figure 19: Photomicrographs showing retinal sections ofa Pi injected rat
processed for ChAT immunohistochemistry at P60 73 Figure 20: ChAT-immunolabeling of developing cholinergic amacrine celis
xv
LIST 0F ABBREVIATIONS
ACÏi acetylcholine AchE acetylcholinesterase
E embryonic day
ChAT choline acetylesterase
GARA y-aminobutyric acid GC ganglion celi
GCL ganglion celi layer INL inner nuclear layer IPL muerplexifonu layer NM neuromodulator NT neurotransmitter ONL outer nuclear layer OFL outer plexiform layer P postnatal day
SA starburst amacrine SC superior colliculus
7
1.1
The visuat system
Vision is the most fundamental of our senses. It allows us to recognize visual cues from the world and respond appropriately. Although ail parts of the eye are important for perceiving a good image, the most vital element for vision is the retina. The retina is essentiafly a piece of brain tissue that gets direct stimulation from the lights and images of the world. It translates the light into newe signals and extracts useful information and ignores redundancies.
1.2
Theretina
1.2.] Structural organization and its development
The vertebrate retina is a laminated structure and is organized into five layers: two synaptic layers — inner and outer piexiform layers
— which are
interposed between three cellular layers — inner and outer nuclear layers and
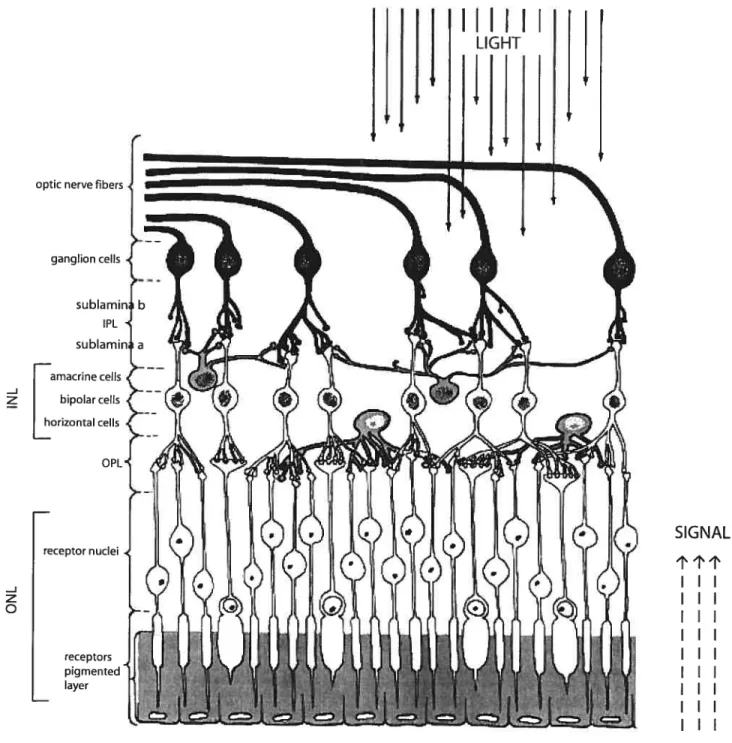
ganglion cell layer. In the temporal arrangement of the retina (figure 1), the photoreceptors cell bodies are first in line and they are iocated in the outer nuciear layer. The inner nuclear layer contains the perikarya of horizontal cells
at its outer margin; the majority ofbipolar cell perikarya are found in the middle ofthe layer; and most amacrine cell perikarya are found along the proximal
SIGNAL I II I II I I I I II I I I I I I I I I I II I I I
optk nerve fibers
ganglion ceils -J z -J z o receptor nuclei
Figure 1: Illustration showing the cellular organization of a vertebrate retina. Ihe solid une black arrows show the direction in which light enters the eye. The dotted-line arrows indicate the direction in which information is conveyed once the light ‘hits’ the photoreceptors. TNL: inner nuclear layer; IPL: inner plexiform layer; ONL: outer nuclear layer; OPL: outer plexiform layer.From: (Palmer, 1999).
4
border. The Muller celis are found throughout the retina, from the outer nuclear layer (ONL) to the inner margin of the retina. The outer plexiform layer (OPL) and inner plexiform layer (IPL) are areas where synapses are made between different cdl types. The IPL is further divided into two regions — sublamina a, which is doser to the INL, and sublamina b, which is doser to the ganglion ceÏl layer (GCL).
There are, however, exceptions to the aforementioned arrangement of the retina. Horizontal and bipolar cells may be found in the ONL, ganglion cells in the limer nuclear layer (INL), and amacrine cells in the GCL. These cells are named displaced cells. Displaced amacrine cells are a common feature ofmany retinae (Masland & Miils, 1979; Vaney, Peichi, & Boycott, 1981).
The retina is part of the central nervous system (CNS) and originates from the neural ectoderm during development. Groups of pro genitors leave the celi cycle throughout retinal development to differentiate into one of seven cell classes (Carter-Dawson & LaVail, 1979; Sidman, 1961; Young, 1985b; Young, 1 985a). Although there is considerable overlap between the generation periods of most ceil classes, each retinal cdl type is generated at a certain time point. Ganglion cells are the first neurons to be bom, followed by amacrine, horizontal, cone photoreceptor cells, bipolar, and finally, Muller glial cells. Generation of rod photoreceptor cells can be seen almost throughout cytogenesis (Carter-Dawson et al., 1979; Sidman, 1961; Young, 19$5b; Young, 198 5a).
5
1.2.2 Deveïopmental course of the rat retina
The retjna is a derivative of the fleurai tube. The two optic vesicies deveiop very eariy in embryonic iife and then invaginate to form the optic cups (Dowiing, 1 987b; Gnin, 1982). It is the neurai epithelium on the inner waii of the optic cups that eventually becomes the retina. Imtially, both waÏis of the optic cup are one ceil thick. These celis then divide to form a neuroepitheiial layer many ceils thick which then differentiate into ail the retinal celis (Dowiing, 19875).
In the rat, mitoses occur in the scierai zone of the retina at the centrai and peripherai regions between embryonic day 9 (E9) and postnatai day (P13) (Rapaport, 2004), with the peripherat retina lagging behind the center by, on average, 1.9 days ± 11 hours. There is a deciine in mitotic activity beginning approximateiy at P6, when ninety-five percent of ail retinai ceiis have been generated. Ceil genesis siows sharply for the production of the finai five percent of ceiis (Rapaport, 2004).
Ganglion ceiis (GC5) are the first retinai ceiis to be bom; iabeiing has been seen as early as E9 (Rapaport, 2004); ninety-five percent of these ceils are present by E19. These are cioseiy foiiowed by horizontal and cone photoreceptor celis; first detected between E9 and F10 and ninety-five percent detected at E 15/16 and El 8, respectively. Next in une are the amacrine celis, which appear at E12 and are aimost fuliy expressed by P7 (Rapaport, 2004). Rod photoreceptor genesis, starting at E18 and ending at approximateiy P13,
6
precedes a final cohort consisting ofMuller and bipolar celis, which ariseat E21 and are detected till P13 (Rapaport, 2004).
1.2.3 Functional organization and its development
The retina receives visual information that it segregates into two visual streams: one beginning with rod photoreceptors, and the other with cone photoreceptors. Rods are activated by dim-light conditions while cones function in bright light and are responsible for colour vision. The division between rod and cone vision allows for the extension of the range of illumination conditions under which we can see.
The first synapse in the retina is between photoreceptors and bipolar celis. Signais that represent local increments or decrements in luminance are separated into two pathways and carried off by ON (depolarizing) and OFF (hyperpolarizing) bipolar cells. These then synapse onto ganglion ceils (Dowling, 1987a; Rodieck, 199$).
There are also lateral pathways involved in the visual stream. Figure 1 shows potentiai cell-to-cell interactions. In the OPL, there are horizontal celis that may influence the processing of visual information via its interactions with photoreceptors, bipolar celis, and with other horizontal cells (Haverkamp, Grunert, & Wassie, 2000; Vardi, Morigiwa, Wang, Shi, & Sterling, 199$). Another lateral pathway involves the amacrine celis located in the IPL. These
7
ceils exert their effect by interacting with bipolar ceils (Menger & Wassle,
2000) as well as with other amacrine celis.
1.2.3.1 Neurotransmitters and neuromodutators
In trying to understand the functional organization of the retina, questions arise about retinal synaptic mechanisms. The processing of visual information within the retina depends in large part on neurons interacting with each other via discrete and specific sites called synapses. Chemical messengers, either neurotransmitters (NTs) or neuromodulators (NMs) or both, relay information between cells and between different types of celis (Pycock, 1985; Daw, Brunken, & Parkinson, 1989).
There are over a dozen proven or presumed NT chemicals identified in the mammalian retina. Each celi type in the retina has usually been correlated with one or more NT(s) or NM(s); photoreceptors with glutamate, aspartate and taurine, horizontal celis wiffi y-aminobutyric acid (GABA), taurine, and glycine, GCs and bipolar celis with GABA and glutamate. However, the most chemically diverse celis in the entire retina are the amacrine ceils; (Pourcho. 1996; Pycock, 1985) this is probably due to the diverse phenotypes of this group. Different types of amacrine celis include AI and AIT ceils, dopaminergic amacrine celis, and starburst amacrine celis. They participate in a variety of excitatory and inhibitory circuits in the IPL. In keeping with the diversity of function of these ceils, many transmitter substances have been associated with
$
their pharmacology including acetylcholine (ACh), y-aminobutyric acid (GABA), taurine, glycine, dopamine, and neuropeptides (ex. Substance P, somatostatin, vasoactive intestinal polypeptide) (Pycock, 1985).
1.3
Amacrine ceils
Amacrine ceils as a whole were flrst discovered in the late 1 $$O’s. The name ‘amacrine’ cornes from the Greek a-makrôs-inos meaning “without-long fiber”, so called byRamony Cajal in 1883. Since their discovery, a wide variety of subgroups have emerged based on morphology and pharmacology (Dowling, 1 987a). As previously mentioned, this morphologically diverse group of cells is associated with a number of neurochemical agents and they are implicated in many inhibitory and excitatory circuits.
1.3.] Starburst amacrine celis
Starburst amacrine (SA) celis are probabiy the best characterized of ail amacrine cells. They have distinct characteristics that are found ubiquitously across species, suggesting a highiy conserved roie in the retina.
9
1.3.].] Characteristicproperties ofSA ceits
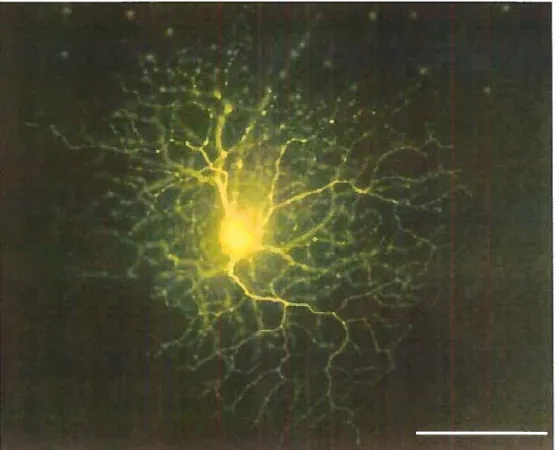
SA celis have a distinctive radially symmetrical morphology where the primary dendrites are branched regularly and repeatedly, and are studded with varicosities. This gives the ceils the appearance of starburst flreworks (Famiglietti, 1983) (figure 2). There aretwo subpopulations of SA celis: one is located in the TNL the other, forms a displaced population in the GCL. Both populations extend their dendrites into the IPL with the processes from the INL limited to sublamina a, and those from the GCL limited to sublamina b (Famiglietti, 1983; Voigt, 1986; $chmidt, Wassle, & Humphrey, 1985; Rodieck & Marshak, 1992). The density of these ceils is greatest at the area centralis with a graduai decrease in number as we go towards the periphery, essentialiy mirroring the distribution of GCs (Schmidt et al., 1985; Vaney et al., 1981; Voigt, 1986; Rodieck et al., 1992).
1.3.2 Acetylcholine release by SA cells
ACh is one of the oldest and best understood NTs. It was first identified as a NT in the peripheral nervous system (Dale, 1914; 1935) and then in the central newous system. Later studies showed that it is also a NT in the vertebrate retina (Neal, 1976). The synthesis and release of ACh is relatively
10
Figure 2: Image of a starburst amacrine celi from a rabbit retina labeled with Lucifer yellow. The dendrites are arranged radially around the celi body and are studded with varicosities. From: Masland (1986).
11
simple (Figure 3). It is synthesized in the cytoplasm from choline and acetyl co enzyme A by the enzyme choline acetyltransferase (ChAT); this enzyme is contained only in cells that synthesize ACh and is therefore a marker enzyme that identifies cholinergic celis. Following synthesis, ACh is packaged into synaptic vesicles via the vesicular acetylcholine transporter (yAChT); a proton dependent transporter. ACh is stored in these vesicles until its release from the presynaptic nerve terminal. Afier release, the ACh that is flot taken up by the post-synaptic terminal is hydrolyzed by extracellular acetylcholinesterase (AChE) to yield choline and acetate. The choline is taken back up into the presynaptic neuron, and can be used to resynthesize ACh or to synthesize phospholipids, which can be used as stores of choline.
1.3.3 Implications in direction selectivity
Direction selectivity is the ability of a ceil to interpret the direction of stimulus movement; there are many neurons in the visual system with this capability. The rabbit retina has been the focus of many studies on retinal direction selectivity because it contains direction selective ganglion celis. Most of the research has focused on the ON-OFF direction selective ganglion celis which make-up ten percent of the GCs in the rabbit retina (Vaney, 2001). There are four types of direction selective ganglion ceils; each responds preferentially to image motion in one of the four cardinal ocular directions — upwards, downwards, forwards, and backwards (Oyster & Barlow, 1967). It appears that
12
Figure 3: Illustration depicting a cholinergic fleuron. Diagrammed here, is the sequence of steps involved in the utilization of ACh as a NT. (1) Uptake of choline from the synaptic clefi by the presynaptic celi. (2) ACh is synthesized from choline and acetyl-coenzyme A (acetyl-SCo A) (acetate donor) by the enzyme choline acetyltransferase (ChAT). (3) formation of a releasable pOol of ACh. (4) Release of ACh from the presynaptic terminaI. (5) Interaction of ACh with the postsynaptic cefl. (6) Degradation of unused ACh by acetylcholinesterase (AChE) into choline and acetate.
from:
13
14
each point on the retina is covered by the four different subtypes of direction selective ganglion celis whereas direction selective ganglion celis of the same subtype span the retina in a territorial manner with little overlap of their dendritic fields (Amthor & Oyster, 1995; Vaney, 1994).
There has been much debate on the locus of computation of direction selectivity. Taylor and colleagues (2000) argued that the direction selective ganglion ceil is the first element to be fully direction selective in the rabbit retina while Borg-Graham (2001) argued that the ftrst direction selective element is located somewhere earlier in the chain of synapses leading to the GC. To date, this conflict remains unresolved however, the latter theory has been extensively studied and the results are favourable.
One of the prime candidates for the laterally displaced element responsible for direction selectivity is the cholinergic SA celis. The ON- and OFF- SA ceils stratify at precisely the same levels in the IPL as do the ON- and OFF direction selective ganglion ceils (F amiglietti, 1987; Famiglietti, 1992) and within each stratum, the numerous overlapping processes co-fasciculate with those of the direction selective ganglion ceils (Vaney & Pow, 2000; Tauchi & Masland, 1985).
SA ceils receive bipolar and amacrine cell input over the whole dendritic tree, although their output to GCs is restricted to the varicose distal ends (Famiglietti, 1991). It is proposed that this proximodistal segregation of the output and input synapses supplies the spatial asymmetry required for the generation of direction selectivity assuming that dendrites on different sides of
SA ceils provide selective output to direction selective GCs with different prefened directions (Vaney DI, 1989) (Figure 4). SA celis contain and release both acetylcholine (ACh), an excitatory NT and GABA, an inhibitory NT (Brecha, Johnson, Peichi, & Wassle, 1988; O’Malley, Sandeil, & Masland, 1992; Vaney & Young, 1988). Due to this fact it is proposed that each direction selective GC would selectively receive from a SA celi, either a cholinergic input located on the preferred side of the GC, or a GABAergic input located on the nuli side. If the two mechanisms operated together in a push-pull fashion, a SA celi process pointing in one radial direction would selectively excite a direction selective GC with the same preferred direction and selectively inhibit an overlapping direction selective GC with an opposite preferred direction (Masland, 2003; Vaney, 1989).
It may be premature to relate results obtained in the rabbit to the rat as the presence of direction selective ganglion ceils in the rat have yet to be established. However, direction selective GCs have been found in the retinae of other rodents such as the mouse (Yoshida et al., 2001; Weng, Sun, & He, 2005) and squinel (Michael, 1968) and consequently may apply to the rat as well.
A
y
figure 4: Selective SA celi outputs to direction selective GCs with different preferred directions. The SA ceil (center- black) process pointing in one radial direction would selectively excite a
direction selective GC (blue, green, purpie, or pink) with the same preferred direction and selectively inhibit an overlapping direction selective GC with an opposite preferred direction.
17
1.4
Superior coÏÏicuÏus
The visual system is believed to be divided into two streams: the geniculocorticai stream, responsible for the analysis of stimulus feature (i.e. form) (What pathway); and the superior colliculus, responsible for visual attention and orientation as well as multisensory integration (Where pathway) ($chneider, 1969; Rhoades & Chalupa, 1977; Rhoades, 1991).
1.4.1 Anatomical organization
The SC is a sensorimotor structure whose equivalent in lower animais (i.e. birds, reptiles) is the optic tectum. The SC appears as a large protrusion on the midbrain and is made up of altemating fibrous and cellular iaminae. As with many other mammais, the rat SC consists of seven layers which are usually divided into two functionai divisions. 1) The superficial layers: these include the zonai layer (Zo or layer I), the superficial gray layer (SuG or layer II), and the optic layer (Op or layer III). 2) The deep layers: consisting of the intermediate gray layer (mG or lamina IV), the intermediate white layer (InWh or lamina V), the deep gray layer (DpG or lamina VI), and the deep white layer (DpWh or layerVil) (Rhoades, 1991; Stem, 1981) (Stem and Meredith, 1991; Paxinos, 1997) (Figure 5). The occurrence of visuai neurons in the SC declines with depth in the structure. Neurons of the superficial layers are almost exclusively visual, whiie those ofthe deeper laminae could fall into one ofthe
SuG
op
-mG InWh DpG DpWhFigure 5: Location and laminar organization of the rat superior colliculus. A coronal section of the rat brain shows the laminar organization. The superficial layers of the SC inciude: zonai layer (Zo), the superficial gray layer (SuG), and the optic layer (Op), 2). The deep layers contain the intermediate gray layer (mG), the intermediate white layer (InWh), the deep gray layer (DpG), and the deep white layer (DpWh). From: Paxinos and Watson (1997).
su perfi cia I layers deep layers
19
six following categories: visual, auditory, somatosensory, motor, bimodal (ex. Visual-auditory), or multimodal (ex. Visual-auditory-somatosensory) (Rhoades et al., 1977).
1.4.2 Functional organization
In rats, the superficial layers of the SC are almost uniquely innervated by controlateral retinal inputs (Rhoades, 1991; Stem and Meredith, 1991). These inputs generate an elegant retinotopic map on the superficial layers - ceils with
receptive fields in nasal visual space are located rostral, whereas celis with receptive fields in temporal visual space are located caudal. Cells with receptive fields in the upper visual field are located medially and those with receptive flelds in the lower visual field are located laterally. Therefore the horizontal meridianof the visual field runs rostral to caudal, and the vertical meridian runs medial to lateral (Cynader & Berman, 1972; Siminoff, Schwassmann, & Kruger, 1966). In most animals, there is also an overrepresentation ofthe central visual area (fovea) on the SC. This overrepresentation is more pronounced in certain animals such as cats and monkeys, and less so in others such as rodents and hamsters (Rhoades et al., 1977; Rhoades, 1991).
The occurrence of visual neurons in the SC declines with depth in the structure. Although the deeper laminae contain visual cells (Stem, 1976), this partof the structure is more involved with other sensory processes (auditory and somatosensory) and motor processes. The topographic maps for other
20
modalities (ie. Auditory, somatosensory, motor) are similar to those found for the visual fieid in the superficial layers (Stem and Meredith, 1991). This overlay of sensory maps would allow for the visuai orienting of an animal towards a novel stimulus (Rhoades et ai., 1977; Rhoades, 1991; Stem, 1981; Stem and Meredith, 1991).
1.4.3 Afferences ofthe SC
The principal afferences to the SC come from the retina and the striate and extrastriate visual cortex (Harvey & Worthington, 1990; Huerta and Harting, 1984; Rhoades, 1991; Stem and Meredith, 1991). In certain animais, for instance the rodent, the retinal inputs to the SC crossover almost completeÏy (Lund, 1965). Over 90% of ganglion celis project toward the SC of the rat (Linden & Perry, 1983). This means that the right hemisphere of the SC contains a topographic representation of the lefi visuai fieid (derived from inputs from the lefi eye), and the left hemisphere contains a topographic representation of the right visual fieid (inputs from the right eye). As this crossover of afferents is flot compiete, there are a few ipsilaterai retinal inputs apparent (Siminoff et al., 1966; Lane, Ailman, & Kaas, 1971; Diao, Wang, & Xiao, 1983). There has also been a binocular zone identified near the rostrai pole of the SC (Tiao & Blakemore, 1976; finlay, Schneps, Wilson, & $chneider, 1978; Rhoades & Chalupa, 1979; Stem & Dixon, 1979; Diao et ai., 1983). The majority of direct retinal inputs terminate in the superficial layers of
21
the SC. There are some inputs that go directly to the deeper laminae of the SC however, most visual activity from this region is due to indirect retinal inputs such as the visual cortex. These cortical afferences to the SC are probably responsible for more complex characteristics of the receptive fields, such as binocularity (Rhoades et al., 1977; Rhoades, 1991; Stem and Meredith, 1991). There also exist projections going from one hemisphere to the other called tecto-tectal projections. There have been studies that suggest that these projections maybe inhibitory in nature (Goodale, 1973; Rhoades, 1991).
1.4.4 The mie ofthe SC in vision
The SC lias been implicated in visual attention and orientation, multisensory integration, and in control of eye, pinnae and head movements towards a stimulus (Rhoades et al., 1977; Stem and Meredith, 1991). These roles of the SC are generally attributed to the deeper layers. The overwhelming majority of axons that arise within the SC exit the structure en route to the premotor and motor areas through which its sensorimotor role is expressed. Nevertheless, il is stili unknown how the sensory signal in the SC is transformed into its motor input (Stem and Meredith, 1991; Rhoades, 1991). Guitton and Crommelinck (1994) proposed the foveation model in which visual information would travel dorso-ventrally, from the superficial layers to deep layers, where motor commands for ocular movement are initiated. The superficial layers are also implicated in the orientation of vision towards a novel stimulus.
22
Although it is generally the genicuiocortical system that is attributed with the subversion of detailed analysis of stimulus features such as its form, some studies show that the SC may also play a role in this analysis via projections from the superficial layers of the $C towards the thalamus (Stem and Meredith, 1991). Also stated by Stem and Meredith (1991) is the possibility of the foie of the superficiai of the SC in the discrimination of visual ftow and ieaming ofnew pattems (Stem and Meredith, 1991).
1.4.5 Direction selectivity in the SC
Direction selectivity is closeiy associated with SC fleurons, flot because directionaiiy seiective ceiis do not exist in other structures, but because a high proportion of SC neurons exhibit this property in many different species. Some examples of different species displaying this property include the cat (Berman & Cynader, 1972), mouse (Drager & Hubel, 1975), hamster (Finlay, Wilson, & Sclmeider, 1979; Stem et al., 1979), rat (Fukuda Y, 1978), ground squirrel (Michael, 1972), rabbit (Graham, Berman, & Murphy, 1982), and squirrel monkey (Kadoya, Wolin, & Massopust, 1971). The preferred direction varies from species to species. In the iguana (Stem & Gaither, 1981), hamster (Rhoades & Chalupa, 1976), and mouse (Drager and Hubel, 1975), the preferred direction is upward or upward and nasal. In contrast, the cat (Sterling & Wickelgren, 1969) responds best to stimuli moving nasal to temporal whereas in
23
the macaque monkey (Cynader et al., 1972; Goldberg & Wurtz, 1972) there seems to be no preferred direction.
Studies in the rat have shown that about 12% ofvisual ceils demonstrate a clear direction selectivity (Fukuda, 1978; Gonzalez, Perez, Alonso, Labandeira-Garcia, & Acuna, 1992). While some researchers have noted a preference for upward direction (Fukuda, 1978), others have found no apparent tendency for a specific direction (Fortin et al., 1999).
The origin of direction selectivity in the $C is thus far unknown. It has been suggested that direction selectivity originates in the visual cortex given that cortical lesions in the cat have led to a decrease in direction selectivity in the SC. However, studies donc in rats have shown that cortex activity appears after the SC displays direction selective ceils (Fortin et al., 1999). In view ofthe fact that over 90% of retinal projections in the rat are directed to the SC, it is proposed to be the retino-collicular pathway that is important for the direction selectivity found in the SC.
24
1.5
The objective ofthis study
There were two main goals of this study. The first goal was the characterization of the anti-VAChT:saporin immunotoxin effects along rat development. Amacrine celis are the only cholinergic ceils present in the retina (Chalupa & Gunhan, 2004). In order to determine the deveiopmentai course of these celis, intraocular injections of an immunotoxin (saporin-VAChT) were carried out on rats ofvarious age groups (from date ofbirth to aduithood). This toxin is specific for the vesicular acetyicholine transporter and therefore eÏiminates ail retinal cholinergic amacrine celis (Gunhan, Choudary, Landerholm, & Chalupa, 2002).
The second goal was to determine the effect of cholinergic neurons on SC ceil properties, most notably direction selectivity. Electrophysiological recordings were performed to determine the influence of cholinergic amacrine ceils on receptive field properties ofvisual neurons from the superior colliculus.
26
2.1
Experirnental model
Timed-pregnant and aduit Long Evans rats were obtained from Charles Rivers Laboratories (St-Constant, Canada). The study was performed under the guidelines established by the Canadian Council for the Protection of Animais regarding the care and use of animais for experirnentai procedures. The study involved 92 rats, male and female, of various ages (Table I and II). 0f the 92 rats, 22 were normal (i.e. did flot receive any intravitreal injections), 26 were controls and received intravitreal vehicle injections (i.e. saline-injected), and 44 were treated and received intravitreal immunotoxin injections (i.e. toxin injected). The amount of fluid injected depended on the age of the rat. The two injected groups received injections at various ages and were raised to adulthood before any immunohistochemistry was performed. This was done to determine how the immunotoxin affected SA celis during different stages of their developrnent. Ail 3 groups had subjects (normal, n 22; saline, n = 10; toxin, n = 5) that had electrophysiological recordings done at the level of the SC. Ah recordings were done once the animal reached adulthood.
2.2
Freparation of animalfor intravitreal injection
Since the effect of the novei immunotoxin against the vesicular acetylcholine transporter (anti-VACliT) (immunotoxin was already diluted in sterile saline) was to be tested on various postnatally aged rats, the anaesthesia
27
Age at No. of Volume Age at Protocol
iijection subjects injected(’ul) sacrifice applied
Sati,ie-injected P4 $ 3 >P60 histoiogy
Toxin-injected P4 10-1 * 3
>P60 histoiogy
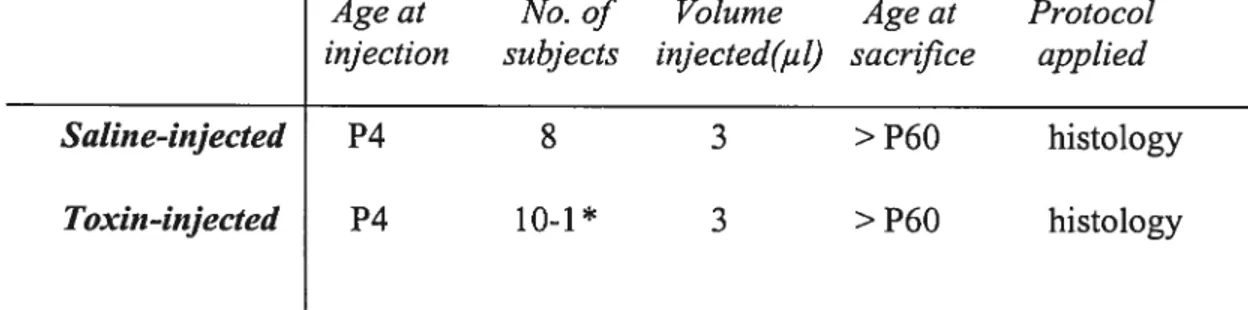
Table I: The group of subjects that were submitted to intravitreal injections using the ‘old’ protocol. The protocol used in this group was that used by Gunhan and colleagues (Gunhan et ai, 2002). These subjects had no electrophysiologicai recordings done; only immunohistochemistry was perfonried on the retinas.
28
Table II: The group of subjects that were submitted to intravitreal injections using the ‘new’ protocol. The protocol used in this group was developed by the laboratory of Dr. Casanova. Certain subjects had both electrophysiological recordings done in the SC and immunohistochemistry of the retinas.
29
Age at No. of Volume Age at Protocol
iîUection subjects injected(u 1) sacrfice applied
Saline-injected P1 18 1.5-2 > P60 histology and
elecfrophysiology Toxin-injected P1 6 1.5 P8 histology 6 1.5 >P60 P4 10 1.5-2 > P60 histology and electrophysiology P2 2 1.5 P9 histology 2 1.5 P16 histology P6 2 2 P13 histology 2 2 P20 histology P12 21* 2 P19 histology 21* 2 P26 histology P60 1 3 P67 histology 1 3 P74 histology 2 5 P74 histology
30
protocol employed varied with the age of the animal. Ail pups were handled in sterile conditions since they would be replaced with the mother. Therefore, pups were taken from the mother using sterile gloves and placed in a sterile surgical mask for transportation to the incubator where they were placed on a disposable underpad. One rat pup at a time was placed directly onto and covered with cmshed ice to prevent the pup from moving — air pockets were present so the animal could breath. Hypothermia was achieved in s-10 minutes for each pup. Rats oÏder than P2 were anesthetized with isoflurane 4-5% for 5-7 minutes and then isoflurane was reduced to 2%. Animais remained anesthetized for the duration of the surgical procedure (approximately 3 minutes). Once the surgical procedure was completed, pups were re-placed in the incubator until fully awake and normal body temperature was achieved, then transferred along with their mother using sterile gloves. Aduit rats were put back in their cage where they once again became fully active. Exciuding anesthesia protocols, ail aspects of surgery were the same for ail groups.
The anesthetized animal was placed under an operating microscope in order to perform the surgery. If the animal was less than post-natal day 14 (P 14), an incision of the eyelid needed to be performed because the eyeiid was stiil closed at this point; this was done using an ophthalmic scalpel (Micro Feather). As this was the first study to attempt intravitreal injections in rats at P0, it was necessary to devise a novel protocol in order to perform injections in eyes of such small size. Our first protocol was developed by the laboratory of Dr. Chalupa (Gunhan et ai, 2002) (i.e. ‘oÏd’ protocol). A scierai pilot hole at the
31
most posterior region of the eye was made using a 30 gauge needle in order to facilitate penetration of the underlying sciera, choroids, and retina by a biunt-tip needie which is coimected to a lOpi glass syringe (Hamilton, Reno, NV) by polyethylene tubing prefihled with distilled water prior to drawing up the fluid (vehicle or immunotoxin). An air bubble was created between the distilled water and the material being injected. The vehicle or immunotoxin was injected into the vitreous chamber where the pilot hoie had already been made. This route of administration avoided injury to other structures of the eye such as the iris or lens. The volume of fluid injected into the animais eye varied being that the size of the eye was dependant on the animais age (Table III). The injection was performed at an oblique angle to the eye and was given slowly over 1 to 2 minutes to allow for diffusion of the fluid. Afier each injection, the eyelid was resealed (if it had been surgically opened) using a tissue adhesive (VetBondTM, 3M) and an ophthalmic ointment (Neomycin and Polymyxin B Sulfates and Bactracin Zinc, Bausch & Lomb®) was applied to prevent any infection. This protocol proved to be inaccurate since it did not inject the required amount with each injection. Therefore, a second intravitreal injection protocol was developed in our laboratory during the course of this study. A scieral pilot hole was made using a 31 gauge needle to ease penetration by a tapered glass micropipette (inner diameter of 1.Smm) with a tip diameter of 25 to 30iim and a tip length of
32
Age at Injection Volume injected (iii)
PO-P2 1.5-2
P6 2
P12 2
P21 3
>P60 5
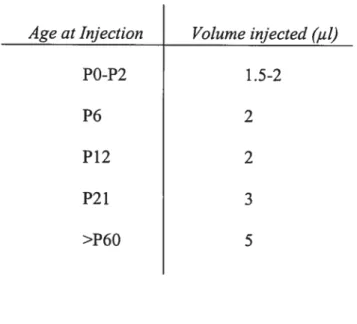
Table III: Volume of an intravitreal injection varied with age of rat. The volume of an intravitreal injection depended on the age of the rat since the size of the eye increased with age.
33
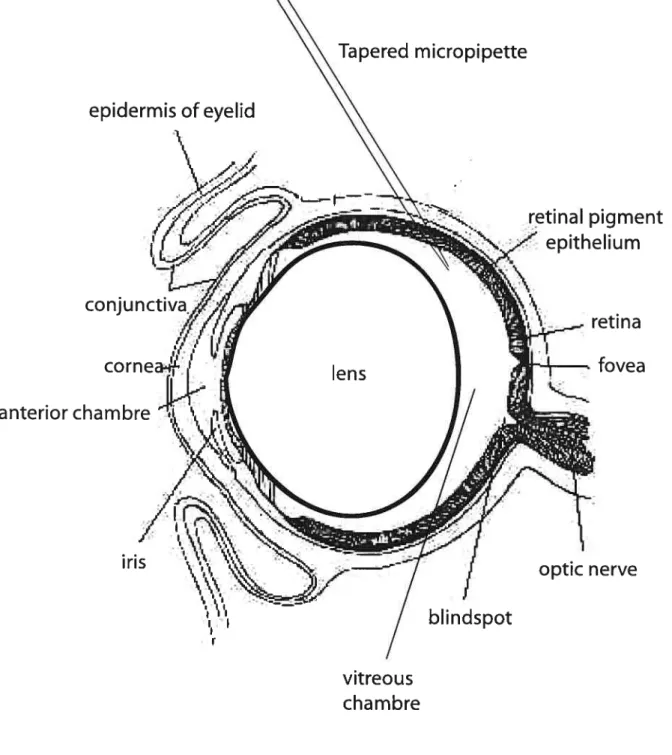
2.5mm (Figure 6). It was fourni that glass micropipettes were preferable to metal needies because the tip diameter was smailer, the depth of injection was casier to standardize, and the tapered pipette tip effectively seals the injection site during injection, therefore reducing leakage of the injected fluid from the eye. The tapered micropipette was connected to a 10 d glass syringe (Hamilton, Reno, NV) by a 15cm long poiyethyiene tubing (Portex FiniBore, UK; outer diameter of 0.8mm and inner diameter of 0.4mm) pre-filled with heavy minerai oil (Rougier®) prior to drawing up the ftuid (saline or immunotoxin). All junctions on this apparatus were sealed with epoxy ricin. Injections were performed in the same manner as in the first protocol.
2.3
Testing ofanaesthesia protocols
We tested two different anaesthetics to determine which would be best in order to perfonn electrophysiological recordings in aduit rats at the level of the SC. We tested both ketamine and urethane. Ketamine 8Omg/kg (Wyeth Ayerst Canada, Inc.) was injected intraperiteonally in 3 adult rats. Levels of anaesthesia were determined by response to hindpaw pinch every haif hour and maintenance doses of 80 mg/kg (intra-muscular) were given when required.
Another group of rats received an intraperitoneal (LP) injection of urethane (Sigma®) 1250 — 1500 mg!kg at different concentrations (15%, 20%, 25%, 30%, 40%, 50%, 60%, 70%, and 80%). The same protocol for monitoring
Tapered micropïpette
corne
anterior chambre
Figure 5: Schernatic representation of an intravitreai injection in the rat eye.
The injection is performed at an oblique angle through the dorsal hemisphere of the eye and micropipette was inserted through the sciera to a standardized depth, so as to avoid injury to the lens.
Modfiedfrom: http]/www. ratbehavior. org/Eyes. htrn
epidermis of eyelid
pigment
reti na
fovea
ï ris
optic nerve
blindspot
vitreous
35
anaesthesia levels used for ketamine experiments were employed here. Maintenance doses consisted of 0.1 —0.2m1 ofurethane l500mgIkg.
2.4
Freparation of animalfor electrophysiological recordings
The aduit animais were anesthetized witli an intraperitoneai injection of urethane 30% (1.25-1.5g/kg) (Sigma®). A rectal probe and a heating pad placed under the animal were used to ensure a constant body temperature of 37-37.5°C. Hindpaw reflex and electrocardiogram (ECG) were regularly monitored in order to maintain a proper level of anesthesia. Pupils were dilated with the use of ophthaimic drops of atropine sulfate 1% (Isopto® Atropine). The comeas were kept moist by periodically applying carboxymethylcellulose (Celluvisc®, Allergan).
The animais were placed on a stereotaxic frame. Craniotomies were performed over the contraiateral hemisphere of the eye being tested (immunotoxin-injected; saiine-injected; untreated). Coordinates for the SC were anywhere between —5 to —8mm Bregma and 0.5 to 3 medio-iateral (co ordinates from Paxinos and Watson, 1997). The dura mater was then excised and electrodes were lowered into the SC. The cortex was constantly irrigated with artificial cerebrospinal fluid (aCSF) throughout the surgical procedure. Finally, the cortex was covered with agar 2% to prevent drying out of the cortex.
36
2.5
Single-unit extracellular recordings
Extracellular recordings of single celis in the superior colliculus were done using tungsten microelectrodes (A&M Systems, inc©., Carlborg,
Washington State, USA) of an impedance between 1 and 5ML The cellular response was then amplified with the aid of an amplifier (Grass®, Astro-Med Inc.) and transmitted to an oscilloscope (Kikusui®) ami audio monitor. The cellular signal passes through HumBug® (Quest Scientific) — a system that eliminated electrical signals from anaÏog signals. Action potentials were isolated from the spontaneous activity using a window discriminator (WPI). The signal was then fed to the acquisition program (Spike2. 15, CED Cambridge, UK) via an analog digital interface (1401, CED). The responses were recorded as post stimulus time histograms (PSTH) of 10 ms bin width.
2.6
Visual stimulation
The animal was placed parallel to a translucide screen 28.5cm away from the eye being stimulated. Once a visual response was found, the receptive field was first mapped and its limits were established using a manually controlled stimulus projected onto a screen parallel to the animals eye using a hand-held projector and an ophthalmoscope. Quantitative testing of each visual ceil was then carried out using stimulation generation software, VPixx (Sentinel Medical Research Corp., Quebec, Canada) mn by a Macintosh computer. The
37
stimuli were back projected by a LCD projector (NEC) onto the translucide screen parallel to the animal covering 800 x 107° of the visual angle. If the receptive field for a given visual unit was found and mapped, the stimuli were presented within the limits of its receptive field. Otherwise, full-screen stimuli were presented to the visual celI. Once receptive field properties were characterized, we proceeded to quantitatively analyze the cell’s properties (spatial frequency, temporal frequency, contrast, preferred directionlorientation) using sinusoidal drifting gratings. 1n order to determine the spontaneous activity level of a cell, the activity for a blank screen of equal mean luminance was quantified during each test. Each stimulus presentation lasted for 4 seconds and was repeated 4 times. Presentations were randomly interleaved and only the tested eye was exposed to the stimulus.
2.7
Receptivefleldproperties studied
The main property of interest for an individual fleuron was its preferred direction. Each cell’s properties (spatial and temporal frequency and contrast) were first optimized in order to determine the preferred directionlorientation.
38
2. 7.] Direction selectivity
To determine the direction selectivity of a visual neuron, a driffing sinusoidal grating was presented to the animal at various orientations (between
00 and 360°, intervals of 15° or 30°). The orientation curve reftects the mean
response of a celi (action potentials/second) to each of the orientations presented. The bandwidth represents the degree of selectivity of the ceil for orientation; it is represented in degrees and corresponds to the mid-width of the curve measured at the mid-height of the curve. The orientation curve also contains information relative to the direction selectivity of movement of the tested cell. Although gratings presented at, for example, 00 and 1800, are oriented in the same sense, they move in opposite directions. hi order to quantify this property, a direction selectivity index (DI) is calculated with the following formula:
response amplitude for the non-preferred direction —spontaneous activity
DI = 1
-response amplitude for the preferred direction —spontaneous activily
The non-preferred direction is represented by the direction 180° ± 30° away from the preferred direction. A neuron with a DI > 0.5 is considered to be
39 selective for direction, and a celi with a DI < 0.5 is said to be non-selective for
direction (Casanova et ai, 1992).
2.7.2 Spatialfrequency
The spatial frequency (SF) is the number of cycles per degree. To determine the preferred Sf of the ceii, various SFs are presented at the ceii’s preferred direction. This test aiiows for the discovery of the preferred SF as well as the spatial resoiution of the ceil. That is to say, the maximum frequency the ceil is abie to respond to, as well as the minimum frequency that will elicit a ceiiular response. The SF curve indicates the preferred SF and also the ievel of seiectivity for this preference. The bandwidth is expressed in octaves and corresponds to the fuii-width of the cuwe measured at the mid-height of the curve. A ceil can have one of three types of responses which is represented by the shape of its response curve; (1) bandpass ta Gaussian curve), where a cell has an optimal SF; (2) iow-pass, where a celi responds with no attenuation to iow SFs; and (3) high-pass, where a ceii responds with no attenuation to high Sf s.
2.7.3 Temporalfrequency
Temporal frequency (TF) represents the number of cycles per second (Hz). To determine the preferred TF of a ccli, we present a grating optimized for
40
orientation!direction and spatial frequency at different TFs. The same methods employed for spatial frequency were used in this instance to detenTiine the optimal TF, degree of selectivity and temporal resolution.
2.7.4 Velocity
When the optimal spatial and temporal frequencies were available for a cell, we were able to determine the preferred velocity of the cell. The velocity of a stimulus was calculated by the following equation:
Spatialfrequency (c/°) Velocity
Temporalfrequency (c/s)
2.7.5 Contrast sensitivity
In order to determine the contrast sensitivity of a ccli, the contrast level of the stimuli was varied from O to 100% contrast and presented to the animal. Under each stimulus condition, the action potentials of the cell were collected for each repetition, averaged and normalized, where the maximal response for each ceil was taken as 100%. The shape of the curve obtained allows for the determination of the C50 (50% of the maximum response), contrast threshold, and function—sigmoidal, log or linear.
41
2.8
Verfication ofneuroanatomical sites ofrecordings
inthe $C
To prove ail recordings were done in the SC, electrolytic lesions were performed along the electrode penetration. Using a lesion maker, a cunent of 5iA was passed through the electrode for four seconds, at three different
locations of penetration (moving from the most ventral to dorsal position). The animal was euthanized at the end of the experiment using an overdose of either halothane or isoflurane (via inhalation). The electrocardiogram (ECG) was used to confirm the death of the animal. The animal was then subject to an injection of heparin directly into the left ventricle of the heart. Following intracardial perfusion ofthe animal using phosphate-buffer saline (PBS) 0. 1M at pH 7.3 and parafonTialdehyde (PFA) 4%, the brain was removed and placed in PFA 4% for 24 hours. The brain was then transferred to a sucrose solution 10% (12 hours), then 20% (12 hours), and finally 30% (12 hours). Finally, the brain was eut in coronal sections of 40km thiclmess with the aid of a microtome (Leica). Half the sections were treated with violet cresyl, the other half with a solution that reveals the enzyme acetylcholinesterase (AChE). The SGS of the SC is an AChE-rich layer, and therefore, has a darker appearance once treated with this solution (Paxinos and Watson, 1986).
42
2.9
Revelation of cholinergic neurons of th e retina
Animais were euthanized with an overdose of halothane or isoflurane (via inhalation) at ages ranging from P6 to aduit, and then perfused with PBS and PFA 4%. The dorsal part of the eye was marked so as to keep note of the orientation of the eye, and the eyecups were then removed. An incision was made at the outer limit of the comea using an ophthalmic scalpel (Micro Feather), and microscissors were then employed so the comea could be removed. A PBS solution was used throughout the procedure to keep the eye well hydrated. A notch was made at the marking indicating the dorsal part ofthe eye. The eye was post-fixed in PfA 4% for 30 minutes; once removed from the PFA 4% solution, the eye was rinsed with PBS solution. The lens was finally excised and the eye placed in a sucrose solution 30% ovemight to cyroprotect the tissue.
Ail retinal samples were processed for post embedding immunohistochemistry according to the methods estabiished by Gunhan et al (2002). The eyes were placed in frozen tissue embedding matrix (HistoPrep, Fisher Scientific). A microtome was used to cut cross-sections of 20im, which were then mounted on gelatine-coated siides. Cross-sections of the treated eye and the contralateral control eye were placed on the same siide so that both eyes would receive the same treatment. The siides were then placed in an incubator at 37°C for 2 hours; this ensured that the cross-sections would stay mounted on the slides during the course of the immunohistochemistry. The siides were then
43
pre-incubated with a PBS solution containing normal donkey serum (NDS) 10%, (BSA) 2.5%, 0.5% Triton X-100 for 2 hours. These were then put through a wash cycle, which involved rinsing with a mixture of 0.3% Triton X-100 in PBS, followed by three washes in PBS. Goat anti-choline acetyltransferase (ChAT) affinity purified polyclonal antibody (Chemicon International, Temecuta, CA), the primary antibody, was diluted (1:50) in a blocking solution containing (NDS) 10%, (BSA) 2.5%, triton-X 0.5% and cross-sections were incubated with this solution overnight at 4%. The next day, these sections were put through the wash cycle, and then incubated with a fluorescent secondary antibody, fluorescein (FITC)-conj ugated AffiniPure donkey anti-goat IgG (Jackson ImmunoResearch Laboratories, Inc., Mississauga, ON), diluted 1:600 PBS-BSA for 1 hour at room temperature. Afier a final cycle, slides were coverslipped with Vectashield mounting media (Vector Laboratories). Fluorescence marked any retinal cholinergic neurons present and images of the retinal siides were taken using a Leica (DMR) binocular microscope equipped with a CCD camera (Retiga) 1300, Qlmaging.
45
3.1 Introductoîy rernarks
Preliminaiy resuits of this study showed that two techniques employed in this project had to be ameliorated before this study could be fully commenced. f irstly, we had difficulties with anaesthesia of aduit rats for electrophysiological recordings. Secondly, immunohistological resuits demonstrated that there was no elimination of cholinergic celis in the retina following intravitreal injections of anti-VAChT:saporin immunotoxin. The first technique to be addressed was the anaesthesia protocol empioyed for the electrophysiological study; the second was the intravitreal injection protocol utilized for rat pups.
Once the technical problems were rectified we performed electrophysiological recordings in the SC of normal and treated aduit animais. Later histoiogical analysis of the retina of treated animais showed that a large majority of cholinergic neurons were stili present when it was expected that these ceiis would be compieteiy eliminated. This then led to our focus on the developmentai course of cholinergic SA cells in the retina and how they were affected by the anti-VAChT:saporin immunotoxin.
46
3.2 TecÏmical improvernents in material and methods
3.2.1 Anaesthesia
Different anaesthesia protocols were tested on aduit rats to determine which would be the most reliable to employ during electrophysiological recordings in the SC. We attempted to anaesthetize aduit rats with two different kinds of anaesthetics. Both had previously been used in rat electrophysiological studies in the SC. The first experiment using ketamine 8Omg/kg intraperiteonaily was flot successfiui in keeping the rat anaesthetized for periods longer than an hour without giving the animal a maintenance dose at the end of each hour. As experiments could last up to 10 hours or more, we found this anaesthetic required the animal to be injected too ftequently during the course of the experiment (ranging from 10-12 times, depending on the length of the experiment). The other anaesthetic we tested vas urethane 1250 — l500mg!kg
intraperiteonaily. Here, we found that high concentrations levels (40 — 80%)
caused the animal to die within 2 - 4 hours after the initial injection, whiie low
concentrations (15 - 25%) required large amounts of solution to be injected
intraperiteonally. Finally, urethane 30% IP was considered the best anaesthetic to use in our rats as it allowed animais to achieve anaesthesia rather quickly (10-30 minutes) and maintenance doses (0.1 — 0.2 ml) were required only every 6 to
47 3.2.2 Intravitreat itUections
Initial intravitreal injections in this study were performed using the ‘old’
protocol supplied by Dr. L. Chalupa’s laboratory of University of California at
Davis. Resuits from this study demonstrated that there was no elimination of
cholinergic neurons. During the surgical procedure, we noticed that the amount
of immunotoxin reaching the eye was flot standardized and there was extensive
leakage once the injection was performed. This led us to develop a ‘new’
protocol for infravifreal injections. The new protocol was able to inject a precise
amount of the immunotoxin and produced no or very little leakage once the
procedure was completed (see Material and Methods section for a detalled
description ofboth protocols).
3.3 Effect of VAChT-saporin imniunotoxin using the new injection
protocol
Since the old protocol was ineffective, we developed a new protocol for
intravitreal injections (see Material and Methods section) and the following
resuits were obtained with this improved procedure.
Six rats received intravifreal injections of the VAChT-saporin
immunotoxin at Pi. Animais were euthanized one week later and retinae processed to determine if the injections were successfiul. Figure 7 shows the
non-freated and immunotoxin-treated retinae from the same rat. The ChAT immunoreactivity was clearly evident in both central and penpheral regions of
4$
Figure 7: Cholinergic amacrine celis in the developing rat retina. The images are vertical sections of P8 retinae from a rat treated at Pi. A) In central and peripheral regions of the normal retina, there is heavy labellîng of ce!! bodies in
the GCL and 1NL. Also seen are the clear!y !abe!led dendritic arborizations in
the IPL. B) Almost complete elimination of immunoreactivity is noted in the
treated eye. There is some weak labelling of celi bodies stili present. GCL:
A
B
0.1
mm
GCL
IPL
INC
GCL
‘PI
INL
03M1 706 03M1 70650
IPL as two distinct strata of cholinergic processes. Also noted was the labelling
of the soma of cholinergic neurons. In contrast, the immunotoxin-treated retina
(Figure 7B) showed a marked decrease in ChAT immunoreactivity with only a
few ceil bodies iabelled. Thetoxin had an effect on 5 out ofthe 6 subjects.
3.4
Impact ofretinal cholinergic ceils on activity in the SC
From the immunohistochemicai resuits of the prior experiment, it was
concluded that the VAChT-saporin immunotoxin was abie to eliminate the
majority of cholinergic amacrine neurons from the retina. Therefore, intravitreal
injections of the toxin were then performed in newbom rats. The animais were raised to adulthood at which point electrophysiological recordings could be
performed. This was done so as to determine if the iack of SA celis would affect
the receptive field properties of visual ceils in the SC. Recordings were done in
27 aduit rats. 0f these, 22 were normal subjects and 5 were freated subjects who had an infravifreal injection done at P2. Ail saline-injected rats died during
electrophysioiogical recording sessions and did not produce any resuits.
3.4.1 Physiologicat properties ofvisuaÏ SC neurons in normalrats
3.4.1.1 Direction selectivity
A total of 32 visual ceils were tested quantitatively for direction
seiectivity in normal subjects; 26 cells were found to be ‘orientation’ selective
51
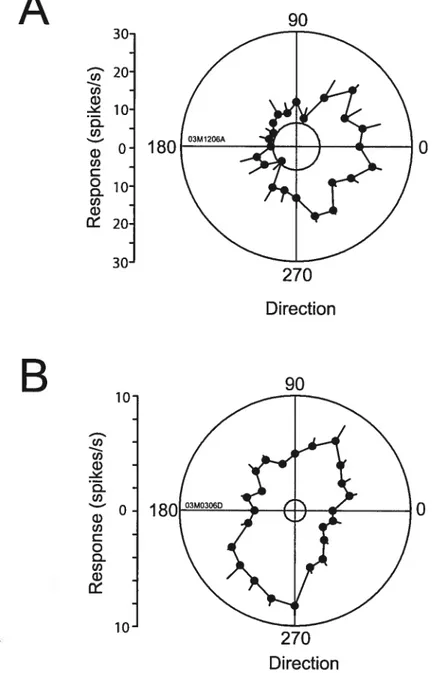
direction selective celis (DI> 0.5). The distribution of DIs is presented in figure $A; the mean direction index was 0.34 ± 0.24. li most direction selective neurons, the preferred direction was very broadly tuned. Figure 8B illustrates
the bandwidth distribution in our population, showing most cells as being
broadly tuned (mean bandwidth 48.5 ± 24). Depicted in figure 9 is a typical
direction selective celI (A) and ‘orientation’ selective ce!! (3) encountered in a
norma! subject. The ‘orientation’ selective cell refers to a celi that responded
se!ectively to motion on one axis (ex. 00 and 180°). The direction se!ective cel!
rcsponded optimally to gratings with an orientation of 45°, but was broadly
tuned and had a bandwidth of 96.4° with a DI 0.74. The ‘orientation’ se1ective
celi was tuned broadly to gratings with an optimal orientation of 270°. It
responded slight!y more weakly to gratings of the same orientation but moving
in the opposite direction (90°). IFie DI for this celi was 0.17.
3.4.1.2 Spatialfrequency
27 visual ceils were tested for spatial frequency in normal rats and we
found that, genera!!y, visual neurons of the SC responded optimally to stimuli
with a !ow spatial ftequency (< 0.07 c/deg). The mean spatial frequency was 0.03 cl0. Among the neurons from the norma! group tested for SF, 14 had a low
pass response profile and 13 were broadly tuned for low frequencies. Figure 10
shows examples of typical response curves for SF found in our population.
Panel A represents a unit with a low pass response profile to increasing SF.
Panel B shows a bandpass cell with n prefened SF of 0.05 cl0. The mean
u) G) o
4-o
G)-o
E
Dz
u) G) o4-o
1 Q-o
E Dz
A
81îL-LLLtL
10 20 30 40 50 60 70 80 90Direction bandwidth
B
Figure 8: Distribution of DIs and bandwidths for normai animais. A) Distribution of DIs in the normal subjects, where the mean DI is 0.34 ± 0.24°. B) The broad direction tuned function is represented here by the bandwidth distribution where a high proportion ofcells display a bandwidth of 48.5 ± 24°.
0.00 0.20 0.40 0.60 0.80 1.00
30 90
I
180E06A0 30 270 DirectionB
10 CI) CI) G) -‘ ci1100
0Figure 9: Exampte of a direction and ‘orientation’ sciective neuron from normal subjects. A) Response ofa broadly tuned direction selective ccli for 450rn
B) A typical ‘orientation’ selective ccli found in the normal group; this neuron
is selective for a direction of2700 and almost equally selective for the grating
moving in the opposite direction (90°). Responses are shown as mean + S.E.M and are represented by solid unes. Dotted unes represent spontaneous activity levels.
270
54
Figure 10: Response of SC celis from normal rats to the spatial frequency of drifiing gratings. A) Spatial ftequency tuning for a ccli with a lowpass response profile. B) An example of a bandpass ccli tuned for a spatial frequency (0.05
cl0). Responses are shown as mean± S.E.M and are represented by solid unes. Dotted unes represerit spontaneous activity levels. C) Distribution of optimal spatial frequencies show cells respond to SFs ranging from 0.005 to 0.09 cl0 with a mean optimal SF of0.026c/°.
A
B
C
U) U) G) -o U) G) U) o1 o-U) G) 60 U) U) G)-a
40 U) G) U) a20 U) G) U) G) o 4-o G) -o E Dz
0• 0.01 0.1Spatial frequency (cldeg)
03M1710A
0.01
Spatial frequency (cldeg)
8 I_n — I_n N. e C C C C C C C C d q A C C C