A DISSOCIATIVE ELECTROIONIZATION STUDY OF NITROUS
OXIDE. THE NO
+AND N
2+
DISSOCIATION CHANNELS
J.L. OLIVIER, R. LOCHT and J. MOMIGNY
Institut de Chimie, Département de Chimie Générale et de Chimie Physique, Sart-Tilman par B-4000, Liège 1, Belgium
Abstract
The decay of N2O into NO+ and N2+ dissociation channels has been investigated by electron impact using ions
kinetic energy and mass analysis. The appearance energies of NO+ and N2 +
are measured as a function of the released translational energy. Both decay channels are mainly reached through predissociation of the N2O
+
ionic states. In the NO+ decay channel, only one dissociation limit is involved, i.e. NO+(X1Σ+, υ) + N(4S) and hence the repulsive 4Σ- state is responsible for all the observed phenomena. In the N2
+
decay channel, several dissociation limits are involved. Dissociative ionization involving doubly excited states of N2O in both dissociation channels
are briefly discussed.
1. Introduction
Most of the experimental techniques available today have been applied to investigate the ionization and dissociation of N2O. Absorption and emission spectroscopic work [1,2] as well as several photoion-ization
studies were concerned with this molecule [3-5]. The He (I) photoelectron spectrum of nitrous oxide has been investigated many times and more recently by Dehmer et al. [6]. Potts and Williams [7] recorded a He (II) photoelectron spectrum. The most recent photoionization mass spectrometric work has been performed by Berkowitz and Eland [8]. Several photoelectron [9,10] as well as threshold photoelectron—photoion coincidence [11,12] experiments have been used to investigate the dissociation of N2O
+
.
All these experiments enabled to analyze the four dissociation channels of N2O +
. In addition to the formation of NO+ and O+ ions below the Ã2Σ+ state of N2O
+
, the decomposition of the à 2Σ+, 2Π and 2Σ+ leads to the formation of NO+ and N2
+
and NO+, N2 +
, O+ and N+ respectively.
The direct photodissociation of the nitrous oxide ion producing NO+ ions has been investigated by several research groups [13,14] and recently by Larzilliere et al. [15].
The dissociative electroionization of N2O has been studied many times, e.g. refs. [16-18]. The most
extensive work, including a crude kinetic energy analysis of the fragment ions, has been published by Curran and Fox [19]. They measured the threshold for all the dissociation channels, including the production of O-ions.
Quantum mechanical calculations have been performed on the N2O +
system. In addition to the calculation of 2Π states, Lorquet and Cadet [20] positioned 2Φ, 4Σ- and 4Π states. More recent work of Hopper [21] and Beswick and Horani [22] is essentially concerned with the 4Σ- state responsible for the ionospheric reaction O+ + N2 → NO
+
+ N and for the appearance of NO+ close to the threshold in the dissociative ionization of N2O.
In the present paper we present the first part of a mass spectrometric study of the dissociative electroionization of N2O leading to NO
+
and N2 +
ions together with an extensive analysis of the fragment ions kinetic energy distribution.
2. Experimental
The experimental setup used in the present work has been described in detail earlier [23] and only the salient features will be repeated here. The ions generated in a conventional Nier type ion source by the impact of electrons of controlled energy, are focused on an exit hole, energy analysed by a retarding lens and mass selected in a quadrupole filter. The ion current, collected on a Cu—Be electron multiplier, is continuously measured as a function of either the electron energy at fixed retarding potential or the retarding potential at fixed electron energy. Both signals are electronically differentiated, stored and averaged in a multichannel analyser and plotted on a X- Y recorder.
The operating conditions maintained during this work are identical to those described elsewhere [23], unless otherwise stated.
The nitrous oxide gas is a product from Air liquide of 99.5% purity, dessicated and distilled under vacuum. Only for that part of the experiment concerned with thermal and nearly thermal N2+ ions from N2O, special care is
taken to lower the nitrogen background signal. After baking, the ultimate vacuum in the vessel is 2 X 10⁻⁸ Torr. The nitrous oxide gas is introduced at a pressure of ≈10-7 Torr.
The maximum of the N2O +
ion energy distribution is used as the zero energy calibration point for the ion kinetic energy scale. The same reference is used when the ionization efficiency curves of N2
+
and NO+ are recorded at different retarding potential settings.
The first adiabatic ionization energy of N2O, i.e. 12.886 eV [8], is used to calibrate the ionizing electrons energy
scale. The electron energies indicated for all the ion kinetic energy distributions presented in this work, are corrected with respect to the same reference.
All the measurements are repeated at least five times independently and the threshold energies quoted here are averaged values. The errors are given by the standard deviation. In the kinetic energy-versus-elec-tron energy diagrams, linear regressions are used to fit the experimental points.
3. Results
3.1. The NO+ ion
The ion energy distribution.
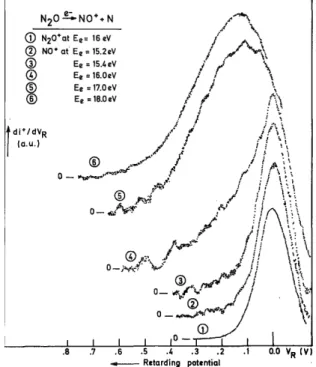
Typical recordings of the first differentiated retarding potential curves of NO+ at different electron energies are presented in fig. 1. For comparison the thermal energy distribution of N2O
+
is included in the same figure. In the kinetic energy distribution observed for NO+ between 15.2 and 16 eV electron energy, the main peak remains constant in energy and width. The spectrum is dominated by the thermal energy ions. The intensity of energetic ions becomes significant from 16 eV and up to 80 eV electron energy. At 17 eV and at higher electron energies, no thermal peak is observed and the maximum is shifted to 110 ± 10 meV. The peak width increases with the electron energy.
Fig. 1. First differentiated retarding potential (VR)curves of NO +
/N2O recorded at the indicated electron
The ionization efficiency curves. A set of first differentiated ionization efficiency curves of NO+ from N2O is shown in fig. 2. Such curves were recorded for retarding potential settings between 0 and 1.5 eV by steps
of 100 mV.
Different onsets are measured (shown in fig. 2 by vertical bars) and plotted versus the NO+ kinetic energy. The result is given in fig. 3 and six different processes are evidenced, i.e. at 15.29 ± 0.1 eV, 16.9 ± 0.2 eV, 17.6 ± 0.2 eV, 19.25 ± 0.2 eV and 27.3 ± 0.3 eV.
Fig. 2. First differentiated ionization efficiency curves of NO+/N2O recorded at different retarding potential (VR)
settings. The vertical bars locate the onset energies.
3.2. The N2+ ions
The ion energy distribution.
First differentiated retarding potential curves of N2 +
ions are shown in fig. 4.
Near threshold and up to 80 eV electron energy, the kinetic energy distribution of the N2 +
ions is characterized by a smoothly shaped peak at thermal energy and broadened toward higher energies when increasing the impinging electron energy. For comparison the thermal energy distribution of N2O
+
has been inserted in fig. 4.
The ionization efficiency curves.
The first differentiated ionization efficiency curve of N2+/N2O is shown in fig. 5 as recorded for
different retarding potential settings. The onset energies are located by vertical bars. Two well defined onsets are measured at 17.32 ± 0.2 eV and at 20.36 ± 0.3 eV. From 0.2 V retarding potential, up to 2.5 V, the ionization efficiency curves exhibit a maximum which shifts from ≈28 eV to 34 eV electron energy.
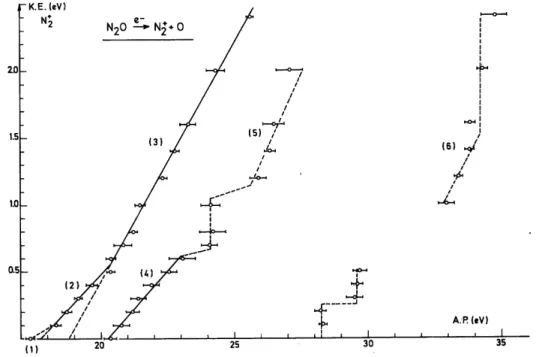
Measuring the onset energies for different retarding potential values a kinetic energy-versus-electron energy plot is obtained for N2+ and is shown in fig. 6.
Fig. 4. First differentiated retarding potential (VR)curves of N2+/N2O recorded at the indicated electron
4. Discussion
4.1. The NO+ dissociation channel
The first onset for the NO+ ion is measured at 15.29 ± 0.1 eV (see fig. 2), in very good agreement with the earliest electron impact value given by Smith [16], i.e. 15.3 ± 0.5 eV. The discrepancy with the measurement of Curran [19] at 13.75 ± 0.1 eV is noteworthy. By photoionization mass spectrometry, the threshold is measured at 14.97 eV [8] and 15.01 eV [4,5] or 15.03 eV [12].
The appearance energy of NO+ is ≈1 eV in excess with respect to the thermochemical threshold calculated for the lowest possible dissociation channel
which is at 14.19 eV, when using D(N-NO) = 4.93 eV [24] and IP(NO) = 9.26 eV [25].
In the energy range of 15 eV, the ground state 2Π of N2O +
is known to be stable, its first excited state Ã2Σ+ being at 16.39 eV [6].
From the present measurements the NO+ ions are known to be essentially thermal from threshold up to near 16 eV. A low intensity contribution of energetic ions of up to 200 meV is also present, i.e. 44/14 X 200 ≈ 630 meV in terms of total translational energy. In fig. 3 the threshold at 15.29 eV is shown to be constant up to a retarding potential of ≈200 meV. Such a situation has been observed earlier [26] for the proton formation in methane.
To account for the experimental data obtained in this work, the mechanism for the production of NO+ around 15 eV would be
where N2O is excited into a superexcited state N2O* which autoionizes to N2O+( 2Π) and predissociates. The
excess energy with respect to the dissociation limit at 14.19 eV is converted into translational and vibrational energy carried away by the fragments. The lower the translational energy involved in the dissociation process, the higher the internal energy of the NO+ ion, the total energy remaining constant.
In the energy range of the 2Π state of N2O +
, photoionization experiments [8] show the presence of several autoionization processes due to Rydberg series converging to the Ã2Σ+ state. Threshold photo-electron spectra recorded in the 15—16 eV region [11] show a large number of peaks which are ascribed to quasi resonant autoionization to 2Π in high vibrational levels. Threshold photoelectron—photoion coincidence experiments [12] evidenced NO+ ions resulting from the dissociative autoionization of high vibrationally excited levels of the N2O
+
( 2Π) state. In the same experiments, the NO+ time-of-flight peak indicates a narrow kinetic energy distribution, in agreement with the present results.
The products of the dissociation, i.e., NO+ (X1Σ+) and N(4S0), are only correlated with a 4Σ- state in the linear configuration of N2O
+
. This state is found to be repulsive in the Franck—Condon region [20] and would possibly predissociate the 2Π state in its upper vibrational levels.
In the NO+ threshold region a ndπ Rydberg series is observed and the 3dπ (1,0,0) member would be a possible candidate to produce the NO+ ion without kinetic energy. Taking 15.03 eV for the 3dπ (1,0,0) vibronic state, the excess energy with respect to the 14.19 eV dissociation limit is 0.84 eV which accounts for the formation of NO+ (X 1Σ+) in its υ = 3 level. A constant appearance energy being measured for the NO+ ions
carrying 0—630 meV total kinetic energy, the NO+ ions are distributed in the υ = 3,2 and 1 levels.
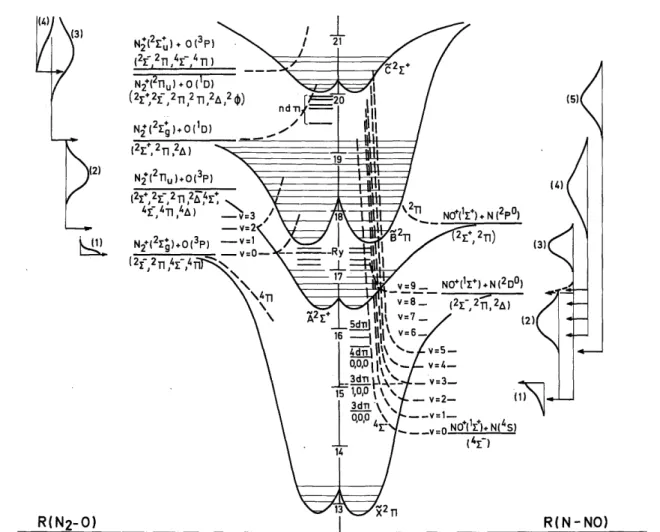
The above described situation is schematically drawn on the right hand side of the potential energy diagram of fig. 7.
From 0.2 to 0.6 eV, the NO+ ions kinetic energy shows a linear dependence upon the electron energy (segment 2 in fig. 3). The linear regression with five points gives a straight line with a slope of 0.27 and an appearance energy of 14.4 eV for NO+ carrying no kinetic energy. The theoretical slope is given by mN/mN2O =
14/44 = 0.32 and the extrapolation would be 14.2 eV when no internal energy is involved.
Fig. 5. First differentiated ionization efficiency curves of N2 +
/N20 recorded at different retarding potential
settings (VR).The vertical bars locate the onset energies.
Fig. 6. The kinetic energy-versus-appearance energy plot for the N2 +
Fig. 7. Schematic potential energy diagram of N2O along the two coordinates N-NO and N2-O. Threshold
energies and kinetic energy distributions are inserted.
To decide whether both experimental figures deviate significantly from the predicted values, the energy balance has to be made on the five appearance energies at the retarding potential settings of 0.2—0.6 eV. An average excess vibrational energy of 0.5 ± 0.1 eV is carried by NO+ which means that the slope of 0.27 is constant within experimental error and has to be considered close to 0.32. The deviation of the extrapolation from 14.2 eV indicates the formation of NO+(X 1Σ+) in a vibrationally excited state. The quantity of 0.5 ± 0.1 eV
would correspond to the υ = 2 level.
The NO+ (X1Σ+) ions formed in their υ = 2 level have to be formed by predissociation of the highest vibrational levels of the 2Π state through the 4Σ-state. These levels have to be populated by autoioniza-tion of superexcited states, e.g. higher members of Rydberg series [8] converging to the N2O
+
(Ã2Σ+) states. Some of these have been drawn in fig. 7 along the R (N—NO) coordinate.
In their threshold photoelectron—photoion coincidence experiment, Nenner et al. [12] do not mention energetic NO+ ions below 16.5 eV. This discrepancy could be interpreted by the fact that these NO+ ions are produced by dissociative autoionization where the autoionization step does not produce threshold photo-electrons (zero KE photo-electrons).
A second onset is measured at 16.9 ± 0.2 eV and its dependence on the ions kinetic energy is given by portion 3 in fig. 3.
From 17 eV electron energy, the kinetic energy distribution of NO+ shows a monotonic increase of its width (see fig. 1). The vertical dashed line [3] means that no appearance energy shift is observed before the retarding potential has reached the value of the minimum kinetic energy carried away by the ions. Furthermore, starting from 17 eV electron energy, no distinct thermal peak is observed in the translational energy distributions.
From the eight measurements of this onset between 0 and 0.8 eV kinetic energy, only two points are fairly well aligned on the prolonged straight line extrapolating at 14.4 eV with the slope of 0.27.
The threshold of 16.9 ± 0.2 eV is slightly higher, but close to the ionization potential of the Ã2Σ+ state of N2O+ which has its adiabatic ionization energy at 16.39 eV [6]. This observation would indicate the formation of
NO+ through the predissociation of N2O +
(Ã2Σ+) state through the 4Σ- state leading to the formation of NO+ by
The energy range covered by portion 3 is 16.9-17.8 eV. The photoelectron spectrum of the Ã2Σ+ state extends from 16.4 to 17 eV [6], The abovementioned interpretation could consequently only account for a part of the experimental results. A contribution of dissociative autoionization, e.g. by predissociaton of Rydberg series converging to the 2Π state of N2O
+
, will be responsible for these ions. This interpretation has been summarized in the potential energy diagram drawn in fig. 7.
The present interpretation agrees with the photo-ionization experiments [5,8]. By using the coincidence technique [9-12] it has been shown that the predissociation of the Ã2Σ+ starts from its 1,0,0 level at 16.55 eV. Brehm et al. [10] and Nenner et al. [12] observed a large amount of kinetic energy release. These authors interpreted the broad energy release distribution, as observed at 16.55 eV, by the superposition of discrete values of kinetic energies corresponding to the formation of NO+ (XlΣ+) in the υ = 0-8 levels. However, from the abovementioned arguments, the present experimental data show the formation of NO+ (X1Σ+) at most in the υ = 2 level, the remaining excess energy being converted into translational energy.
Although energetically allowed at 16.55 eV, no direct evidence is found for the presence of a competing dissociation channel, i.e.
at 16.58 eV [20]. This process would involve thermal and nearly thermal NO+ ions and is added in the diagram in fig. 7 by a dashed distribution curve. This process has mainly been evidenced by photodissociation of N2O
+
ion beams [13-15] and has been proposed by Brehm et al. [10].
The next threshold observed in the ionization efficiency curve of NO+ is at 17.6 ± 0.2 eV. This energy is close to the adiabatic ionization energy of the N2O+( 2Π), i.e. 17.45 eV [6]. The photoelectron band extends
over the energy range 17.5—19.2 eV.
The onset energy measured as a function of the NO+ ions kinetic energy extends from 17.6 to 19.25 eV and by linear regression the experimental data (see segment 4 in fig. 3) fit a straight line which extrapolates at 14.13 eV with a slope of 0.15. The last figure has to be compared with the theoretical slope of 0.32 obtained by considering the excess energy entirely converted into translational energy. The discrepancy has to be interpreted by the conversion of the excess energy into both translational and internal energy carried by the NO+ ion.
The close agreement between the onset at 17.6 eV and the ionization energy of the 2Π state of N2O +
strongly suggests to interprete the formation of NO+ at this energy by the predissociation of the 2Π state from its lowest vibrational level. This predissociation has to occur via the 4Σ- state which is correlated with the dissociation limit at 14.2 eV. Furthermore the energy balance, calculated by using the threshold energies measured between 0.5 and 0.8 eV released kinetic energy, allows to show the formation of NO+ (X1Σ+) ions in their vibrational levels υ = 6-9, i.e.
As the abovementioned reaction is the most straightforward interpretation, contributions of autoionizing states, e.g. Rydberg states converging to the 2Σ+ state of N
2O+, cannot be definitely discarded.
Berkowitz and Eland [8] notice a steady rise in photoion yield of NO+ over the 2Π state's Franck-Condon region, as observed in the present work. They interprete the dissociation of N2O+ by the dissociation
path
on the basis of photoabsorption [13] and photoion— photoelectron coincidence results [10]. The corresponding dissociation limit is calculated at 16.58 eV. This value is definitely different from our extrapolated value of 14.1 eV. No detailed interpretation is given in the threshold photoelectron—photoion coincidence work [12].
At 19.3 ± 0.2 eV, the kinetic energy-versus-appear-ance energy plot shows a sudden break indicating the opening of a new dissociation channel leading to the formation of NO+ ions (see portion 5 in fig. 3).
This energy corresponds to the end of the 2Π photoelectron band. In the photoionization efficiency curve of N2O+ [8], a series of autoionization peaks starts around 19.13 eV and 19.25 eV. Both structures are
observed in the NO+ photoion yield curve.
From photoelectron spectroscopy with the He (I) resonance line [6] and photoionization [8], the adia-batic ionization energy of the N2O
+
( 2Σ+) state is measured at 20.105 eV. In their He(II) photoelectron spectrum Potts and Williams [7] observed a doubly excited state of N2O+ around 19.5 eV.
Even when the errors on the onset energy measurements are fairly large, due to the shape of the first differentiated ionization efficiency curve, the experimental points, measured between 1.3 and 1.5 eV NO+ ions kinetic energy, fit fairly well the prolonged straight line which extrapolates to 14.4 eV with a slope of 0.27 (segment 5 in fig. 3).
These results lead to conclude that the NO+ ions observed from 19.3 to 20.5 eV electron energy are formed through predissociation of superexcited states and/or the 2Σ+ ionic state. This process would occur through the 4Σ- state correlated with NO+(X 1Σ+) + N(4S) at 14.2 eV. The NO+ ions carry 1.3-1.5 eV kinetic energy in this reaction. The energy balance indicates that NO + (X1Σ+) ions formed in their υ = 4 level,
Scarce are the results concerning this process as obtained in other experiments. Photoelectron [10] and threshold photoelectron—photoion [12] coincidence experiments show the 2Σ+ state fully predissociated. Most of the NO+ ions have low kinetic energy releases, in contrast with the results of the present work where all the NO+ ions carry at least 3.9 eV total kinetic energy.
A possible explanation for the apparent discrepancy would be the difficulty to observe a threshold in the 19—20 eV electron energy range. This difficulty could arise from the shape of the ionization efficiency curve of NO+ in this energy range. At low retarding potential (see fig. 2) the phenomena around 20 eV could be masked by the lower energetic dissociative ionization events.
From 0.7 eV kinetic energy, the first differentiated ionization efficiency curve of NO+ shows a new process with a well defined onset at 27.3 ± 0.3 eV. Below 0.7 eV this onset is not observable.
The present experiments were not extended over 1.5 eV kinetic energy, the NO+ signal being of to low intensity Consequently we are not able to deduce from our data the dissociation limit involved in this process.
It is noteworthy to mention that at these energies only doubly excited states of N2O +
are probably involved. Their energies are known from He(II) photoelectron spectroscopy [7] and (e,2e) coincidence spectroscopy [27]. Several peak maxima are observed between 22.6 and 37.3 eV.
4.2. The N2 +
dissociation channel
The first onset observed in the first differentiated ionization efficiency curve of N2 +
is measured at 17.32 ± 0.2 eV (see fig. 5). This value is in close agreement with the photoionization mass spectrometric determination of 17.27 eV [4] and 17.34 eV [8]. By dissociative electroionization, Curran [19] measured 17.0 ± 0.2 eV. The appearance energy of N2+ lies in the Franck—Condon gap 17.1—17.45 eV between the Ã2Σ+ and 2Π states of
N2O +
[6].
In the kinetic energy-versus-appearance energy plot, this threshold is defined for one retarding potential setting (see segment 1 in fig. 6) and corresponds to thermal energy N2
+
ions. The dissociation channel leading to N2+ would be:
for which a threshold at 17.26 eV is calculated [20]. Two different paths are open, i.e. (i) dissociation of N2O
+
( 2Π) state; its dissociation limit could be populated via autoionization, or (ii) predissociation of highly excited vibrational levels of N2O
+
(Ã2Σ+) populated by autoionization. In both cases Rydberg states converging to the 2Σ+ state of N2O
+
have to be involved. This has schematically been drawn in fig. 7.
By photoionization mass spectrometry [8], one observes the N2 +
ion yield to be modulated by the autoionization fine structure due to Rydberg series converging to the N2O+( 2Π) state. Threshold
photoelec-tron—photoion coincidence experiments [12] give no detail in this energy range.
From 0.1 to 0.5 eV N2 +
ions kinetic energy, the threshold measurements fit a straight line which extrapolates at 17.7 eV and has a slope of 0.21 (see portion 2 in fig. 6). This last figure has to be compared with the theoretical slope m0/mN2O
=
16/44 = 0.36 calculated under the assumption of total conversion of the excess energy into translational energy. The difference between predicted and experimental slopes indicates the partial conversion of the excess energy into internal energy of the diatomic fragment N2
+
.
The straight line extends from the first measured onset at 18.27 eV to «20.0 eV. This energy range covers the Franck—Condon region of the N2O
+
( 2Σ+) state which extends from 17.45 to 19.2 eV [6]. The energy balance, using the present translational and appearance energy measurements, shows N2
+
(X2Σg +
) to be formed in its υ = 2 to υ = 4 levels.
The decay channel open at 18.27 eV, produce N2+ ions through predissociation of the N2O+ ( 2Π) state
i.e.
In this energy range the dissociative autoionization could not be discarded. This mechanism has to be invoked at least for the dissociative ionization occurring between 19.5 and 20.0 eV.
The decomposition of the 2Π state of N2O+ is observed by photon impact experiments [8]. From
Extending over a wide N2+ ions translational energy range, i.e. 0.8—2.5 eV, fig. 6, segment 3 shows a
straight line with a slope of 0.38 or 0.35 and extrapolated at 19.1 or 18.8 eV, respectively. The two figures are obtained by taking into account or discarding the experimental points obtained at 0.5 and 0.6 eV kinetic energy.
Considering the accuracy on the threshold determinations, the slopes are close to the predicted value of 0.36 and it can be deduced that over the entire energy range 19.5—25 eV the total excess energy is converted into translational energy of the fragments.
For the dissociation limit involved in the dissociation in the abovementioned energy range, two decay channels are open
at 18.35 and 19.20 eV, respectively [20].
The energy balance made for each measured threshold gives an average value of 19.1 ± 0.2 eV and both extrapolated values, 18.8 and 19.1 eV strongly favour the last dissociation channel,
where N2+(X 2Σg+) are formed without vibrational energy and carry at least 0.5-0.7 eV kinetic energy at the onset.
This would correspond to N2 +
ions formation by predissociation of the N2O +
( 2Σ+) state.
By photoionization mass spectrometry between 19.2—20.6 eV [8] the N2 +
ion yield shows autoioniza-tion structures due to Rydberg series converging to the N2O
+
( 2Σ+) state as well as a stepwise increase of the N2
ion current around 20 eV which corresponds to the ionization energy of the 2Σ+ state. By photo-electron— photoion coincidence [10] the predissociation of the 2Σ+ state is also observed.
The dissociative electroionization phenomena observed at higher energies, i.e., up to 25.5 eV for portion 3 in fig. 6, have to be ascribed to dissociations involving higher excited states of the N2O
+
, probably those observed in the He(II) photpelectron spectrum and by (e, 2e) coincidence spectrometry.
The second onset measured in the first differentiated ionization efficiency curve is found to be 20.36 ± 0.3 eV. The kinetic energy-versus-onset energy plot related to this process is shown by segment 4 in fig. 6. This portion extends from 20.36 to 24.1 eV. All the dissociative electroionization phenomena involved in this energy range occur to the same dissociation limit.
The linear regression applied to these experimental data gives a straight line extrapolated at 20.26 eV with a slope of 0.22. The energetic value is close to the experimental value and corresponds fairly well to the ionization energy of the 2Σ+ state. At threshold these N2+ ions have to be formed without kinetic energy.
The difference between experimental (0.22) and predicted (0.36) slopes implies the partial conversion of the excess energy into vibrational excitation of the diatomic fragment N2
+
.
To interprete the N2O dissociation around 20.3 eV two channels are open at about the same energy
i.e. 20.42 eV and 20.34 eV [20], lying less than 0.1 eV, apart. It is actually not possible, within the accuracy allowed by electroionization, to discriminate between these two dissociation channels.
From the present experimental data we can infer that the dissociative electroionization around 20.3 eV has to occur at threshold through predissociation of the 2Σ+ state leading to N2
+
internal energy. At higher energies the excess energy is converted into translational energy (0—1.65 eV total kinetic energy) and vibrational energy (υ = 0 to υ = 4). _
Outside the Franck-Condon region of the 2Σ+ state, the N2 +
ions have to be formed by direct transition to the same repulsive state converging to 20.3 eV and/or predissociation of higher lying excited states of N2O+.
The segment 5 of the kinetic energy-versus-threshold energy plot (see fig. 6) shows four experimental points fairly well aligned along a straight line with the theoretical slope of 0.36. It extrapolates between 22 and 23 eV. The minimum kinetic energy carried by N2
+
is of 1.2 eV for the threshold at 25.9 eV. No internal energy being involved in these dissociation processes, the threshold for the N2
+
ions carrying no translational energy would be at 22.3 eV. Taking into account the precision on the onset energy measurements, two dissociation channels are possible,
calculated at 22.39 eV and 22.56 eV respectively, using IP(N2, A 2 Πu) = 16.693 eV and IP(N2, B 2 Σu + ) = 18.745 eV [28] and O(1D) = 1.967 eV [29] and O(1S) = 4.189 eV [29].
The energy range of 25.9—27.5 eV covers the region where many electron transitions have been observed in the studies of N2O by (e,2e) coincidence spectroscopy [27] as well as by photoelectron spectroscopy
with the He (II) resonance line [7].
The first differentiated ionization efficiency curve shows a fairly broad maximum for which the position in energy changes with the retarding potential setting (see fig. 5). This observation has been added in fig. 6, portion 6 of the diagram. In that energy range, i.e. 32—35 eV we are probably dealing with dissociative autoionization involving superexcited states converging to doubly excited states of N2O
+
. The lack of information on these states does not allow a more detailed interpretation.
5. Conclusions
The dissociative electroionization of N2O has been examined in detail, using ions translational energy
analysis, for both decay channels leading to NO+ and N2+ fragment ions under the impact of electrons in a wide
energy range.
In the first dissociation channel, only one dissociation limit is involved, corresponding to the production of NO+ and N in their ground electronic state. Only one ionic state of N2O+ is correlated with these products, i.e. 4
Σ- which is responsible for all the dissociation phenomena observed in this work. The predissociation of the successive ionic states of N2O
+
and autoionization to predissociated ion states of N2O is the predominant
mechanism. The formation of vibrationally excited NO+ in their ground electronic state is evidenced.
In the N2+ dissociation channel, several dissociation limits are involved and this decay path is also
dominated by the predissociation of the Ã2Σ+, 2Π and 2Σ+ states of N2O+ and autoionizing states of N2O. For
the 2Σ+ state two decay channels are observed.
At energies above 21.2 eV, doubly excited electronic configurations of N2O +
play certainly a significant role.
Acknowledgement
We wish to thank the University of Liège, the Fonds de la Recherche Fondamentale Collective (F.R.F.C.) and the Action de Recherche Concertée (A.R.C.) for their financial support to our laboratory. One of us (J.L.O.) acknowledges the A.R.C. for a grant.
References
[2] J.H. Callomon, Proc. Chem. Soc. London (1959) 313.
[3] G.R. Cook, P.H. Metzger and H. Ogawa, J. Opt. Soc. Am. 58 (1968) 129. [4] V.H. Dibeler, J.A. Walker and S.K. Liston, J. Res. NBS 71A (1967) 371.
[5] P. Coppens, J. Smets, M.G. Fishel and J. Drowart, Int. J. Mass Spectrom. Ion Phys. 14 (1974) 57. [6] P.M. Dehmer, J.L. Dehmer and W.A. Chupka, J. Chem. Phys. 73 (1980) 126.
[7] A.W. Potts and T.A. Williams, J. Electron Spectry. Rel. Phenom. 3 (1974) 3. [8] J. Berkowitz and J.H.D. Eland, J. Chem. Phys. 67 (1977) 2740.
[9] J.H.D. Eland, Int. J. Mass Spectrom. Ion Phys. 12 (1973) 389.
[10] B. Brehm, R. Frey, A. Küstler and J.H.D. Eland, Int. J. Mass Spectrom. Ion Phys. 13 (1974) 251.
[11] T. Baer, P.M. Guyon, I. Nenner, A. Tabche-Fouhaille, R. Botter, L.F.A. Ferreira and T.R. Govers, J. Chem. Phys. 70 (1979) 1585. [12] I. Nenner, P.M. Guyon, T. Baer and T.R. Govers, J. Chem. Phys. 72 (1980) 6587.
[13] R.G. Orth and R.C. Dunbar, J. Chem. Phys. 66 (1977) 1616. [14] T.F. Thomas, F. Dale and J.F. Paulson, J. Chem. Phys. 67 (1977) 793.
[15] M. Larzilliere, M. Carre, M.L. Gaillard, J. Rostas, M. Horani and M. Velghe, J. Chim. Phys. 77 (1980) 689. [16] H.D. Smith, Revs. Mod. Phys. 3 (1931) 347.
[17] J. Collin and F.P. Lossing, J. Chem. Phys. 28 (1958) 900. [18] F.J. Dorman, J. Chem. Phys. 43 (1965) 3507.
[19] R.K. Curran and R.E. Fox, J. Chem. Phys. 34 (1961) 1590.
[20] J.C. Lorquet and C. Cadet, Int. J. Mass Spectrom. Ion Phys. 7 (1971) 245.
[21] D.G. Hopper, Chem. Phys. Letters 31 (1975) 446; J. Am. Chem. Soc. 100 (1978) 1019; J. Chem. Phys. 72 (1980) 3679. [22] J.A. Beswick and M. Horani, Chem. Phys. Letters 78 (1981) 4.
[23] R. Locht and J. Schopman, Int. J. Mass Spectrom. Ion Phys. 15 (1974) 361.
[24] G. Herzberg, Molecular spectra and molecular structure, Vol. 3. Electronic spectra and electronic structure of polyatomic molecules (Van Nostrand, Princeton, 1967).
[25] P. Natalis, J.E. Collin, J. Delwiche, G. Caprace and M.J. Hubin, J. Electron Spectry. Rel. Phenom. 17 (1979) 421. [26] R. Locht, J.L. Olivier and J. Momigny, Chem. Phys. 43 (1979) 425.
[27] C.E. Brion and K.H. Tan, Chem. Phys. 34 (1978) 141.
[28] A. Lofthus and P.H. Krupenie, Phys. Chem. Ref. Data 6 (1977) 113. [29] C.E. Moore, Atomic Energy Levels, Vol. 1, NBS 467 Circ. (1949).