Prognostic impact of electrocardiographic signs in patients with Type 2
diabetes and cardiovascular disease: results from the PROactive study
R. Pfister, R. Cairns*, E. Erdmann and C. A. Schneider on behalf of the PROactive investigators
Department III of Internal Medicine, Herzzentrum, University of Cologne, Germany and *Worldwide Clinical Trials, Isaac Newton Centre, Nottingham, UK
Abstract
Aims Although a resting electrocardiograph is broadly applied in clinical practice for evaluating patients with
Type 2 diabetes and cardiovascular disease, the independent prognostic relevance of electrocardiographic signs has not thoroughly been examined.
Methods Baseline 12-lead electrocardiographs available in 5231 of the 5238 participants of the PROactive trial
were analysed for heart rate, heart rate corrected QT-interval, presence of atrial fibrillation/flutter, left axis deviation, right and left bundle branch block. The association of electrocardiographic signs with total mortality, the principal secondary composite endpoint (death, myocardial infarction and stroke) and serious adverse heart failure events was examined by Cox-regression analysis.
Results Two hundred and twenty-three (4.3%) patients showed atrial fibrillation/flutter, 213 (4.1%) patients had
right bundle branch block, 111 (2.1%) patients had left bundle branch block and 706 (13.5%) patients had left axis deviation. Mean cQT-interval was 418 ms (± 25 ms) and mean heart rate was 72/min (± 14/min). In multivariate adjusted analyses, heart rate and cQT-interval were significantly associated with mortality, the composite secondary endpoint and heart failure, whereas right and left bundle branch blocks were significantly associated with heart failure only. Left axis deviation was associated with heart failure and atrial
fibrillation/flutter was associated with mortality and heart failure in univariate but not multivariate analyses.
Conclusion Easily assessable electrocardiographic signs such as heart rate, cQT-interval and bundle branch
blocks were predictive for adverse outcome independently of multiple risk factor adjustment and should be considered in clinical care.
Keywords : atrial fibrillation ; bundle branch block ; diabetes ; heart rate ; QT-interval
Introduction
A resting 12-lead electrocardiograph (ECG) is a commonly applied tool to evaluate patients with cardiovascular disease for signs of myocardial ischaemia. In patients with diabetes mellitus, a variety of abnormal ECG signs have been described, not only resulting from ischaemia [1]. So far there are only few studies addressing the prognostic role of ECG signs in diabetes-specific populations and no studies focusing merely on patients with diabetes and manifest cardiovascular disease. There are, however, several reasons for examining this population separately. Diabetes itself is a strong predictor of several ECG signs such as QT-interval or atrial fibrillation, which partly explains their prognostic relevance [2,3]. On the one hand, diabetes-related risk factors such as hypertension, coronary ischaemia or proteinuria are also associated with ECG alterations [1,4]. An independent prognostic effect of these ECG signs is therefore questionable after adequate adjustment. On the other hand, diabetes-specific co-morbidity such as autonomic neuropathy can influence ECG signs such as heart rate or QT-interval, thereby modifying their prognostic impact [5,6]. Finally, patients with diabetes and manifest
cardiovascular disease undergo an extensive characterization in terms of patient history and laboratory risk factors on a routine basis and it is unclear whether ECG signs add independent information.
Earlier studies on patients with diabetes (e.g. evaluating the role of QT-interval) have the limitation of small and heterogeneous samples, combining patients with and without prevalent cardiovascular disease, which does not give reliable estimates for either patient group and even leads to contradictory results [7-10]. Here, we report an
analysis of the PROactive trial that examines the prognostic relevance of the following ECG signs: resting heart rate, corrected QT-interval (cQT), atrial fibrillation/flutter, left axis deviation and right as well as left bundle brunch block for the outcome of total mortality, the composite secondary endpoint (including first event of mortality, myocardial infarction and stroke) and serious heart failure.
Patients and methods
PROactive is a multi-center double-blind placebo-controlled cardiovascular outcomes trial, which has previously been described in detail [11,12]. Briefly, 5238 patients who had Type 2 diabetes (aged 35-75 years) and had documented evidence of cardiovascular disease (defined as one or more of the following: myocardial infarction, stroke, percutaneous coronary intervention, or coronary artery bypass graft ≥ 6 months before entry into the study; acute coronary syndrome ≥ 3 months before entry into the study; objective evidence of coronary artery disease; or symptomatic peripheral arterial obstructive disease) were recruited. Patients with New York Heart Association Class II-IV heart failure at screening were excluded. Patients were randomly assigned to receive pioglitazone (n = 2605) or matching placebo (n = 2633) in addition to their existing guideline-directed glucose-lowering and cardiovascular medications. All patients provided written informed consent. The study protocol was approved by local and national ethics committees and regulatory agencies and was conducted in accordance with the Declaration of Helsinki and Good Clinical Practice guidelines.
Endpoints
This analysis is restricted to all-cause mortality, the pre-specified principal secondary composite endpoint (time to the first event of all-cause mortality, myocardial infarction and stroke) and serious heart failure. The definition of non-fatal myocardial infarction was survival for > 24 h from onset of symptoms and, in the absence of percutaneous coronary intervention or coronary artery bypass surgery, at least two of the following: (i) symptoms suggestive of myocardial infarction (ischaemic chest pain or discomfort) lasting > 30 min; (ii) ECG evidence of myocardial infarction; or (iii) elevation of cardiac serum markers, or following percutaneous coronary intervention or coronary artery bypass surgery if there was ECG evidence of myocardial infarction. All potential endpoint events were adjudicated centrally by an independent committee of clinical experts. Heart failure was a pre-specified as either a serious or non-serious adverse event. Because of missing standardized, objective criteria in the study design for distinguishing non-serious heart failure from oedema alone, this analysis is restricted to serious heart failure events. These were defined as that which requires hospitalization or
prolongation of a hospitalization stay, was fatal or life-threatening, or resulted in persistent significant disability or incapacity. Details on the definition and adjudication of serious events have previously been published [12].
Procedures
Blood samples for various analyses were taken at baseline and every 6 months. Details of assays and specific methodology have previously been described [12]. Standard 12-lead ECGs were obtained at baseline, at yearly intervals and at the last visit. All available baseline ECGs were analysed by an experienced cardiologist, who was blinded to patient characteristics after the study was finished. The following variables were assessed according to recent recommendations [13,14]: heart rate (/min), pacemaker rhythm, right and left bundle branch block, left axis deviation, atrial fibrillation or flutter and QT-interval duration. QT-interval duration was measured manually in lead V2 or V3 because of a high rate of ECGs without automatic digital analysis. The QT-interval was corrected for heart rate by the Framingham formula [15]: cQT = QT + 154 × (1-60/heart rate), as previously described and recommended. Tachycardia was defined as heart rate > 100/min, while bradycardia was defined as heart rate < 50/min. Short QT interval was defined if cQT ≤ 390 ms, while long QT interval was defined as cQT ≥ 450 ms and cQT ≥ 460 ms in men and women, respectively.
Statistical analysis
Statistical methods used for the sample size calculation and endpoint analysis for PROactive have previously been reported [12]. The data presented here are from the intention-to-treat population. Continuous variables are presented as mean and standard deviation and categorical variables as number and percentage. Time-to-event analyses were performed by fitting a Cox proportional hazards survival model with pre-specified ECG signs as covariates. Multivariate Cox models were used to test the independent effect of ECG signs; variable selection was carried out using a backward stepwise selection algorithm at a significance level of 0.05, with the following variables initially included in addition to ECG signs: age, gender, diabetes duration, smoking status, presence of metabolic syndrome (defined by criteria of the Adult Treatment Panel III of the National Cholesterol Education Program), baseline measures of combined blood pressure, creatinine, HbA1c, LDL cholesterol, HDL cholesterol,
triglycerides, body mass index and microalbuminuria, history of coronary artery disease, acute coronary syndrome, percutaneous coronary intervention/bypass surgery, stroke and myocardial infarction, peripheral arterial occlusive disease, baseline use of insulin, metformin and sulphonylurea, diuretics, statins, beta-blocker and ACE inhibitor and pioglitazone treatment.
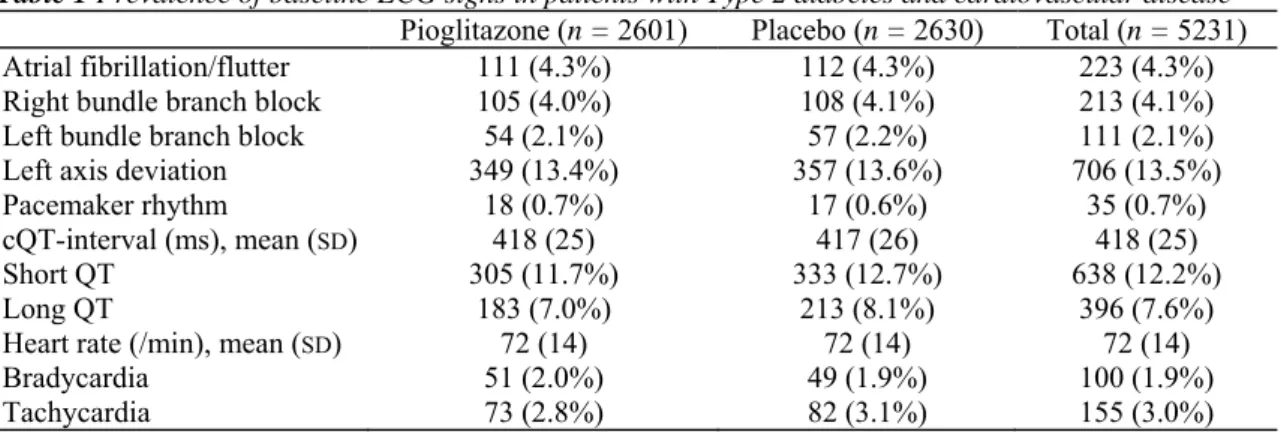
Table 1 Prevalence of baseline ECG signs in patients with Type 2 diabetes and cardiovascular disease Pioglitazone (n = 2601) Placebo (n = 2630) Total (n = 5231)
Atrial fibrillation/flutter 111 (4.3%) 112 (4.3%) 223 (4.3%)
Right bundle branch block 105 (4.0%) 108 (4.1%) 213 (4.1%)
Left bundle branch block 54 (2.1%) 57 (2.2%) 111 (2.1%)
Left axis deviation 349 (13.4%) 357 (13.6%) 706 (13.5%)
Pacemaker rhythm 18 (0.7%) 17 (0.6%) 35 (0.7%)
cQT-interval (ms), mean (SD) 418 (25) 417 (26) 418 (25)
Short QT 305 (11.7%) 333 (12.7%) 638 (12.2%)
Long QT 183 (7.0%) 213 (8.1%) 396 (7.6%)
Heart rate (/min), mean (SD) 72 (14) 72 (14) 72 (14)
Bradycardia 51 (2.0%) 49 (1.9%) 100 (1.9%)
Tachycardia 73 (2.8%) 82 (3.1%) 155 (3.0%)
Results
Baseline characteristics of the study patients have been extensively described previously [11,12]. Briefly, 66.1% of the 523 8 patients were male, the mean age was 62 years (± 8 years), the mean duration of diabetes was 9.5 years (± 7 years), 94.7% had known cardiovascular disease, 46.7% had previous myocardial infarction and 21.8% had known cerebrovascular disease. Baseline ECGs were available in 2601 of 2605 (99.8%) patients in the treatment group and in 2630 of 2633 (99.9%) patients in the placebo group. Findings of the baseline ECGs are shown in Table 1.
Univariate association of ECG signs with mortality, the secondary composite endpoint and heart failure is shown in Fig. 1 and Table 2. Patients with baseline pacemaker rhythm were excluded from all analyses except for isolated atrial fibrillation/flutter. Increasing heart rate, increasing QT-interval, atrial fibrillation/flutter and left bundle branch block were significantly associated with increased mortality risk. Increasing heart rate, increasing QT-interval and left bundle branch block were significantly associated with an increased risk for the secondary composite endpoint. Only heart rate was significantly associated with both individual secondary endpoints of myocardial infarction [hazard ratio (HR) 1.11 per 10/min, 95% CI 1.01-1.21, P = 0.04] and stroke (HR 1.11 per 10/min, 95% CI 1.01-1.22, P = 0.04), while atrial fibrillation/ flutter was significantly associated with stroke (HR 1.92, 95% CI 1.13-3.25, P = 0.02). Increasing heart rate, increasing QT-interval, atrial fibrillation/flutter, right bundle branch block, left axis deviation and left bundle branch block were significantly associated with heart failure.
Beta-blockers influence heart rate and the cQT-interval and may also affect outcome. Adjustment for beta-blocker use did not attenuate the risk associated with heart rate and cQT-interval (Table 2). There was no evidence for interaction between heart rate or cQT-interval and beta-blocker use at baseline (test for interaction: all P > 0.18).
The independent prognostic effect of the ECG signs was tested in multivariate Cox models with stepwise backward elimination. Table 3 shows the ECG signs significantly associated with outcome in the final models. Heart rate and cQT-interval were significantly associated with mortality and the composite secondary endpoint. Heart rate, cQT-interval, right bundle branch block and left bundle branch block were significantly associated with serious heart failure.
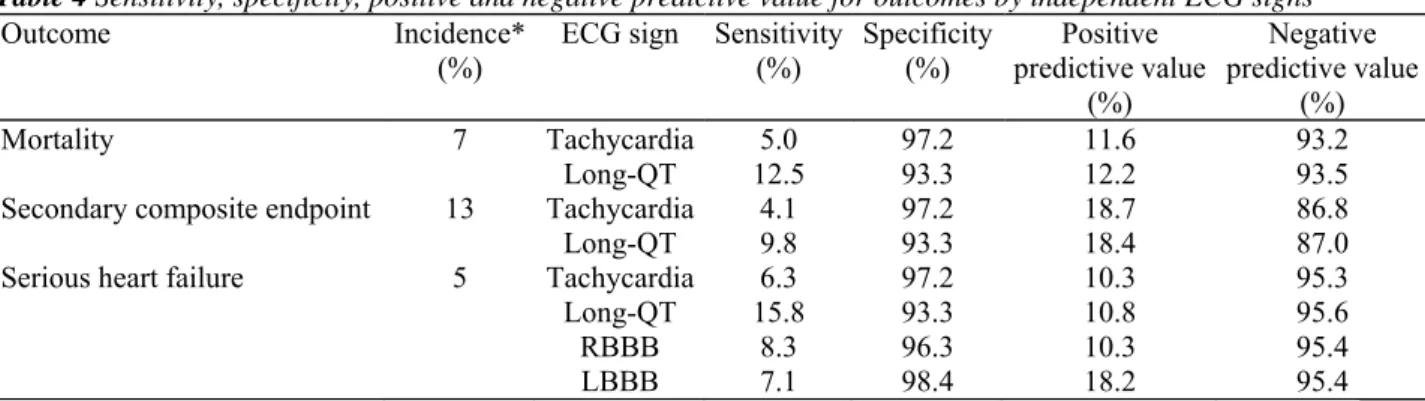
Table 4 shows the predictive characteristics of the ECG signs, which proved a significant association with particular outcomes independently of known risk factors, corresponding to Table 3. Consistently, all ECG signs had weak sensitivity, but very high specificity and high negative predictive value.
Discussion
We found that easily assessable ECG signs are independently predictive for adverse outcome in patients with diabetes and known cardiovascular disease after adjusting for multiple risk markers that are routinely assessed. Heart rate and cQT-interval were associated with total mortality and the composite endpoint of mortality, myocardial infarction and stroke. Heart rate, cQT-interval, right and left bundle branch blocks were associated with heart failure. These ECG signs particularly showed high specificity for adverse outcomes, but limited sensitivity. Atrial fibrillation/flutter was not a significant predictor of outcome in adjusted analyses. In contrast to our results in a recent analysis of the ADVANCE trial, baseline atrial fibrillation was robustly related to mortality and cerebrovascular events as well as heart failure in patients with diabetes after multivariate adjustment [16]. One explanation is the more than doubled frequency of oral anticoagulants in our atrial
fibrillation group compared with ADVANCE, which is expected to attenuate the rate of cardiovascular outcomes in particular. In addition, the exclusion of symptomatic heart failure in PROactive might be a major reason for the clearly lower baseline frequency of atrial fibrillation (4.3% compared with 7.6% in ADVANCE) despite a higher rate of cardiovascular co-morbidity. Heart failure is associated with an increased risk of atrial fibrillation [17] and, conversely, atrial fibrillation can be used as a surrogate marker of heart failure. It can be expected that atrial fibrillation is a more accurate marker than 'history of hospitalization for heart failure', which was the only heart-failure-indicating covariate in the multivariate analysis of ADVANCE. Hence, differences in the study population may be responsible for the contrary results on the independent prognostic role of atrial fibrillation, underscoring the necessity of clearly defined populations to derive risk markers.
We confirm previous results on the association of heart rate and cardiovascular outcome in patients with diabetes [7-9] and further extend these to an independent prediction of heart failure. So far, heart rate as a predictor of heart failure has only been described in population-based approaches [18,19]. Important to note, heart rate is discussed not only as a marker that indicates increased risk but that also might causally contribute to the development or progression of cardiovascular disease [20]. Experimental data indicate that the increased magnitude and frequency of shear and tensile stress, which is associated with high heart rate, can promote the pathogenesis of atherosclerosis [21]. This is of special interest for patients with diabetes as diabetic neuropathy is associated with tachycardia.
In our study, left and right bundle branch blocks were both predictive for heart failure, but not mortality or cardiovascular outcomes, in multivariate analysis. In the HOPE trial, which included approximately 38% high-risk patients with diabetes also excluding manifest heart failure, left bundle branch block was associated with total and cardiovascular mortality and most robustly with heart failure, while right bundle branch block was related to neither of the outcomes [22]. Thus, our findings are in concordance with HOPE in terms of left bundle branch block being mainly a marker of occult cardiac dysfunction predictive for heart failure-associated
outcomes. The discrepancy regarding rightt bundle branch block could be attributed to a diabetes-specific association. In a population-based study, Jeong et al. found diabetes to be a determinant of right bundle branch block, whereas cardiac disease was a determinant of left bundle branch block [23].
To the best of our knowledge, we present the largest analysis on the impact of cQT-interval in a diabetes-specific population with manifest cardiovascular disease. We confirm findings of some reports on the association of cQT-interval with total mortality and cardiovascular outcomes. As an important novelty, we found a predictive impact of increasing cQT-interval for heart failure. The cQT-interval was shown to be strongly correlated with coronary heart disease and left-ventricular hypertrophy in patients with diabetes, which both are known predictors of heart failure [24]. cQT-interval was also inversely related to the severity of disease within heart failure patients [25]. Accordingly, cQT-interval can contribute to the prediction of heart failure both by association with known risk factors and by indicating occult cardiac dysfunction.
The strong and independent prognostic impact of ECG signs, especially in terms of future heart failure events, raises the question about clinical implications. Heart failure is currently of particular interest in patients with diabetes and thiazolidinedione therapy, as these drugs are associated with a significant increase in heart failure exacerbation [26]. Simple clinical markers indicating increased risk for heart failure are needed to identify patients who need close monitoring. Because of the low sensitivity, ECG signs are obviously not suitable as 'standalone' markers for screening of high-risk patients. However, the high specificity suggests that detection of tachycardia, long cQT-interval or bundle branch blocks might alert physicians to increased risk for adverse outcomes such as heart failure. The limited positive predictive value found in our population is in part attributable to the low rate of adverse outcomes (5-13%), and can be improved by combining ECG with other risk markers, thus increasing pre-test probability for adverse outcomes.
FIGURE 1 Univariate analysis of ECG signs for prediction of outcomes (*P < 0.05, †P < 0.01, ‡P < 0.001). A.
fib: artrial fibrillation; LAD: leftaxis deviation; LBBB: left bundle branch block; RBBB: right bundle branch block.
Table 2 Prediction of outcomes by heart rate and cQT-interval with and without adjustment for beta-blocker use
in patients with Type 2 diabetes and cardiovascular disease
Unadjusted Adjusted for beta-blocker use
ECG sign Outcome Hazard ratio (95% CI) P-value Hazard ratio (95% CI) P-value
Heart rate Mortality 1.23 (1.15-1.31) < 0.0001 1.20 (1.12-1.29) < 0.0001
Secondary composite
endpoint 1.16 (1.10-1.22) < 0.0001 1.15 (1.09-1.21) < 0.0001 Serious heart failure 1.30 (1.20-1.40) < 0.0001 1.31 (1.21-1.41) < 0.0001
cQT interval Mortality 1.11 (1.07-1.16) < 0.0001 1.12 (1.07-1.16) < 0.0001
Secondary composite
endpoint 1.06 (1.03-1.09) 0.0002 1.06 (1.03-1.09) 0.0002
Table 3 Multivariate analysis of ECG signs for prediction of outcomes in patients with Type 2 diabetes and
cardiovascular disease
Mortality* Secondary composite endpoint† Serious heart failure‡
Hazard ratio (95% CI) P-value Hazard ratio (95% CI) P-value Hazard ratio (95% CI) P-value Heart rate (per 10/min) 1.20 (1.11-1.29) < 0.001 1.13 (1.07-1.19) < 0.001 1.29 (1.19-1.40) < 0.001 cQT-interval (per 10 ms) 1.11 (1.07-1.16) < 0.001 1.06 (1.03-1.09) < 0.001 1.06 (1.01-1.12) 0.03
RBBB NS NS 1.91 (1.16-3.12) 0.01
LBBB NS NS 2.28 (1.3-3.99) 0.004
*Final model included in addition to ECG signs: age, creatinine, duration of diabetes, HbA1c, history of myocardial infarction, percutaneous
coronary intervention/bypass surgery, peripheral arterial obstructive disease, stroke, use of diuretics.
†Final model included in addition to ECG signs: age, micralbuminuria, body mass index, creatinine, duration of diabetes, HbA
1c, history of
myocardial infarction, percutaneous coronary intervention/bypass surgery, peripheral arterial obstructive disease, stroke, pioglitazone treatment, smoking status, statin use, triglycerides, use of diuretics.
‡Final model included in addition to ECG signs: age, micralbuminuria, creatinine, duration of diabetes, HbA
1c, LDL cholesterol, history of
myocardial infarction, pioglitazone treatment, use of diuretics.
LBBB, left bundle branch block; NS, not significant; RBBB, right bundle branch block.
Table 4 Sensitivity, specificity, positive and negative predictive value for outcomes by independent ECG signs
Outcome Incidence*
(%) ECG sign Sensitivity (%) Specificity (%) predictive value Positive (%) Negative predictive value (%) Mortality 7 Tachycardia 5.0 97.2 11.6 93.2 Long-QT 12.5 93.3 12.2 93.5
Secondary composite endpoint 13 Tachycardia 4.1 97.2 18.7 86.8
Long-QT 9.8 93.3 18.4 87.0
Serious heart failure 5 Tachycardia 6.3 97.2 10.3 95.3
Long-QT 15.8 93.3 10.8 95.6
RBBB 8.3 96.3 10.3 95.4
LBBB 7.1 98.4 18.2 95.4
* Calculated per study follow-up time.
LBBB, left bundle branch block; RBBB, right bundle branch block.
There are some limitations of our study that need to be addressed. There are plenty of other ECG signs described in the literature to be associated with prognosis such as QT-dispersion, indices of myocardial hypertrophy or early repolarization, which were not assessed here [13,27,28]. We focused on easily assessable und interpretable ECG signs. This approach seems reasonable as mostly general practitioners who might be less experienced with complex ECG analysis will analyse the ECGs in clinical routine and, in addition, in many facilities there might still be no automatic digital ECG analysis, for example, for QT-dispersion. Further, our results cannot be transferred to patients with diabetes and without cardiovascular disease or with heart failure as the prevalence and the prognostic impact of ECG signs might differ by co-morbidity. Finally, observational studies cannot clarify causality in associations. Most ECG signs that are examined here must be assumed to be secondary as a result of structural changes in the heart caused by diabetes or associated risk factors [1] and it remains unclear whether they causally contribute to the adverse outcome. In addition, there might be confounders that were not assessed in this study, for example, physical activity is known to affect heart rate as well as outcome [29]. In conclusion, affordable and easily assessable electrocardiographic signs such as heart rate, cQT-interval and bundle branch block are predictive for adverse outcome in patients with Type 2 diabetes and known
cardiovascular disease independently of demographic and clinical risk factors and should be considered in clinical care.
Competing interests
EE and CAS have served as consultants to and have received honoraria for speaking engagements from Takeda. RP and RC have nothing to declare.
Acknowledgments
Indianapolis, IN, USA. We would like to thank the PROactive investigators (see also Supporting Information, Appendix S1) and Z. Tolman for his help in editing the manuscript.
References
1 Stern S, Sclarowsky S. The ECG in diabetes mellitus. Circulation 2009; 120: 1633-1636.
2 Chugh SS, Reinier K, Singh T, Uy-Evanado A, Socoteanu C, Peters D et al. Determinants of prolonged QT interval and their contribution to sudden death risk in coronary artery disease: the Oregon Sudden Unexpected Death Study. Circulation 2009; 119: 663-670.
3 Nichols GA, Reinier K, Chugh SS. Independent contribution of diabetes to increased prevalence and incidence of atrial fibrillation. Diabetes Care 2009; 32: 1851-1856.
4 Guzman E, Singh N, Khan IA, Niarchos AP, Verghese C, Saponieri C et al. Left bundle branch block in type 2 diabetes mellitus: a sign of advanced cardiovascular involvement. Ann Noninvasive Electrocardiol 2004; 9: 362-365.
5 Ewing DJ, Boland O, Neilson JM, Cho CG, Clarke BF. Autonomic neuropathy, QT interval lengthening, and unexpected deaths in male diabetic patients. Diabetologia 1991; 34: 182-185.
6 Vinik Al, Maser RE, Mitchell BD, Freeman R. Diabetic autonomic neuropathy. Diabetes Care 2003; 26: 1553-1579.
7 Stettler C, Bearth A, Allemann S, Zwahlen M, Zanchin L, Deplazes M et al. QTc interval and resting heart rate as long-term predictors of mortality in type 1 and type 2 diabetes mellitus: a 23-year follow-up. Diabetologia 2007; 50: 186-194.
8 Cardoso CR, Salles GF, Deccache W. Prognostic value of QT interval parameters in type 2 diabetes mellitus: results of a long-term follow-up prospective study, J Diabetes Complications 2003; 17: 169-178.
9 Linnemann B, Janka HU. Prolonged QTc interval and elevated heart rate identify the type 2 diabetic patient at high risk for cardiovascular death. The Bremen Diabetes Study. Exp Clin Endocrinol Diabetes 2003; 111: 215-222.
10 Okin PM, Devereux RB, Lee ET, Galloway JM, Howard BV. Electrocardiographic repolarization complexity and abnormality predict all-cause and cardiovascular mortality in diabetes: the Strong Heart Study. Diabetes 2004; 53: 434-440.
11 Charbonnel B, Dormandy J, Erdmann E, Massi-Benedetti M, Skene A. The prospective pioglitazone clinical trial in macrovascular events (PROactive): can pioglitazone reduce cardiovascular events in diabetes? Study design and baseline characteristics of 5238 patients. Diabetes Care 2004; 27: 1647-1653.
12 Dormandy JA, Charbonnel B, Eckland DJ, Erdmann E, Massi-Benedetti M, Moules IK et al. Secondary prevention of macrovascular events in patients with type 2 diabetes in the PROactive Study (PROspective pioglitAzone Clinical Trial In macro Vascular Events): a randomised controlled trial. Lancet 2005; 366: 1279-1289.
13 Rautaharju PM, Surawicz B, Gettes LS, Bailey JJ, Childers R, Deal BJ et al. AHA/ACCF/HRS recommendations for the standardization and interpretation of the electrocardiogram: part IV: the ST segment, T and U waves, and the QT interval: a scientific statement from the American Heart Association Electrocardiography and Arrhythmias Committee, Council on Clinical Cardiology; the American College of Cardiology Foundation; and the Heart Rhythm Society: endorsed by the International Society for Computerized Electrocardiology. Circulation 2009; 119: e241-e250.
14 Surawicz B, Childers R, Deal BJ, Gettes LS, Bailey JJ, Gorgels A et al. AHA/ACCF/HRS recommendations for the standardization and interpretation of the electrocardiogram: part III: intraventricular conduction disturbances: a scientific statement from the American Heart Association Electrocardiography and Arrhythmias Committee, Council on Clinical Cardiology; the American College of Cardiology Foundation; and the Heart Rhythm Society. Endorsed by the International Society for Computerized Electrocardiology. J Am Coll Cardiol 2009; 53: 976-981.
15 Sagie A, Larson MG, Goldberg RJ, Bengtson JR, Levy D. An improved method for adjusting the QT interval for heart rate (the Framingham Heart Study). Am J Cardiol 1992; 70: 797-801.
16 Du X, Ninomiya T, de GB, Abadir E, Chalmers J, Pillai A et al. Risks of cardiovascular events and effects of routine blood pressure lowering among patients with type 2 diabetes and atrial fibrillation: results of the ADVANCE study. Eur Heart J 2009; 30: 1128-1135. 17 Schnabel RB, Sullivan LM, Levy D, Pencina MJ, Massaro JM, DAgostino RB Sr et al. Development of a risk score for atrial fibrillation (Framingham Heart Study): a community-based cohort study. Lancet 2009; 373: 739-745.
18 Butler J, Kalogeropoulos A, Georgiopoulou V, Belue R, Rodondi N, Garcia M et al. Incident heart failure prediction in the elderly: the health ABC heart failure score. Circ Heart Fail 2008; 1: 125-133.
19 Kannel WB, DAgostino RB, Silbershatz H, Belanger AJ, Wilson PW, Levy D. Profile for estimating risk of heart failure. Arch Intern Med 1999; 159: 1197-1204.
20 Palatini P, Benetos A, Grassi G, Julius S, Kjeldsen SE, Mancia G et al. Identification and management of the hypertensive patient with elevated heart rate: statement of a European Society of Hypertension Consensus Meeting, J Hypertens 2006; 24: 603-610.
21 Giannoglou GD, Chatzizisis YS, Zamboulis C, Parcharidis GE, Mikhailidis DP, Louridas GE. Elevated heart rate and atherosclerosis: an overview of the pathogenetic mechanisms. Int J Cardiol 2008; 126: 302-312.
22 Sumner G, Salehian O, Yi Q, Healey J, Mathew J, Al-Merri K et al. The prognostic significance of bundle branch block in high-risk chronic stable vascular disease patients: a report from the HOPE trial, J Cardiovasc Electrophysiol 2009; 20: 781-787.
23 Jeong JH, Kim JH, Park YH, Han DC, Hwang KW, Lee DW et al. Incidence of and risk factors for bundle branch block in adults older than 40 years. Korean J Intern Med 2004; 19: 171-178.
24 Festa A, D'Agostino R Jr, Rautaharju P, Mykkanen L, Haffner SM. Relation of systemic blood pressure, left ventricular mass, insulin sensitivity, and coronary artery disease to QT interval duration in nondiabetic and type 2 diabetic subjects. Am J Cardiol 2000; 86: 1117-1122.
25 Boccalandro F, Velasco A, Thomas C, Richards B, Radovancevic B. Relations among heart failure severity, left ventricular loading conditions, and repolarization length in advanced heart failure secondary to ischemic or idiopathic dilated cardiomyopathy. Am J Cardiol 2003; 92: 544-547.
26 Erdmann E, Charbonnel B, Wilcox RG, Skene AM, Massi-Benedetti M, Yates J et al. Pioglitazone use and heart failure in patients with type 2 diabetes and preexisting cardiovascular disease: data from the PROactive study (PROactive 08). Diabetes Care 2007; 30: 2773-2778. 27 Boner G, Cooper ME, McCarroll K, Brenner BM, de ZD, Kowey PR et al. Adverse effects of left ventricular hypertrophy in the reduction of endpoints in NIDDM with the angiotensin II antagonist losartan (RENAAL) study. Dtabetologta 2005; 48: 1980-1987. 28 Tikkanen JT, Anttonen O, Junttila MJ, Aro AL, Kerola T, Rissanen HA et al. Long-term outcome associated with early repolarization on electrocardiography. N Engl J Med 2009; 361: 2529-2537.
29 Kannel WB, Wilson P, Blair SN. Epidemiological assessment of the role of physical activity and fitness in development of cardiovascular disease. Am Heart J 1985; 109: 876-885.
Supporting Information
Additional Supporting Information may be found in the online version of this article: Appendix S1. List of PROactive investigators.
Please note: Wiley-Blackwell are not responsible for the content or functionality of any supporting materials supplied by the authors. Any queries (other than for missing material) should be directed to the corresponding author for the article.

![[PDF] Support de formation d’initiation à iDVD en Pdf | Cours informatique](data:image/gif;base64,R0lGODlhAQABAIAAAP///wAAACH5BAEAAAAALAAAAAABAAEAAAICRAEAOw==)