wOrkers IN The INfOrmaL secTOr:
whO are They aND whaT are TheIr
wOrkING cONDITIONs?
Nguyen Thu hien
As mentioned in Chapter 3, operating conditions in the informal sector are poor and insecure. In addition, Vietnam has experienced spectacular development over the past ten years. Therefore, how these precarious operating conditions affect employment and labour conditions in this sector and whether improvement of working conditions has come with this development warrants analysis. Based on HBIS surveys, this chapter complements Chapter 2 by providing an in-depth overview of the working conditions in the HB sector. With regard to the objective of inclusive growth, it aims to understand the source of vulnerability and the precariousness of the wor-kers in this sector and to identify the groups of worwor-kers that are the most vulnerable in order to ensure better protection and stability of the labour force.
This chapter includes three sections. Section 1 describes the socio-demographic characteristics of the workers in the informal sector and calls into question the common perception of workers in the informal sector, in particular with regards to the gender, migratory status, seniority and qualifications of the workers. Section 2 presents an overall picture of the working conditions in the informal sector. As shown in Chapter 2, although this sector is an important source of employment and it generates income for many people, the labour conditions are precarious and the workers lack protection. The HB&IS survey allows us to go further in the analysis of these conditions. In particular, it provides new knowledge about the earnings of workers in the informal sector, and it yields new insights into the lack of formal gua-rantees in this sector by considering the relationship between the owner and the employees as a substitute for formal arrangements. Section 3 analyses the trend in working conditions observed in Hanoi and Ho Chi Minh City between 2007 and 2014 and highlights a mitigated improvement of these conditions.
1.
wHO aRE THE wORkERS IN THE HOUSEHOlD BUSINESS
aND INfORmal SECTORS?
This first section presents an overall picture of the socio-demographic characteristics of the workers in the informal sector, including gender, seniority, migratory status, education and training.
1.1. Gender
As shown in Chapter 2, women are not overrepresented in the HB sector compared to the rest of the labour force: They account for 46 per cent of the labour force in the informal sector and 45 per cent in the formal sector. This section presents in greater detail the distribution of female workers in the HB sector to find out which indus-try or position attracts the most female workers. As shown in Figure 4.1, women are the spouse of the owner in the same proportion as men, but women are more likely to be own-account workers than men, and they are wage workers less often than men. Among formal HBs, they are slightly less likely to be employers than men as well. Although working on one’s own-account is usually considered to be vulnerable employment,1 it provides an important source of livelihood for women since working
in this sector gives them more flexibility to fulfil family obligations. They can work at home or at a market. Over a quarter of the female informal HB owners say that they decided to work on their own account in order to be able to reconcile family and pro-fessional life, and this was the case for only 6 per cent of the men.2
Figure 4.1 shows that women are much more represented in the trade sector (espe-cially retail trade) and food services than men. In contrast, there are very few women in the transport and construction sectors, and they are underrepresented in the other services and in the formal manufacturing sector.
1. According to the ILO, Key Indicators of the Labour Market 03 (KILM03), although we will see in this chapter that this does not hold true in the HB sector when compared with the status of wage workers. 2. For further information, see Chapter 11.
1.2. migratory status
The share of migrants at urban informal HBs is very small, only 3 per cent of the total number of workers, including the HB owners. The urban manufacturing and construc-tion sector has the highest proporconstruc-tion of migrants, but the figure is still modest (5 per cent at informal HBs and 8 per cent at all HBs). The proportion of migrants at formal HBs is higher than that at informal ones, but it is only 7 per cent in urban areas. This finding is interesting as it goes against findings3 from other contexts which show that
the urban informal sector mainly consists of migrants from rural areas. That is not the case in Vietnam.
3. Source: Urban Informal Sector in Asia: An annotated bibliography, Geneva, International Labour Office, 1992 (International Labour Bibliography, No. 13).
0 % 10 % 20 % 30 % 40 % 50 % 60 % 70 % 100 % 80 % 90 % Informal Male Informal Female Formal Male Formal Female Informal Male Informal Female Formal Male Formal Female Employer Family helper Spouse Own-account worker Apprentice Wage worker Construction Other services Transport Manufacturing Trade Rest. & Accom. fIGure 4.1.
dIsTrIBuTIon of female and male workers BY joB sTaTus and IndusTrY
(PERCENTAGE)
1.3. seniority
The average seniority of workers at HBs is high, as was the case in 2007 in Hanoi and Ho Chi Minh City (Cling et al. 2010). Over one third (39 per cent) of the informal HB workers had more than ten years’ seniority at their HB, and only 4 per cent had been there less than one year. Seniority is correlated to job status.
Employers rank first with an average seniority of 11.5 years at informal HBs and 12.4 at formal ones, followed by own-account workers at 10.6 years. Both the long duration of HBs (see Table 4.2) and the fact that they rarely change ownership explain the high seniority for these categories of workers. The spouse and family helpers have high seniority as well, showing that they generally help the owner from the start of the business. On average, the spouse joins the business one year after it starts up while other family workers join it after three years. This suggests that family helpers are not an adjustment factor for the business activity. On the contrary, they join the business as soon as it reaches the critical level of activity, and they then become a structural element of the business. This illustrates the specific way that family businesses (which constitute 37 and 43 per cent of the informal and formal HBs respectively) function in the context of Vietnam, as described in Chapter 3.
High seniority was not observed for wage workers. They only work at an HB for around 4 years. Two reasons may explain the short duration of wage workers at HBs. First, HBs have to wait several years before being able to recruit wage workers. Second, wage workers are recruited or fired according to the needs of the business. This second expla-nation is the most convincing because only 18 per cent of the informal HBs with wage
TaBle 4.1.
share of mIGranTs In The hB secTor BY IndusTrY and formalITY sTaTus
(PERCENTAGE)
migrant (%)
rural urban Total
Industries
Manufacturing & construction 2.3 7.7 4.3
Trade 0.9 3.6 2
Service 1.5 3.7 2.7
Informal HBs 1 2.9 1.7
Formal HBs 3.4 7.1 5.5
All HBs 1.6 4.7 2.9
workers and 24 per cent of the formal ones have experienced a growth of their work-force since their start-up (see Chapter 6), which shows that most of the HBs with wage workers do not have to wait for several years before being able to hire wage workers.
1.4. education and training
As shown in Chapter 2, educational attainment in the informal sector is found to be significantly lower than in the other institutional sectors. Only one fifth of the informal HB workers have completed secondary education (see Figure 4.2). Moreover, more than half of them did not go further than primary education. Generally, educational attainment among formal HBs is higher than among informal ones for all kinds of workers (see Figure 4.2). On average, the proportion of workers who have completed upper secondary education and work at formal HBs is twice that of those who work at informal HBs (38 per cent and 20 per cent respectively). In addition, only one third of the formal HB workers and more than half of the workers at informal HBs have only a primary education or less.
Interestingly, wage workers have almost the same level of education as the owners or their spouses. In contrast, family helpers, who constitute 8 per cent of the wor-kers at HBs, are on average more educated than the others, especially in the informal sector: The proportion of family helpers having completed secondary education is 14 and 9 points of percentage higher than for other workers at informal and formal
TaBle 4.2.
senIorITY of workers and duraTIon of hB, BY joB sTaTus (YEARS)
job status Informal hBs formal hBs
Own-account worker 10.6 10.6 Employer 11.5 12.4 Spouse 9.0 10.5 Wage worker 4.2 3.6 Family helper 8.4 9.3 Total 9.2 8.2 hB duration 1 worker 12.0 10.4 2 workers 9.9 11.8 3-5 workers 11.6 12.8 6-18 workers 12.7 12.0 Total 11.2 11.6
HBs respectively. This can be explained by the upward mobility in education from one generation to the next. Indeed, two thirds of the family helpers (67 per cent) are the owner’s children. The majority of these children have a higher level of education than the owner and almost half of them have completed upper secondary school. On the one hand, this may be viewed as low prospects for the children of HB owners. On the other hand, this may be interpreted as an opportunity for HBs to benefit from new skills and potential to develop their business. The second interpretation should be preferred as a significant share of these children have another main job and only help to manage the family business. Nearly one third of them have a secondary job and two thirds of them are part-time workers.4
4. Part-time workers are defined as workers who work less than 35 hours per week (see section 2.5 of this chapter).
Owner spouse wage worker family helper Total IhB
53.6 19.4 56.1 18.5 52.2 17.5 52.4 20.4 40 33.3 Primary or less >= upper secondary
Informal hBs
Owner spouse wage worker family helper Total fhB
formal hBs
34.6 37.7 32.7 34.2 34.4 38.1 33.2 37.9
26.7 47.5 fIGure 4.2.
level of educaTIon BY joB sTaTus and formalITY sTaTus
(PERCENTAGE OF WORKERS)
Apart from certificates, skills are crucial factors in guaranteeing the quality of the work-force as educational certificates (and the training they represent) may be insufficient for undertaking numerous economic activities. Figure 4.3 provides information about sources of skill acquisition. Skills which are used at HBs and in the informal sector are mainly learned outside formal education. More than three quarters of the HB workers acquired their skills through learning by doing and only 5 per cent through formal education (e.g. vocational/professional schooling or short courses offered by an asso-ciation). 69 per cent of the HB workers in the trade sector learned their skills through on-the-job training without a trainer, compared to around 36 per cent in the manu-facturing sector and 48 per cent in the service sector. Having a mentor in the training process only seems necessary in the manufacturing and construction sectors, which require more technical skills. Up to 45 per cent of the HB workers in the manufacturing and construction sectors are trained by their mentor, whereas only 16 per cent of the workers in the trade sector and 29 per cent in the service sector learn from a mentor. Finally, in some cases a family member teaches the required skills (12 per cent of the time). The sources of skill acquisition are almost the same for formal and informal HBs.
0 % 10 % 20 % 30 % 40 % 50 % 60 % 70 % 100 % 80 % 90 % Self-learning Trained by a family member Learning by doing without a trainer Learning by doing with a trainer At school Manuf. & constr. Service Informal HBs Formal HBs All HBs Trade fIGure 4.3.
TraInInG of workers BY IndusTrY and formalITY sTaTus (PERCENTAGE)
2.
wHaT aRE THE wORkINg CONDITIONS Of THE wORkERS
IN THE INfORmal SECTOR?
While Chapter 2 concentrates on the trend in the working conditions in the informal sector and compares them with other institutional sectors, this section analyses more in detail the working conditions by industry and job status in the HB and informal sec-tors and the differences between rural and urban areas. In addition, we also examine how the relationship between workers and owners impacts working conditions.
2.1. job status
According to the ILO (KILM 3), the indicator of status of employment distinguishes between three categories of employment: wage workers, self-employed workers and contributing family workers (also known as unpaid family workers). Figure 4.4 shows that around half of the workers at informal HBs (46 per cent) are own-account workers, while nearly one third are unpaid family workers: the owner’s spouse and other family helpers. The proportions of employers and wage workers are much lower, at 12 and 10 per cent respectively.5 This distribution with a large share of own-account workers is
an indicator of the poor accumulation capacity of the informal sector (Cling et al., 2010).
5. As mentioned in Chapters 1 and 2, the 2014/15 HB&IS survey does not cover the construction workers who stated they are informal but are not related to any HB (because they work under contract for
Own-account worker employer spouse wage worker family helper apprentice Partner 46 12 21 10 8 1 1 29 17 23 22 8 1 1 Informal hBs formal hBs fIGure 4.4.
sTrucTure of emploYmenT BY joB sTaTus In The formal and Informal hBs
(PERCENTAGE OF WORKERS)
The structure of employment at formal and informal HBs differs by the share of own-account workers and wage workers. The proportion of own-own-account workers at formal HBs is two thirds of the share at informal HBs, whereas the proportion of wage workers is twice that observed at informal HBs.
Because the share of wage workers, defined as the ratio of the number of wage workers to the total number of workers, reflects both the working conditions of the workers and HBs having to resort to the market to get labourers, it deserves to be examined in grea-ter detail. As mentioned before and shown in Table 4.3, the share of wage workers in the total workforce at informal HBs is low at 11 per cent.6 The proportion is the highest
in the manufacturing and construction sector (20 per cent). Not surprisingly, the share of wage workers is much higher at formal HBs than informal HBs, and this gap is par-ticularly large in the manufacturing and construction sector, where the ratio of wage workers is 41 per cent at formal HBs. Such a modest representation of wage workers at informal HBs could be associated with the predominance of own-account workers and the small percentage of employers hiring wage workers, as shown in Chapter 3. In contrast, there is almost no difference between urban and rural areas, except in the trade sector, where the rate of wage workers in urban areas is particularly low. As men-tioned in Chapter 3, this is possibly because the trade sector in urban areas significantly involves mobile street vendors and other kinds of vendors who work alone.
6. See previous footnote.
individuals). For this reason, the share of wage workers in the informal sector is nearly 50 per cent lower in the HB&IS than the share estimated in the 2014 LFS. As the characteristics of the construction workers are specific to them (e.g. in terms of gender, age, educational level and migration status), the results of the HB&IS concerning wage workers at informal businesses are not comparable with the results of the LFS presented in Chapter 2.
Despite the minor proportion of wage workers in the total workforce of the informal sector, wage workers account for a large portion of the dependent workers (48 per cent), who are defined as workers other than owners, their spouse and partners (see Table 4.3). This means that almost half of the people who are hired are wage workers.
2.2. Type of contract and temporary status
More than a half of the dependent workers at informal HBs do not have any form of contract (verbal or written), and written contracts are almost non-existent (0.7 per cent of the workers and 1.2 per cent of the wage workers at informal HBs). The propor-tion of dependent workers without a contract is the highest in the informal trade sector, where 60 per cent of the workers do not have a contract (see Table 4.4), and the proportion for this sector is 86 per cent in urban areas. A lack of formal agreements was also observed at the formal HBs: Only 3 per cent of the dependent workers and 5 per cent of the wage workers have a written contract, while 23 per cent of the wage workers at formal HBs do not have a verbal or written contract. Again, the status of wage workers at HBs is not associated with increased stability, especially in urban areas.
TaBle 4.3.
raTe of waGe workers BY IndusTrY and GeoGraphIcal area (PERCENTAGE)
share of wage workers (% of total workforce)
share of wage workers (% of total dependent workers)
rural urban Total rural urban Total
Informal hBs Manufacturing & construction 18.1 22.8 19.6 59.8 66.9 62.1 Trade 8.1 2 6.2 41.3 17.7 36 Service 5.2 6.9 6.1 36.6 37.5 37.1 Total IhB 11 10.1 10.6 49.4 46.4 48.3 formal hBs Manufacturing & construction 41.5 40.7 41.1 81.6 77.6 79.6 Trade 7.8 14.5 11.3 44.6 57.3 51.9 Service 20.1 24.2 23 52 64.3 60.7 Total fhBs 20.1 23.7 22.2 62.1 65.7 64.2 all hBs 13.1 15.6 14.2 53.5 56.9 55
The lack of formal agreement can be explained by the fact that labour relations are based mostly on kinship or a personal connection between the employer and the em-ployees in the HB sector. It seems that these family ties act as a substitute for a formal arrangement. 63 per cent of the employees at informal HBs (except the spouse) are hired through family or friends of the owner (see section 2.4 and Chapter 10 for more details).
Besides the lack of a formal arrangement, nearly one worker out of ten occupies a temporary position in the informal sector (see Table 4.5).7 The manufacturing and
construction sectors have the highest proportion, in particular in rural areas (11 per cent). Meanwhile, this figure is higher in urban areas for the trade sector (10 per cent). The share of temporary workers is smaller among formal HBs but the difference is very small (7 per cent).
7. Temporary workers are defined as workers recruited for a short period (one year or less) in order to fill a big order or to face a high demand.
TaBle 4.4.
share of dependenT workers wIThouT a conTracT BY IndusTrY, formalITY sTaTus and emploYmenT sTaTus (PERCENTAGE)
without a contract written contract
rural urban Total rural urban Total
Industries Manufacturing & construction 35.0 45.8 39.5 0.6 3.4 1.8 Trade 60.5 57.2 59.2 0.0 1.3 0.5 Service 57.5 56.5 56.9 2.6 3.3 3.0 Informal HBs 52.6 60.3 55.5 0.2 1.5 0.7 Formal HBs 35.8 46.2 42.1 2.3 4.1 3.4 all hBs 47.2 52.6 49.8 0.8 2.9 1.8
Wage workers at informal HBs 21.8 37.0 27.5 0.3 2.8 1.2
Wage workers at formal HBs 10.7 30.2 22.7 3.4 5.8 4.9
Note: Dependent workers are workers who are not the owner or the owner’s spouse and partners.
Hence, working conditions in the informal sector are characterized by the preca-riousness of the job, with no formal guarantee of stability. In particular, written contracts are almost non-existent and recruitment for a temporary period is not negligible. The precariousness is higher in urban areas than in rural ones. Being a wage worker in the HB sector is not associated with greater stability.
2.3. social security and other benefits
In addition to the privation of a guarantee, workers in the informal sector also face a lack of social protection (see Table 4.6). They are not covered by any kind of social security system as 98 per cent of the informal HBs are not registered with the social se-curity department. Only 26 per cent of the dependent workers at informal HBs benefit from health insurance.8 The percentage of dependent workers who receive a monetary
bonus or paid leave is also fairly limited at informal HBs (19 and 28 per cent in rural and urban areas respectively).
8. As mentioned in Chapter 2, health insurance coverage and paid social security coverage are not comparable, especially because of the existence of social assistance, which provides beneficiaries with health insurance without them having to pay into the social security scheme. For this reason, the figure on health insurance in Table 4.6 cannot be compared to the results of Chapter 2, which are based on the LFS.
TaBle 4.5.
share of TemporarY workers amonG dependenT workers BY IndusTrY and formalITY sTaTus (PERCENTAGE)
Temporary workers
rural urban Total
Industries Manufacturing & construction 11.0 6.5 9.1 Trade 2.6 8.7 5.0 Service 5.9 9.6 8.3 Informal HBs 9.7 8.4 8.8 Formal HBs 4.0 8.1 6.5 all hBs 7.4 8.2 7.8
Note: Dependent workers are workers who are not the owner or the owner’s spouse and partners.
When comparing informal and formal HBs, it can be seen that formalization does not always result in better working conditions, especially regarding social security. The number of dependent workers who have health insurance is smaller at formal HBs than at informal HBs (22 and 26 per cent respectively). One interpretation of this result is that dependent workers are most likely to be a close relative of the owner in the informal sector (13 per cent are intimate with the owner compared to 9 per cent at formal HBs). As a consequence, the owners of informal HBs are more likely to provide them with social security as their vulnerability is more of a concern for him/her than if they did not have a close relationship. In the same way, wage workers benefit from health insurance about half as often as family helpers (17 per cent of them have a health insurance card compared to 38 per cent of the family helpers). For other conditions such as a contract, bonus or paid leave, workers at formal HBs are substantially better off than those at informal HBs: The share of workers without a contract is lower (42 compared to 55 per cent; see Table 4.4), and the proportion of workers who receive a monetary bonus or paid leave is more than twice as high (50 versus 22 per cent). Being a wage worker increases the likelihood of receiving bonuses or paid leave, but the proportion of wage workers without these benefits is still substantial (half of the wage workers at informal HBs and more than one third at formal HBs).
2.4. level of intimacy between the owner and workers
As suggested in subsection 2.2, a close personal relationship between employees and their employer may serve as a substitution for a formal agreement. It is therefore impor-tant to examine how the strength of the relationship between workers and the owner of a HB (defined by their level of intimacy according to the owner of the HB) impacts their working conditions, particularly for wage workers.
TaBle 4.6.
socIal securITY and oTher BenefITs amonG dependenT workers BY formalITY sTaTus (PERCENTAGE)
have health insurance receive monetary bonuses
or paid leave
rural urban Total rural urban Total
Informal HBs 25.7 25.7 25.7 18.9 27.6 22.1
Formal HBs 24.5 19.6 21.5 44.6 52.7 49.6
all hBs 25.3 22.4 23.9 27 41.2 33.8
Note: Dependent workers are workers who are not the owner or the owner’s spouse and partners.
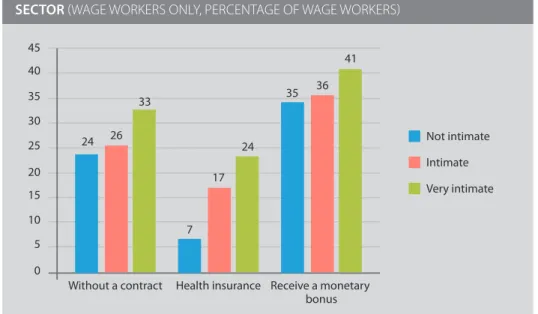
Figure 4.5 illustrates that although workers who are close9 to the owner lack a formal
agreement, they are more likely to receive other benefits. Indeed, the likelihood of having health insurance is 7 per cent when wage workers are not intimate with the owner compared to 24 per cent when they are very intimate. When intimacy is defined as having a family relationship, only 14 per cent of the non-family workers have a health insurance card compared to 32 per cent of the family workers.
In the same way, the probability of receiving a monetary bonus is 11 points of percen-tage higher when the relationship with the owner is very intimate than when it is not intimate. Finally, 33 per cent of the workers who are very intimate with the owner have no contract, while the share for workers who are not intimate is 24 per cent.
To sum up, these results confirm the intuition that strong ties between a wage worker and the owner of a HB are a substitute for a formal agreement and that this provides the worker with better working conditions.
9. Having a close link with the owner means that workers are intimate or very intimate with the owner of the HB (according to the owner of the HB).
0 5 10 15 20 35 25 40 45 30 Not intimate Intimate Very intimate Without a contract 24 26 33 Receive a monetary bonus 35 36 41 Health insurance 7 17 24 fIGure 4.5.
laBour condITIons BY relaTIonshIp wITh The owners In The Informal secTor (WAGE WORKERS ONLY, PERCENTAGE OF WAGE WORKERS)
2.5. working time
As mentioned in Chapter 2, the average number of working hours per week in the informal sector is 45 hours per week. This is lower than the legal Vietnamese working week (48 hours). Moreover, it is also lower than the average at formal HBs (49 hours). Working time differs according to the job status of the worker as well (see Table 4.7). The longest working time is found among the owners of household businesses (50 hours for employers and 49 hours for own-account workers at informal HBs). At informal HBs, workers in all of the remaining job categories work less than 48 hours per week. In particular, family helpers work the least, only 28 hours per week on average. The same differences according to job status were observed at formal HBs, although the average number of hours worked per week is greater at formal HBs than at informal HBs.
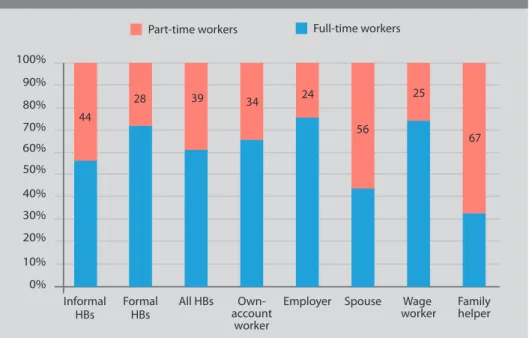
The low amount of working time among dependent workers is probably due to the high share of part-time workers. Although almost half of the workers at informal HBs have excessive working hours (more than 48 hours per week; see Chapter 2), the pro-portion of part-time workers, defined as workers working less than 35 hours per week, is very high as well at 44 per cent of the workers at informal HBs and 28 per cent at the formal ones (see Figure 4.6). In detail, part-time workers account for about two thirds of the unpaid family workers and one quarter of the wage workers.
Two reasons may explain the high share of part-time workers in the informal sec-tor. On the one hand, this may reflect the importance of visible underemployment. However, Chapter 2 shows that visible underemployment is not really a concern in that sector. On the other hand, this could be seen as a sign of flexibility offered by the informal sector to their workers: the personal management of time (Cling et al., 2010). This means that the individuals who do not work full time have the opportunity to
TaBle 4.7.
workInG hours per week BY joB sTaTus and formalITY sTaTus (HOURS)
average working hours per week (hours)
Informal hBs formal hBs all hBs
Own-account worker 48.6 63.0 51.8
Employer 50.4 61.9 54.7
Spouse 35.3 44.4 38.3
Wage worker 41.6 48.8 45.1
Family helper 28.2 38.2 31.4
conduct other activities. This is demonstrated by the high percentage of workers who have a secondary job. Indeed, half of the part-time workers have a secondary job.
2.6. low earnings on average but with high disparity
Table 4.8 shows that the level of earning in the informal sector is remarkably low: The average monthly income is 3.4 million VND and the median income is 1.6 million VND. The big gap between the average and median income reflects disparity in the informal sector, especially across job status (see Table 4.9). Level of earning also varies across industries, with the highest average income in the manufacturing and construction sector (around 4.2 million VND).
0% 10% 20% 30% 40% 60% 50% 70% 80% 100% 90% Informal HBs Formal HBs All HBs Wage worker Family helper Own-account worker Employer Spouse
Part-time workers Full-time workers
44
28 39 34 24 25
67 56
fIGure 4.6.
share of parT-TIme workers BY formalITY sTaTus and BY joB sTaTus
(PERCENTAGE)
TaBle 4.8.
earnInGs BY IndusTrY In The Informal secTor (THOUSAND VND)
average median average median
monthly monthly hourly hourly
income income income income
Informal hBs
Manuf. & constr. 4,234 1,660 27.7 12.5
Trade 2,813 1,036 16 5.2
Service 3,155 1,720 24.2 9.9
All informal HBs 3,404 1,570 22.8 8.7
All Formal HBs 4,937 2,500 36 11.3
all hBs 3,889 1,775 27 9.4
Source: 2014/15 HB&IS survey, VASS-CAF & IRD-DIAL; authors’ calculations
10
Figure 4.7 compares the distribution of the remuneration of workers by registration status and by geographical area. It shows that the average income at formal HBs is much larger than that at informal HBs and that the gap in earning between formal and informal HBs is higher in urban areas than in rural ones. Wage workers at formal HBs have a higher income than their counterparts at informal HBs, and this holds true when other characteristics of the business are controlled for, in particular its size, its level of capital and the level of education of the owner, as shown by the estimation of the determinants of earning (see Table 4.A, Model 3 in the appendix). The income of wage workers at formal HBs is 13 per cent higher than the income of wage workers at informal HBs, all other things being equal.
10. We took out 26 outliers of income. These outliers are values which are at least 5 standard deviations above the mean.
Considering the informal sector only and distinguishing income by job status, it appears that employers earn the most on average: 9.5 million VND per month (see Table 4.9).11 Own-account workers rank second at 4 million VND per month. However,
it should be noted that the incomes of employers and own-account workers include the remuneration of spouse and family helpers. Therefore, it mostly represents the
11. The income of the employer is actually the profit of the HB. See Chapter 6 for more details. 5 000 0 0 .00005 .0001 .0002 Density .00015 10 000 15 000
Income distribution in rural areas
Informal hBs formal hBs
mean income of informal hBs mean income of formal hBs
5 000 0 0 .00005 .0001 .0002 Density .00015 10 000 15 000
Income distribution in urban areas
fIGure 4.7.
Income dIsTrIBuTIon aT The hBs
earning of the business and not their personal income. At the bottom of the earning scale are the unpaid family workers (excluding the spouse). They receive no monthly remuneration, but they do receive some annual bonuses. The income of wage workers includes their monthly remuneration and annual bonuses. In fact, monthly remuneration accounts for 97 per cent of the total monthly income of informal HB wage workers. The average income of wage workers is 3.8 million VND. In addition, the variance of income is the lowest for wage workers, as demonstrated by the small gap between the average and the median income for this category of workers. Not surprisingly, wage workers in urban areas earn more than those in rural areas (an average income of 4.2 million compared to 3.6 million respectively).
The legal provisions on minimum wage do not apply to most of the workers in the informal sector. However, minimum wage is a possible instrument to ensure the minimum standard of living for workers. Therefore, comparing the income of wage workers who earn the minimum wage provides an insight into the standard of living of wage workers in the informal sector. The minimum wage differs by region because of differences in the cost of living. Since January 2014, the minimum wage has ranged from 2.7 million VND in region I to 1.9 million VND in region IV.12
The income of wage workers in the informal sector is much higher than the minimum wage in their respective regions. Table 4.10 shows that the ratio of the average income to the minimum wage varies between 1.3 in region II to 1.9 in region IV, while the ratio
12. Circular Number 33/2013/TT-BLDTBXH. Region I includes the urban districts in Hanoi and Ho Chi Minh City and some of their rural districts, and Region II is comprised of the rest of the districts in Hanoi and Ho Chi Minh City, the surrounding cities and some of the main cities in the country. Region III is comprised of the remaining urban districts and some of the rural districts in the main cities. Region IV includes the remaining districts. In our sample, region IV accounts for 35 per cent of the wage workers, region I constitutes 30 per cent, region III 25 per cent and region II only 10 per cent.
TaBle 4.9.
earnInGs BY joB sTaTus aT Informal hBs (THOUSAND VND)
average monthly income median monthly income
rural urban Total rural urban Total
Own-account worker 4,031 3,885 3,971 2,040 2,600 2,200
Employer 9,711 9,295 9,544 4,070 4,167 4,167
Wage worker 3,589 4,186 3,820 3,150 3,783 3,400
Family helper 29 24 27 0 0 0
Total informal hBs 3,315 3,545 3,404 1,240 1,950 1,570
of the median income to the minimum wage ranges between 1.2 in region II to 1.7 in region III. Both ratios have minor variation across the four regions. Moreover, the small gap between the median and average incomes for each region confirms that dispa-rity of income among wage workers in the informal sector by region is low.
Only one quarter of the wage workers at informal HBs earn less than the minimum wage in their respective regions. The proportion varies between 20 per cent in region III to 34 per cent in region II. Three quarters of the workers with an income below the minimum wage are part-time workers and/or have a secondary job.
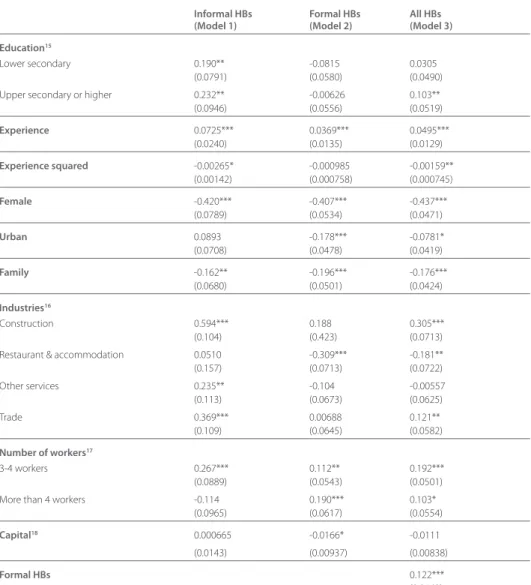
The income of wage workers depends highly on their socio-demographic characte-ristics and on the charactecharacte-ristics of the HB where they work. We analyse how these characteristics are associated with income using an econometric model (see Table 4.A, Models 1 and 3 in the appendix for informal HBs and all HBs respectively). As expected, wages rise with level of education. In the informal sector, upper secondary school graduates earn 26 per cent more than those with only a primary school edu-cation or less. The number of years of experience also affects income. The greater the seniority, the higher the wage, but at a decreasing pace. There also exists an income gap between male and female workers. A male worker earns 34 per cent more than a female worker in the informal sector, all other things being equal.
It is interesting to note that wage workers who are family members of the owner earn 15 per cent less than those who are not, all other things being equal. Perhaps in addition to remuneration and bonuses, other remuneration mechanisms are at work. The characteristics of HBs correlate to the income of wage workers as well. Wage workers earn less at informal HBs than at formal ones, once other characteristics are
TaBle 4.10.
comparIson of The Income of waGe workers In The Informal secTor and The mInImum waGe BY reGIon (THOUSAND VND)
region minimum average median average median % of wage
wage income income income income workers earning
to minimum to minimum less than the
wage ratio wage ratio minimum wage
I 2,700 4,488 4,027 1.7 1.5 23
II 2,400 3,092 3,000 1.3 1.3 34.4
III 2,100 3,467 3,600 1.7 1.7 20.1
IV 1,900 3,606 3,042 1.9 1.6 25.7
controlled for. Working at a HB located in an urban area provides a lower income than working at a rural HB. The sector of industry affects income as well. Wage workers in the construction sector are paid the highest among all the industries, followed by the trade sector. Wage workers in the manufacturing sector earn more than those who work at restaurants or accommodation facilities. However, working at a large HB does not always result in a better income in the informal sector. All other things being equal, wages at informal HBs that employ 3-4 workers are higher than wages at infor-mal HBs that hire less than 3 workers, but there is no significant difference in wages at informal HBs with more than 4 workers than at informal HBs with less than 3 workers.
3. Trend in labour conditions in hanoi and ho chi minh city from 2007 to 2014
This section aims to elucidate the evolution of labour conditions and earnings in Hanoi and HCMC over the 2007-2014 period.
After eight years, the informal and HB sectors in Hanoi and HCMC still face a lack of guarantees and protection. Most employees (except the spouse of the owner) have no access to secure work, benefits or welfare protection. Supporting the findings of Chapter 2, working conditions have improved in both cities when health insurance coverage is considered. Workers at informal HBs in Hanoi were totally excluded from health insurance benefits in 2007, but in 2014 nearly 25 per cent of them were covered by health insurance. In HCMC this figure increased from 7 per cent in 2007 to 18 per cent in 2014. The improvement of working conditions is not so clear when access to a contract, bonuses and paid leave are considered. The proportion of workers who receive monetary bonuses or paid leave increased slightly in Hanoi (from 32 to 35 per cent), and it decreased sharply in HCMC in the informal sector (from 40 to 27 per cent) and in Hanoi at the formal HBs. Not having any kind of contract has become more widespread in the informal sector in both cities and at the formal HBs in HCMC.
The income of owners in 2007 and in 2014/15 cannot be compared, because for the 2007 HB&IS survey owners were asked to state their personal income, and for the 2014/15 HB&IS survey income reflects the earning of the business as it includes the remuneration of the spouse and family helpers. Thus, this part only analyses the fluc-tuation of the earnings of wage orkers in Hanoi and HCMC from 2007 to 2014. As mentioned in Chapter 2, the real average income of wage workers at informal HBs in Vietnam increased by 61 per cent over this period. According to Table 4.12, this figure increased much more significantly in Hanoi and HCMC. In Hanoi, the average monthly income increased enormously (+91 per cent in real terms). The evolution of the me-dian income was also positive (+46 per cent). In HCMC, there was also an increase in the average income (+ 79 per cent) and the median income (+ 64 per cent)
TaBle 4.12.
evoluTIon of The averaGe and medIan real Income BY IndusTrY 2007-2014 (PERCENTAGE, ONLY WAGE WORKERS)
Source: 2007 & 2014/15 HB&IS surveys, VASS-CAF & IRD-DIAL; authors’ calculations. Incomes in 2014/15 are adjusted for inflation.
hanoi hcmc
monthly monthly monthly monthly
average median average median
Manuf.& constr. 87.0 68.5 87.6 115.9
Trade -23.0 -61.5 19.7 54.6
Service 154.3 155.9 48.2 67.1
Total Total informal hBs 90.8 46.2 79.2 63.7
Source: 2014/15 HB&IS survey, VASS-CAF & IRD-DIAL; authors’ calculations.
TaBle 4.11.
laBour condITIons of dependenT workers In The Informal secTor
(PERCENTAGE)
without have health receive monetary
a contract insurance bonuses or
paid leave 2007 2014 2007 2014 2007 2014 hanoi Informal HBs 42.3 47.3 0 24.6 31.8 35.2 Formal HBs 47.9 32.9 0.9 17 55.1 38.5 Total hBs 44.7 41.4 0.4 21.5 41.7 36.5 hcmc Informal HBs 49.9 73.7 7 17.8 40.2 26.7 Formal HBs 26.4 52.3 2.6 9.9 59.6 57.1 Total hBs 36.6 63.3 4.5 14 51.2 41.5
Considered by industry, the average and median real monthly incomes have increased except in the trade sector in Hanoi. The most significant growth rate is in the service sector, where the increase was about 155 per cent for both the average income and the median income. There was also a big increase in the manufacturing and construction sector (an 87 and a 68 per cent increase for the average and median incomes respecti-vely). Surprisingly, the median income of workers in the trade sector in Hanoi declined by 61 per cent. More competition in this sector may be the reason (see Chapters 6 and 11). In HCMC the earnings rose in all of the sectors. The highest increase was in the ma-nufacturing and construction sector (the average income increased by 88 per cent). The median income increased considerably: by 116 per cent. Contrary to Hanoi, the average and median incomes for wage workers in the trade sector increased greatly (by 20 per cent and 55 per cent respectively).
CONClUSION
This chapter presents some features of the profiles and working conditions of workers in the household business and informal sectors. It confirms the precariousness of the workers in those sectors, and it provides some new insights as well into the workers and their working conditions.
First, the informal sector is not mainly composed of women and migrants, not even in urban areas. It is worth highlighting this specificity of the informal sector in Vietnam as many stakeholders target their support exclusively to these two groups. Migrants constitute 3 per cent of the workers at HBs. The proportion of women is obviously higher than that, but it is still lower than the proportion of men. Women constitute 46 per cent of the workers in the informal sector. However, their status of employment differs from that of men. They are more likely to be own-account workers. This sta-tus is usually associated with more vulnerability. On the other hand, it provides them with more flexibility to fulfil family obligations. In addition, they earn less than their male counterparts who have the same level of education or seniority. Finally, they are concentrated in the sectors of activity which face the highest competition (e.g. the retail trade sector) and thus provide an income that is lower than in other sectors. Thus, although women are not overrepresented in the informal sector, they generally conduct activities that are associated with higher vulnerability.
Second, this chapter highlights another specificity of the HB sector: the key role of family helpers. They have a high level of seniority, reflecting their permanent status, which is combined with the duration of the HB. However, wage workers are recrui-ted for short periods of time and are used as flexible labour to adapt to the needs of the business. Family labour may constitute important human capital for a business as well. Indeed, family helpers excluding the spouse are much more educated than other workers, providing opportunities for HBs to utilise new skills and constituting a potential source of innovation in a general context where the level of formal educa-tion of the workers is low on average, especially at informal HBs.
In addition, a close relationship between the HB owner and an employee who be-longs to the same family may provide the worker with more stability than being a wage worker. This chapter reports the working conditions at HBs and in the informal sector that are still poor despite the huge economic growth experienced by Viet-nam. Formal guarantees of work and social protection are almost non-existent. Most workers have no contract and are not covered by any kind of social security system
through the HB at which they work. When they do benefit from health insurance, it is through other channels. Written contracts are almost non-existent. Formalization does not provide much better working conditions, except for earnings. Besides the poor working conditions, precarious work arrangements or non-standard forms of employment13 are a frequent phenomenon, with high shares of part-time and
tem-porary workers. However, the lack of formal guarantees is partially compensated by strong ties between the owner of the HB and the employee. As a result, family wor-kers are more likely to benefit from elements associated with decent work such as health insurance or increased stability. This goes against the idea developed by the ILO, according to which family workers and own-account workers constitute vulne-rable employment while wage workers and employers are more likely to have decent working conditions. This may hold true for private enterprises, but not the HB sector in Vietnam. Although the earnings of the wage workers are higher than the earnings of other employees (and they are rarely lower than the minimum wage), they benefit from health insurance about half as often as family workers, one out of four do not have any kind of contract, more than a third do not receive bonuses or paid leave, and their duration in the business is half that of family workers.
Finally, this chapter contributes to filling in the knowledge gap about earning in the HB and informal sectors. The level of income in the informal sector is low: The average monthly income is 3.4 million VND. However, this low level of income hides huge disparities as half of the workers in the informal sector earn 1.6 million per month or less. Incomes highly differ according to job status and sector of activity. The highest incomes are in the manufacturing and construction sector and among employers. Most wage workers earn more than the minimum wage, and there was remarkable improvement in Hanoi and Ho Chi Minh City between 2007 and 2014. However, this improvement should not hide the still unsatisfactory working conditions in the HB sector, which calls for supportive policies, in particular towards women and wage workers who do not benefit from solidarity mechanisms as family workers do.
13. “Non-standard forms of employment” (NSFE) refers to jobs that fall outside the realm of standard work arrangements and includes temporary or fixed-term contracts, temporary agency or dispatched work, and dependent self-employment and part-time work, including marginal part-time work, which is characterized by short, variable and often unpredictable hours.
Source: ILO (http://www.ilo.org/global/topics/employment-security/non-standard-employment/ lang--en/index.htm)
appENDIx – DETERmINaNTS Of wagE wORkER INCOmE
TaBle 4.a esTImaTIon of The deTermInanTs of The loGarIThm of IndIvIdual Incomes
of waGe workers BY mco14
Informal hBs formal hBs all hBs (model 1) (model 2) (model 3) education15
Lower secondary 0.190** -0.0815 0.0305 (0.0791) (0.0580) (0.0490) Upper secondary or higher 0.232** -0.00626 0.103** (0.0946) (0.0556) (0.0519) experience 0.0725*** 0.0369*** 0.0495*** (0.0240) (0.0135) (0.0129) experience squared -0.00265* -0.000985 -0.00159** (0.00142) (0.000758) (0.000745) female -0.420*** -0.407*** -0.437*** (0.0789) (0.0534) (0.0471) urban 0.0893 -0.178*** -0.0781* (0.0708) (0.0478) (0.0419) family -0.162** -0.196*** -0.176*** (0.0680) (0.0501) (0.0424) Industries16 Construction 0.594*** 0.188 0.305*** (0.104) (0.423) (0.0713) Restaurant & accommodation 0.0510 -0.309*** -0.181** (0.157) (0.0713) (0.0722) Other services 0.235** -0.104 -0.00557 (0.113) (0.0673) (0.0625) Trade 0.369*** 0.00688 0.121** (0.109) (0.0645) (0.0582) number of workers17 3-4 workers 0.267*** 0.112** 0.192*** (0.0889) (0.0543) (0.0501) More than 4 workers -0.114 0.190*** 0.103*
(0.0965) (0.0617) (0.0554)
capital18 0.000665 -0.0166* -0.0111
(0.0143) (0.00937) (0.00838)
formal hBs 0.122*** (0.0462)
14. Our sample has 1,270 wage workers age 15 or older. Due to a large number of missing values for education and age variables, there are 937 observations left.
15. Level of education dummies (reference category: primary education or less). 16. Sector activity dummies (reference sector: manufacturing).
17. Number of workers in household business dummies (reference category: less than 3 workers). 18. Natural logarithm of HB’s assets without land and premises.
constant 2.360*** 3.221*** 2.819*** (0.176) (0.115) (0.105)
n 440 497 937 adj. R2 0.257 0.282 0.236