characTerIsTIcs Of hOusehOLD
BusINesses aND The INfOrmaL
secTOr
Nguyen Thi kim Thai
Xavier Oudin
Laure Pasquier-Doumer
vu van Ngoc
While Chapter 2 used the 2014 Labour Force Survey, this chapter focuses on the pro-minent characteristics of household businesses using the 2014/15 HB&IS survey. It compares informal HBs with formal ones and questions what formality means in the context of Vietnam.
The HB sector includes formal and informal businesses. This divide, which is commonly used in labour statistics and for policy purposes, has to be explained. An understanding of the relationship between the informal sector and the state can contribute to shed-ding light on how the informal sector can be managed, promoted or monitored by a government. The informal sector, in comparison with the formal system, is seemingly less protected and regulated (De Soto, 1989). In Weeks’s (1975) opinion, the informal sector is the consequence of failing to access the formal sector; it operates outside the government’s system of supports and regulations and thus fails to benefit from formal credit and foreign technology transfers. De Soto (1989) argues that informal activities are operated without legal status because of the excessive cost and red tape procedures of formalisation.
Although there is a continuum of situations in terms of size and economic perfor-mances among HBs, there are more or less clear differences with respect to the criteria commonly used to define the informal sector. This chapter elaborates on this topic by exploring the distribution of HBs by several characteristics that are used to define informality.
The first characteristic is the size of HBs in terms of the number of workers. Small size is a common characteristic of all HBs, but informal HBs are on average smaller than formal ones, as shown in section 1. The second characteristic is the operating conditions
03
of a business. We look at the type of premises and occupancy status. Section 2 shows that there are important differences between formal and informal HBs in terms of condi-tions for operating a business. Section 3 explores the linkages between the informal sector and the state which can be partly captured through the lens of formalization with administrative registers as well as the attitude of the owners of HBs towards registration, taxation and informal payment for administrative costs. It highlights the blocking factors towards greater formalization, which are mostly a lack of incentive to formalize and poor knowledge of the regulations. In addition, the link of formal HBs with the state remains weak as formal HBs often do not have the expected attributes of formality such as tax and social security registration or bookkeeping.
1.
THE pREValENCE Of Small-SIzE HOUSEHOlD BUSINESSES
This section illustrates the distribution of formal and informal businesses by size using the number of workers. The size of establishments was not asked in the recent LFSs, so the information provided by the HB&IS survey is particularly relevant.
1.1. distribution of hBs by size
The size of a business or scale of operation is a dominant criterion for defining the informal sector in the literature. It is most often measured by the number of people working in a unit. The small size of businesses in the informal sector has been men-tioned in the literature since the first studies on this sector (ILO, 1972). Although there are some variations across countries, many papers mention the strong association between the scale of operation and formality, which indicates that the size (number of employees) is positively correlated to the possibility of formality (Maloney, 2004; La Porta and Shleifer, 2008; Pratap and Quintin, 2006; De Paula and Scheinkman, 2011). This is also the case in Vietnam (see section 4 below).
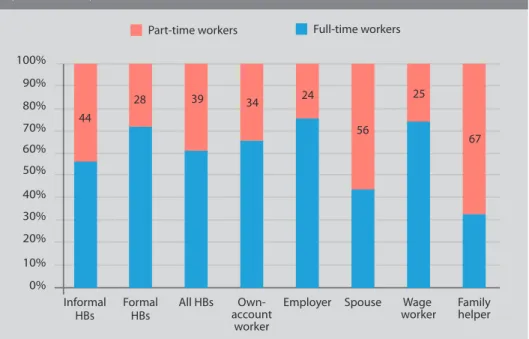
According to the HB&IS survey, informal HBs have an average of 1.8 people per esta-blishment, including the owner of the business. One out of two informal businesses is comprised of just one person, and more than 40 per cent are comprised of the owner and his or her spouse and/or members of the family. This proportion has, however, sharply decreased compared to 2007 (65 per cent in the 2007 LFS). Only 8.5 per cent of the informal businesses have hired workers. Businesses with 3-5 workers and those with more than 6 workers account for 10 per cent and 2 per cent respectively (see Figure 3.1).
Formal HBs are larger than informal ones, but the scale of operation is still very small. The average size of a formal business is 2.3 workers. Nearly one third (31 per cent) are comprised of the owner only, and half are comprised of the owner, his or her spouse and members of the family. Although the number of formal HBs that hire workers is significantly higher than the number of informal HBs that do so, only one out of four formal businesses has at least one wage worker.1 Formal businesses with 3-5 workers
constitute 24 per cent of all formal HBs. This proportion is more than two times higher than that observed in the informal sector.
A breakdown of the size distribution of informal HBs by industry presents interesting findings (see Figure 3.2). Informal HBs in the service sector tend to be the smallest as nearly two thirds of the service businesses have only one worker, who is also the owner. This is mainly because the informal HBs in the service sector are food and be-verage and land transport (motorbike taxis) services, and they do not require many workers. In contrast, the share of informal HBs with at least three workers in the ma-nufacturing and construction sectors is the highest compared to those in trade and service sectors (19 per cent vs. 10 per cent and 9 per cent respectively).
1. 31 per cent of the wage workers at formal HBs are family members. 0 % 10 % 20 % 30 % 40 % 50 % 60 % 70 % 100 % 80 % 90 % Informal HB 10 51 2 37 24 31 4 41 Formal HB Total 14 46 2 38
6-18 workers 3-5 workers 2 workers 1 worker
fIGure 3.1.
sIze dIsTrIBuTIon of household BusInesses (PERCENTAGE)
In addition, the proportion of informal HBs with more than two workers in rural areas is higher than in urban areas (see Table 3.1). This phenomenon can be explained in several ways. It can be due to underemployment in rural areas: Family members of the owners working in the agriculture sector have vacant hours to take part in activities pertaining to the family business during off-season months (e.g. after the winter and spring rice crops). Another reason is that there are fewer opportunities for them to do other non-farm jobs. Moreover, many of the informal self-employed have activities which are typical of an urban environment, e.g. motorbike taxi driver, fruit and vege-table street vendor and running a street restaurant. Hence, informal HBs in rural areas are less likely to provide services (34 per cent of the rural informal HBs are in the ser-vice sector compared to 49 per cent in urban areas). However, serser-vice activities in the informal HB sectors are those with the highest proportion of self-employed people (see Figure 3.2). Informal HBs in rural areas are more represented in the manufacturing and construction sectors (32 per cent of the rural informal HBs compared to 24 per cent of the urban informal HBs), which is where the proportion of informal HBs with more than two workers is the highest. Finally, incentives to get a business license may be weaker in rural areas, so large HBs which would be formal in urban areas are
0 % 10 % 20 % 30 % 40 % 50 % 60 % 70 % 100 % 80 % 90 % Manuf. & constr.
Trade Service Manuf.
& constr.
Trade Service
6-18 workers 3-5 workers 2 workers 1 worker
rural urban
fIGure 3.2.
dIsTrIBuTIon of Informal hBs BY maIn economIc secTor and sIze In rural and urBan areas
informal in rural areas. This is the case in particular for construction businesses, which usually have more than two workers and are never registered in rural areas.
This explains why the average size of informal HBs is higher in rural areas than in urban areas (1.9 workers in rural areas vs. 1.7 in urban areas) while the size is nearly the same in both areas for formal HBs (2.5 workers). In particular, there are more informal HBs that have only one worker (self-employed) in urban areas than there are in rural areas (58 per cent and 47 per cent respectively) (see Table 3.1). The size gap between urban and rural areas is significantly wider for the trade sector (see Figure 3.2). In this sector, 37 per cent of the rural informal HBs are constituted of the owner only, compared to 58 per cent in urban areas. Again, this can be explained by the higher proportion of street vendors in urban areas. Although smaller, the same gap between urban and rural areas in the size of the informal HBs was observed in the manufacturing and construction sectors.
1.2. evolution of the structure of employment
The average number of workers has increased slightly since 2007, at least in Hanoi when compared with the results of the survey in Hanoi and Ho Chi Minh City (Cling et al., 2010). This is due to the fact that in both Hanoi and Ho Chi Minh City the share of those working alone has declined, especially in Hanoi: While 73 per cent of the informal HBs had one self-employed person and no other workers, in 2014 this was the case for only 53 per cent of the informal HBs in Hanoi. The number of HBs with at least one wage worker has increased in Hanoi but not in Ho Chi Minh City, and in both cities this number remains low for informal HBs: Nine out of ten have no hired (wage) workers. The relative decline of self-employed workers is mostly compensated by the increase in HBs where the spouse and other members of the family are involved (see Table 3.2).
TaBle 3.1.
sIze dIsTrIBuTIon of household BusInesses BY area (PERCENTAGE)
Source: 2014/15 HB&IS survey, VASS-CAF & IRD-DIAL; authors’ calculations
rural urban Informal formal Total Informal formal Total
1 worker 46.5 32.8 43.7 57.2 30.5 48.3
2 workers 40.2 39.9 40.1 32.9 42.1 36
3-5 workers 11.4 23.8 13.9 8.6 23.5 13.5
6-18 workers 1.9 3.6 2.2 1.3 3.9 2.2
The decline in the number of self-employed people who work alone in Hanoi and Ho Chi Minh City is mainly explained by changes in the structure of the activities of the HBs in both cities. It is perhaps due to trade openness that precarious trade acti-vities, including street vendors and market vendors without a fixed location, sharply declined between 2007 and 2014, accounting for half of the decrease in the share of self-employed people. Street vendors and market vendors working alone constituted 14 per cent of the informal HBs in Hanoi in 2007 and only 5 per cent in 2014. A decline of 9 points of percentage in the proportion of these precarious informal HBs was also observed in Ho Chi Minh City (12 per cent in 2007 compared to 3 per cent in 2014). Thus, although the size of the informal HBs remains low, as was expected, the 2014/15 HB&IS survey provides two new insights into informal HBs in Vietnam. First, the struc-ture of rural informal HBs differs from that of their urban counterparts. They are more oriented towards manufacturing and construction activities and are larger on average. Second, an analysis of the trend in the size of informal HBs shows that a structural change is at play, as self-employed workers, in particular in precarious trade activities, tend to be replaced by family HBs.
TaBle 3.2.
averaGe numBer of workers and sTrucTure of hBs BY characTerIsTIcs of emploYmenT In hanoI and ho chI mInh cITY, 2007 and 2014
Source: Cling et al. 2010 and the 2014/15 HB&IS survey, VASS-CAF & IRD-DIAL; authors’ calculations
average number of
workers
percentage with one worker only (self-employed) percentage with at least one wage worker percentage with only family workers 2007 2014 2007 2014 2007 2014 2007 2014 hanoi Informal HBs 1.4 1.8 72.7 52.9 9.8 10.1 17.5 37.0 Formal HBs 2.3 2.6 35.0 21.3 28.2 35.6 36.8 43.1 All 1.6 2.0 65.4 45.0 13.3 16.5 21.3 38.5
ho chi minh city
Informal HBs 1.5 1.6 70.7 61.2 10.6 9.4 18.7 29.4
Formal HBs 2.6 2.4 31.0 29.7 37.8 31.4 31.2 38.9
2.
pRECaRIOUS BUSINESS OpERaTINg CONDITIONS
For HBs, especially informal ones, one of the main difficulties in operating a business is not having an adequate premises. This can prevent them from growing in size and res-trict their capacity to hire more workers (Cling et al., 2010). Indeed, the type of premises is an important determinant of the stability or, on the contrary, of the precariousness of a business. Without an adequate premises, operating conditions in the informal sector are more likely to be insecure and poor. Although only one out of six business owners, formal and informal, reported difficulties related to having a premises (see Chapter 11), those who operate in improvised or non-permanent premises are more likely to be in a precarious situation.
2.1. lack of a professional premises
Table 3.3 compares the types of premises in which informal and formal household businesses conduct activities in different economic sectors. Nearly a third of the in-formal HBs and 5 per cent of the in-formal HBs do not operate in a fixed premises.2 They
operate their businesses on streets like vendors, in improvised locations outdoors and in markets, and from vehicles or at their customers’ homes.
Nearly half of the household businesses operate out of the owner’s home. This type of premises is popular among household businesses because the proprietors can avoid spending money on rent or buying a premises. The owners can therefore spend their capital on other assets and equipment. Many of those working at home (half of the informal and two thirds of the formal HBs) have a dedicated space in their home in which to operate their business.
Moreover, working at home allows reconciling family and professional activities. As explicated in Chapter 11, this motivation is important when setting up an own- account business instead of working as a wage worker. This motivation is more im-portant for those who work at home: One out of five heads of HBs who work at home, which is nearly twice as many as those who not work at home, mentioned that as the main reason why they decided to work on their own account. This motivation is
2. In principle, only businesses with a fixed premises can register their business. However, there are a few formal HBs which do not have a fixed premises, e.g. in the transportation sector. In these cases, the owners stated that their personal home is their professional premises even though they do not work there.
more important for women. However, working at home may impede the growth of a business, especially in urban areas, where the density of the population is high and the ability to expand the home is limited and costly.
More than half of the formal HBs, but only 25 per cent of the informal HBs, have a professional premises such as a permanent premises in a market, workshop, shop, restaurant or hotel. The high proportion of dedicated premises for operating a bu-siness in the formal HB sector illustrates that formal HBs tend to be more professional and stable, resulting in greater business prospects and more opportunities to expand their operation by increasing their business size. It should also be noted that it is more difficult to avoid registering a business when one has a professional premises. Precarious operating conditions for informal businesses involved in service and trade activities are remarkably widespread, and many of them (46 per cent and 30 per cent respectively) do not have a premises. Informal HBs in the manufacturing and construc-tion sectors constitute a smaller share. Only 15 per cent of them have makeshift set-ups, while the owner’s home is by far the most common type of premises (60 per cent) in this sector (see Table 3.3).
The proportion of HBs located in a home, at a professional premises or without a fixed premises is similar in rural and urban areas for both informal and formal HBs. However, this does not hold true when sectors of activity are distinguished, reflecting once again the differences in the structure of HBs in urban and rural areas. The pro-portion of manufacturing and construction HBs with a professional premises is higher in rural areas (6 points of percentage higher for both formal and informal HBs). The upper tier of manufacturing HBs may be concentrated in rural areas, in particular on
TaBle 3.3.
TYpes of premIses amonG household BusInesses (PERCENTAGE)
Informal hBs Total formal hBs no per-manent premises home profes-sional premises no per-manent premises home profes-sional premises Manuf. & constr. 14.9 60.7 24.4 100 0.7 46.5 52.8 Trade 30.4 39.1 30.5 100 4.2 41.1 54.7 Service 45.8 33.2 21.0 100 8.9 43.6 47.5 Total 32.1 43.0 24.9 100 4.9 42.9 52.2
the periphery of cities, because of the need for space to conduct these activities and because there is less pressure on land in rural areas. On the other hand, formal HBs in the service sector are less likely to have a professional premises in rural areas. This suggests that HBs with high potential in the service sector are less developed in rural areas than in cities. For instance, activities in the telecommunication, human health and accommodation sectors are more frequently conducted in urban areas, while food and beverage services are more common in rural areas.3 Lastly, the proportion
of informal HBs with a professional premises in the trade sector is lower in rural areas. This is because the retail sale of food at home is more common in rural areas and because markets are more organized in cities (permanent posts in a market are more common).
2.2. space constraints
While having a fixed premises is a guaranty of stability and better working conditions, the space dedicated to an activity is a good indicator of the potential for growth of the business and of the working conditions as well. As expected, the space dedicated to the activity is much smaller among informal HBs than among formal HBs: On average, the surface dedicated for activities at informal HBs is 16 square meters, while the figure for formal HBs is more than 30 square meters. These are median figures. The amount of space is higher in rural areas, reflecting weaker pressure on land. Lastly, having a pro-fessional premises does not necessarily mean having more space in which to operate a business than at home.
3. Figures are not reported here but are available on request. TaBle 3.4.
medIan surface of premIses BY TYpe and area (m²)
Source: 2014/15 HB&IS survey, VASS-CAF & IRD-DIAL; authors’ calculations
Informal hBs formal hBs rural urban rural urban
Home 20 12 35 32
Professional premises 20 16 40 25
Nevertheless, some HBs, mainly formal ones, have a rather large premises in which to conduct their activities. One out of four formal HBs operates in a premises that is larger than 100 square meters. Informal HBs rarely have large premises, especially in urban areas.
The lack of an adequate premises in the informal sector has been reported in many papers (La Porta and Shleiter, 2008; Barwa, 1995). Without a permanent premises, many informal HBs are likely to have insufficient access to public services such as water, electricity and the internet, and they are under continuous threat of eviction. In addition to having less access to fixed premises, informal HBs have less space when they have a fixed premises.
2.3. high rate of ownership of a fixed premises
Ownership of a fixed premises (e.g. a home out of which a HB operates, a shop or a permanent premises in a market or workshop) is an indicator of the level of stability of the operating conditions. If household businesses are located in a rented premises, they face the possibility of being shifted to other premises, which may affect their investment and growth in the long run. Moreover, renting constitutes a burden that reduces profit.
More than three out of four HB owners own their premises, and the proportion is si-milar for formal and informal businesses. In addition, a few of them (2 per cent) partly own their premises. Nine out of ten of those who work at home own their home, while the proportion of those who have a professional premises is lower but still important: 68 per cent of the formal HBs and 56 per cent of the informal HBs (see Table 3.5). Among the three sectors of activity, manufacturing and construction had the highest degree of ownership (88 per cent), followed by trade (74 per cent) and service (65 per cent). The manufacturing and construction sectors are usually marked by a high level of fixity, which means that HB owners use secure and stable locations like their homes to run their businesses instead of renting a premises.
The share of both whole and part ownership is significantly greater in rural areas than in urban areas (82 per cent and 63 per cent respectively), and it is also greater among formal HBs than informal ones.
Ownership of a premises, especially when the premises is the home where the hold lives, is certainly a factor that facilitates the operation of a business. Many house-holds conduct a little trade or another type of activity in their home. Nevertheless, this alone is not enough to develop a business, and, in certain conditions, it may be an obstacle to increasing the level of activity.
2.4. high rate of free occupancy
Among HBs that have a fixed premises, 22 per cent of the HB owners do not own the premises where they operate their business. However, only half of them have to pay rent. This proportion is lower for informal businesses: 45 per cent of the informal HB owners who do not own their premises and 61 per cent of those who have a for-mal HB pay rent. Others occupy their premises freely, and a few of the inforfor-mal ones occupy their premises as squatters. The proportion of non-owners that has to pay rent is much higher in the tertiary sector, especially in the trade sector (see Figure 3.3). Chapter 10 shows that free occupancy of a premises is highly correlated with the relationship with the landlord. More than half of the landlords of professional premises are family members of the owners of the HBs, and because of this familial relationship, HB owners are often allowed to occupy a premises without paying rent, especially if they are close relatives.
TaBle 3.5.
percenTaGe of owners of premIses amonG household BusInesses BY secTor and area
formal hBs Informal hBs rural urban rural urban
Manufacturing & construction 89.2 88.9 78.2 87.4
Trade 85.1 81.5 72.5 63.1
Service 83.6 70.4 74.3 67.9
Total 85.9 81.6 74.2 72.3
All in all, only 9 per cent of the HB owners have to pay rent for their premises. This proportion is higher for formal businesses because more of them have a professional premises away from their home that they have to rent (see Table 3.6).
The precariousness of activity is primarily shown by the high rate of informal HBs ope-rating without a premises. The rate of ownership of a premises is quite high, especially among formal HBs. It is possible that not owning a premises might deter informal HBs from formalizing their business.
0 % 10 % 20 % 30 % 40 % 50 % 60 % 70 % 100 % 80 % 90 % Manuf. & constr.
Trade Service Manuf.
& constr.
Trade Service
Squat Free occupancy Renting
Informal hB formal hB
fIGure 3.3.
occupancY sTaTus of non-owners BY area and BY maIn economIc secTors
Source: 2014/15 HB&IS survey, VASS-CAF & IRD-DIAL; authors’ calculations
TaBle 3.6.
dIsTrIBuTIon of hBs BY occupancY sTaTus
Informal hBs formal hBs Total
Ownership 52.5 75.2 58.5
Free occupancy 8.0 6.7 7.7
Renting 7.4 13.2 8.9
No fixed premises 32.1 4.9 25.0
Total 100 100 100
2.5. some improvement between 2007 and 2014
A comparison of the types of premises used by informal HBs in Hanoi and Ho Chi Minh City between 2007 and 2014 shows a structural change in progress (see Table 3.7). The share of informal HBs without a permanent premises in the trade sector declined considerably between 2007 and 2014, by 15 points of percentage in Hanoi and 22 in Ho Chi Minh City, and it increased in the service sector in Hanoi (among street restau-rants and motorbike taxis). Meanwhile the proportion of informal HBs with a professio-nal premises increased in Ho Chi Minh City. This change is particularly important in the trade sector in both cities, where the share of informal HBs with a professional premises increased considerably. This result converges with the decline of self-employed people in both cities and suggests that informal trade is conducted in a fixed premises more often than by itinerant petty traders.
TaBle 3.7.
evoluTIon of The TYpe of premIses amonG Informal hBs In hanoI and ho chI mInh cITY
hanoi ho chi minh city no per-manent premises home profes-sional premises Total no per-manent premises home profes-sional premises Total 2007
Manuf. & constr. 22.7 69.8 7.5 100 7.1 86.4 6.5 100
Trade 49.0 29.6 21.4 100 42.9 41.8 15.3 100
Service 52.3 34.4 13.3 100 55.1 34.4 10.6 100
Total 45.7 39.1 15.3 100 40.6 48.2 11.2 100
2014
Manuf. & constr. 23.9 65.4 10.7 100 11.0 70.1 19.0 100
Trade 34.4 34.2 31.5 100 20.8 43.3 35.9 100
Service 61.4 28.6 10.1 100 47.8 37.8 14.4 100
Total 47.8 36.6 15.6 100 32.9 47.0 20.2 100
To conclude on premises, the type of premises used for an activity and their occupan-cy status are diverse among HBs. A non-negligible proportion of them, one third of the informal HBs, have no fixed location from which to run their business, reflecting a high level of instability and precariousness. However, this proportion is on the decline. Around half of the HB owners benefit from a high degree of stability as they operate their business out of their home, which they generally own. However, they are res-tricted in their growth prospects as space in their home is limited. Another segment is comprised of people who have a HB and do not own their premises but occupy freely premises owned by family members. Although they do not their premises, as a family member they benefit from a certain assurance regarding their stability. Howe-ver, free occupancy generates moral debt towards their family that can impact the functioning of their business (see Chapter 10). Finally, a minority of HBs, mostly formal ones, pay rent for a professional premises. That is why they can be more vulnerable to economic shocks, but they also have the highest potential for growth as they can adapt the surface of their premises to the size of their activity, and they operate in more adequate conditions.
3.
THE INfORmal SECTOR aND aDmINISTRaTIVE REgISTRaTION
Whether or not a business has been registered is one of the criteria commonly used to determine if it belongs to the informal sector. It is recommended by the ILO as an offi-cial definition of the informal sector, although the type of registration varies according to the national context. In Vietnam, the GSO uses business registration to differentiate formal from informal businesses.
We consider here three types of administrative registration: business, tax and so-cial security registration. Registration reveals what the institutional relationships are between household businesses and the state. Household businesses, except for street vendor, mobile trading, petit services and low-income services (the low-income line is defined by the provincial authorities), are obliged to register.4 Registered HBs are
gran-ted a tax code for business tax, income tax and value added tax, while non-registered HBs can register to pay an annual lump sum business tax.
Before exploring the characteristics of HBs in terms of administrative registration, we present some findings about the practice of bookkeeping. The absence of accounting
records is a major characteristic of both the informal sector and formal HBs. It is linked to administrative registration, in particular tax registration, because a lack of accoun-ting makes it difficult to have a consistent policy of taxation for this sector.
3.1. lack of accounting tools
Bookkeeping is an important indicator of the quality of management. Proper bookkee-ping contributes to improvements in an entrepreneur’s financial performance and budgeting plans. However, most HBs, even formal ones, do not keep books or records of their activity. This means that in terms of management practice, formal HBs are closer to informal HBs than to domestic or corporate enterprises.
Most informal HBs (78 per cent) do not keep any accounts at all. Only around one out of five (21.8 per cent) keep some kind of personal books, and virtually none have for-mal accounts. These proportions are similar across all the economic sectors.
These figures are not surprising as not keeping accounts is one of the main charac-teristics of the informal sector. But formalization itself does not guarantee progress in bookkeeping. Only 5 per cent of the formal HBs do bookkeeping as required by law, and more than half of them do not keep any record of their accounts (see Table 3.8).
TaBle 3.8.
BookkeepInG BY secTor, formalITY and sIze of hBs
Informal hBs Total formal hBs formal book-keeping personal book-keeping no book keeping formal book-keeping personal book-keeping no book keeping Manuf. & constr. 0.1 24.0 76.0 100 8.1 31.9 60.0 Trade 0.0 29.5 70.5 100 4.6 43.9 51.6 Service 0.1 14.4 85.5 100 4.7 39.8 55.5 Total 0.1 21.8 78.1 100 5.3 40.3 54.4
However, larger HBs are more likely to do bookkeeping than smaller ones. Legal ac-counting and personal bookkeeping make up 4 per cent and 42 per cent respectively of the HBs with 3-5 workers, and 7 per cent and 69 per cent of the HBs with more than 5 workers. Obviously, growing in size requires better management tools, but it is difficult to know the direction of causality: Do those who have a better system of management grow in size, or is it having workers that determines whether or not HBs owners do bookkeeping? In any case, even among the largest HBs, only a small share of them (7 per cent) utilise a legal accounting system, and there are still a significant number of HBs that do no bookkeeping at all (53 per cent of the HBs with 3 to 5 workers and and 23 per cent of the HBs with more than 5 workers).
Moreover, although the number of HBs with only one person has declined in Ha-noi and Ho Chi Minh City, the practice of having legal or personal accounting for one’s business has also greatly declined. Among both formal and informal HBs in both cities, the percentage of HBs that do no accounting at all increased between 2007 and 2014/15. More worryingly, this percentage more than doubled in Hanoi and in Ho Chi Minh City among formal HBs (see Table 3.9).
0 % 10 % 20 % 30 % 40 % 50 % 60 % 70 % 100 % 80 % 90 %
1 person 2 persons 3-5 persons More than
5 persons No bookkeeping Personnal bookkeeping Formal keeping fIGure 3.4. BookkeepInG BY sIze of hB
Bookkeeping is one of several characteristics which define a small segment of the HBs which are more dynamic and probably have the potential to increase the size of their operation. Formalization in itself does not guarantee progress in bookkeeping. When HBs owners engage in bookkeeping, it is a sign that they are on the way to scaling up their business. In our sample, the value added when a HB has a legal accounting system is more than double the value added to a HB which only has personal records and six times more than the value added to a HB that does no accounting.
If bookkeeping is an indicator of the quality of management of a business, then it can be said that formal as well as informal HBs in Vietnam have weak management. The comparison between 2007 and 2014, even though only for the two main cities, shows a strong decline in the number of HBs that do bookkeeping. A lack of tools for managing a business is clearly an obstacle to the development of this sector. There is an urgent need to improve the accounting of small businesses by raising awareness among owners about the utility of bookkeeping, by training them (at least the owners of formal HBs)5 and by providing some tools adapted to the operating conditions of
these businesses.
5. Although the prevalence of doing accounting increases with the level of education of HB owners, only two thirds of the owners have completed secondary school, and 57 percent of those high school graduates do no accounting at all. Clearly a lack of education is not the main obstacle to better accounting practices among HB owners.
TaBle 3.9.
TYpes of BookkeepInG In hanoI and ho chI mInh cITY In 2007 and 2014
formal bookkeeping personal bookkeeping no bookkeeping 2007 2014 2007 2014 2007 2014 hanoi Informal HBs 2.2 0.2 36.3 26.7 61.5 73.2 Formal HBs 9.6 8.3 70.2 48.2 20.2 43.5 hcmc Informal HBs 1 0.6 20.5 15 78.5 84.5 Formal HBs 8.8 7.4 59.9 28.4 31.3 64.3
3.2. one quarter of the hBs have a business certificate
Business registration is the criteria used by the General Statistics Office to differen-tiate formal from informal HBs. About one fourth of the total number of HBs (26 per cent) have a business certificate and are therefore considered to be formal HBs, which suggests relatively loose administrative links to the state of household businesses in general. Business registration is higher in the trade sector (37 per cent of the HBs) than in the service and manufacturing sectors (20 per cent).
Business registration is more important in urban areas, although, as we have seen, the average size of HBs there is not larger. While one third of the HBs in urban areas have registered as a business, in rural areas only 20 per cent have done so. Thus, the rate of formality is much higher in cities. This is probably due to looser administrative mo-nitoring of businesses in rural areas. As the implementation of the rules concerning business registration is at the discretion of district authorities, it seems that outside cities there is less pressure to register (see Table 3.10). This has been confirmed by an estimation of the probability of being registered (see the appendix). Rural HBs are much less likely to be registered than urban HBs. This can be seen once size, sector of activity, value added, premises and other characteristics are controlled for.
More generally, and as expected, the estimation of the probability of being registered shows that the bigger a HB is, the more likely it is to be registered: The number of wor-kers in an HB and the annual value added are positively and significantly correlated with the decision to register. The type of premises is one of the main determinants of regis-tration as HBs with a professional premises are more likely to be registered. Interestingly, the owners of HBs whose motivation in running a HB is to be independent (see Chapter 11 for more details) are less likely to register. Finally, female owners are less likely to regis-ter their business. This can be seen once other characregis-teristics of HBs are controlled for.
TaBle 3.10.
admInIsTraTIve reGIsTraTIon BY secTor and GeoGraphIcal area
rural urban Total
Manufacturing & construction 15.8 26.0 19.5
Trade 31.2 46.0 37.3
Service 12.0 27.4 20.3
Total 20.5 33.4 26.3
3.3. low compliance with tax and social security registration
Formal HBs, i.e. those which have a business certificate, are supposed to register with the tax department. A little more than two thirds of the HBs comply with this rule, and virtually none of the informal HBs do so. The rate of compliance for formal HBs is similar in all three economic sectors, which shows that tax registration is not related to a particular kind of activity.
Lack of tax registration is sometimes used instead of business registration as the crite-ria to define informal businesses. If this were the case in Vietnam, the informal sector would be 11 per cent larger and the number of formal HBs would be one third less. Tax registration among formal HBs is highly correlated to the level of value added of a business, as shown by an estimation of the probability of formal HBs having registered with the tax department (see Model 2 in the appendix).
Only 3 per cent of all HBs contribute to social security, and while relatively more formal than informal HBs contribute to social security, the rate of registration remains very low for all (see Table 3.11).6
Compliance with social security regulations increases with the size of a HB (the total number of workers, including the HB’s owner and spouse), but even among HBs with more than five workers, social security registration remains low at 12 per cent (see Figure 3.5). If we consider only HBs which have at least one wage worker, the rate of compliance is not much higher, only 5 per cent. In addition, the probability of social
6. Decree 152/2006 dated December 22nd, 2006 stipulates that HBs are obliged to register their business
and contribute to social security. TaBle 3.11.
TaX and socIal securITY reGIsTraTIon BY secTor and BusIness
reGIsTraTIon sTaTus (PERCENTAGE)
Tax registration social security formal hBs Informal hBs formal hBs Informal hBs
Manufacturing & construction 67.4 0 1.6 2.4
Trade 69.3 0.3 7.2 1.1
Service 68.9 0 7.3 3.4
Total 68.8 0.1 6.1 2.4
security registration among formal HBs is not correlated to the size of a HB once the other characteristics of the business are taken into account (see Model 3 in the appen-dix). So enforcement of the legal regulations on social security contributions is very limited, even among formal HBs.
The very low rate of compliance with social security registration aggravates the vulne-rability of all the workers in the HB sector. Incentives to comply with social security regulations should be envisaged to improve the social protection of not only the informal sector but also workers at formal HBs.
There is hope for social security enrolment when one considers the evolution of social security registration over time in Hanoi and Ho Chi Minh City. There has been some progress in both cities among both informal and formal HBs, but not very much (2 to 6 points of percentage in seven years), and the number of HBs which are not registered is still considerable (19 out of 20).
An opposite trend can be seen concerning tax registration: a decline in both cities among formal HBs. The increase in formalisation, i.e. in business registration, that has been seen in the past years (see Chapter 2) has not translated into increased registration with the tax department. This shows that formalisation is very fragile (see Table 3.12).
0 % 10 % 20 % 30 % 40 % 50 % 60 % 70 % 100 % 80 % 90 %
1 person 2 persons 3-5 persons 6-18 persons
Not registered
Registered fIGure 3.5.
socIal securITY reGIsTraTIon BY sIze of hB
Formalisation has little impact on the social protection of workers. Concern about the social protection of workers goes beyond the informal sector. Even at formal HBs the vulnerability of workers is high. Extending social security to workers at household businesses should be a main axis of policies towards this sector (see Chapter 8 for further discussion).
4.
faCTORS Of fORmalISaTION
As hinted above, the frontier of formalisation is fragile. Indeed, a significant number of informal HBs are willing, and are even preparing, to formalise their business by regis-tering and getting a business certificate. However, they are a minority of the informal businesses. For the majority, the advantages of formalisation are not so obvious, and there is clearly a lack of knowledge about the regulations.
In this section we first examine why informal HBs do not register and formalise their business, and we discuss the opinions of owners of informal HBs concerning regis-tration and having a business certificate. In the second part we look at the expected advantages of having a formal business.
4.1. why informal businesses are not registered
Owners of informal HBs were asked what their main reason was for not registering and getting a business certificate, which would formalise their business. Most of them (68 per cent) think they do not have to register to get a business certificate (see Table 3.13). This statement is quite surprising because owners of all kinds of informal
TaBle 3.12.
TYpes of reGIsTraTIon In hanoI and ho chI mInh cITY In 2007 and 2014
Tax registration social security registration 2007 2014 2007 2014 hanoi Informal HBs 1.2 0 0 2.5 Formal HBs 77.8 64.6 2.7 7.7 hcmc Informal HBs 0.1 0 0.4 2.2 Formal HBs 86.3 75.4 2 7.9
businesses, small and big and in all economic sectors, said this. The precise require-ments for each HB, whether or not it should be registered, are unknown because it depends on the district context. However, those who have no premises, such as street vendors and motorbike taxi drivers, were more likely to say that they did not have to register. However, this is not the case. A similar proportion of informal HBs in all kinds of premises, including professional premises, think they are not subject to registration. Even HBs that have several workers or have high value added or make a high profit share this opinion. This clearly shows a lack of knowledge of the regulations, not only among the owners of HBs but among the local authorities as well.
Other reasons for not registering are much less prevalent. 12 per cent do not want to register, probably because they do not see any advantage in formalising their bu-siness. Having an instable income is another reason (10 per cent), and a rather good one, although it might not be accepted by district authorities. This shows, however, that formalising a business is a step towards a steadier and more established way of conducting an activity. This reason was given slightly more often by HBs which were created in recent years. This is also the case for those who do not know if they have to register. Here again, there is a lack of information. Finally, the cost of registration and the complicated procedures are not the main reasons for not registering (less than 1 per cent). Most of the informal HBs can afford the cost (the median cost has been 200,000 VND since 2010, and only 5 per cent of the HBs had to pay more than 3 million VND).
TaBle 3.13.
reasons Informal hBs have for noT reGIsTerInG
Too com- Too ex- not do not unstable do not Total plicated pensive man- know if income want
datory they have to to register Manufacturing & const. 1.2 1.2 64.6 7.9 11.9 13.2 100 Trade 0.3 0.1 70.4 7.2 8.3 13.2 100 Service 0.6 0.4 69.6 5.7 11.6 11.3 100 Total informal hBs 0.7 0.6 68.4 6.8 10.7 12.4 100 Urban informal HBs 1.1 0.6 69.5 5.5 12.3 10.6 100 Rural informal HBs 0.4 0.5 67.6 7.6 9.6 13.7 100 willing to register* 66.2 22.8 21.1 44.8 16.8 22.6 22.7
* Read as follows: 66.2 per cent of those who stated that they have not registered because it is too complicated are nevertheless willing to register; 22.8 per cent of those who said it is too expensive are ready to register.
The reasons for not registering are similarly distributed across economic sectors and among rural and urban HBs. Cost or complicated procedures were given as reasons for not registering by a very small number of HB owners everywhere. This was the case in Hanoi and Ho Chi Minh City in 2007 (Cling et al., 2010). If the objectives of policies are to facilitate registration, the problem to tackle is not so much the fees or the procedures but rather the lack of information about registering among HB owners.
Most of the owners of informal HBs do not intend to formalise their business. Only about one quarter of them (23 per cent) are eager to register.7 Interestingly, willingness to
for-malise is not related to the number of workers or to the amount of value added or profit of a business. The same proportion of informal HBs owners willing to formalise is found among all kinds of informal businesses. This is verified when the operating conditions of a business (the type of premises in which the business is operated) are considered. Among those with no fixed premises (who are therefore not obliged to register), the proportion which stated that they were prepared to register is similar to those who work at home and even those who have a professional premises.
4.2. advantages of being registered
Willingness to register greatly depends on how HB owners perceive the advantages of formalising their business. More than half of the informal HBs (53 per cent on average, but 58 per cent in rural areas) see no advantage in registering their business.
Access to loans is by far the main advantage of formalisation in the opinion of informal HB owners. 36 per cent of them stated this as an advantage of formalisation, and 24 per cent said this is the main if not the only advantage of formalisation. Other reasons are access to a better marketplace (in markets in particular) and the possibility to sell products to large firms. Formalisation has resulted in facing less corruption for only 13 per cent of the informal HBs owners.
For formal HBs the decision to register is mainly motivated by the obligation to have a business certificate rather than by the benefits they expect to receive as a result. 60 per cent stated that they registered because it is compulsory and 22 per cent said that they were forced to register. Only 17 per cent of the formal HBs registered because they thought that being officially registered would facilitate their business.
4.3. evolution since 2007
Although this study was limited to the two main cities in Vietnam, the evolution of the attitude of informal HBs towards formalisation sheds light on the applicability of bu-siness registration. This is done through three questions we have previously seen: Why have informal HBs not registered? What are the main advantages of registration they foresee? and How many of them are prepared to register?
Although at first glance the reasons for not registering appear to have been stable between 2007 and 2014, with the majority of owners saying registration is not manda-tory in their case, there have been significant evolutions among the other reasons (see Figure 3.7). As seen above, the majority of the owners who said that business registration
0 5 10 15 20 25 30 40 35 Access to loans Access to the best marketplace Able to sell products to large firms
Advertising Face less
corruption
The main advantage One advantage
fIGure 3.6.
whaT Informal hB owners ThInk aBouT BusIness reGIsTraTIon
(PERCENTAGE)
is not mandatory were unaware that the regulations stipulate that most of them should register. Some of them said that they did not know whether or not they were supposed to register. In 2007 these were two reasons given by 90 per cent of the owners (more in Hanoi than in Ho Chi Minh City) who had not registered. In 2014, one of these two reasons was given by three quarters of the respondents in both cities. Awareness of the regulations has increased, but a lot remains to be done. This progress is tempered by the fact that an increasing proportion of informal HB owners (an increase of 10 points of percentage in both cities) stated that they do not want to register anyway.
It is clear that registration is not a problem of cost or red tape. Only a low percentage of the owners in 2007 stated this as their reason for not registering, and there has been no noticeable change since then.
In 2007 less than half of the informal HBs owners could not see any advantage in forma-lising their business (45 per cent in Hanoi and 49 per cent in Ho Chi Minh City). In 2014 the share of owners who did not foresee any advantage had jumped to 59 per cent in both cities. In addition, the advantages have significantly changed (see Table 3.14). While in 2007-2008 the main advantage was facing less corruption (58 per cent in Hanoi and 55 per cent in HCMC), other advantages were greater in 2014, with only 9 per cent
0 % 10 % 20 % 30 % 40 % 50 % 60 % 70 % 100 % 80 % 90 % Other, no answer Don’t want to Too complicated or expensive Not mandatory Don’t know if I have to
2007 2 18 73 2 5 2014 11 1 78 2 8 2007 2 0 7 80 10 2014 10 5 70 3 12
hanoi ho chi minh city
fIGure 3.7.
Trend In The reasons Informal hBs have for noT reGIsTerInG In hanoI
and ho chI mInh cITY BeTween 2007 and 2014 (PERCENTAGE)
of the respondents in Hanoi and 4 per cent in HCM stating that facing less corruption would be the main advantage of formalising their business. Corruption is no longer a major concern for informal HBs owners. In 2014 HB owners were much more concerned with finding a way to expand their business, either by having easier access to loans or by selling to large firms.
The proportion of informal HBs that are prepared to register in order to become formal is relatively stable in Hanoi and Ho Chi Minh City, except in the case of the trade sector in Hanoi, where willingness to register has declined. In Ho Chi Minh City willingness to register has significantly increased in the manufacturing sector (see Table 3.15).
TaBle 3.14.
Trend In The perceIved advanTaGe of reGIsTerInG a BusIness amonG Informal hB owners In hanoI and ho chI mInh cITY In 2007 and 2014
(PERCENTAGE)
hanoi ho chi minh city 2007 2014 2007 2014
Access to loans 10.3 28.1 6.1 45.6 Access to a marketplace 18.0 19.3 20.1 1.8 Sales to large firms 5.8 34.6 4.9 37.7
Advertising 2.2 5.7 1.0 5.5
Face less corruption 57.8 9.8 55.1 4.0
Other 5.9 2.4 12.8 5.4
Total 100 100 100 100
Source: 2007 HB&IS GSO-ISS/IRD-DIAL, 2014/15 HB&IS, VASS-CAF & IRD-DIAL; authors’ calculations
TaBle 3.15.
hBs preparInG To reGIsTer In hanoI and ho chI mInh cITY In 2007 and 2014
(PERCENTAGE OF INFORMAL HB OWNERS)
hanoi ho chi minh city 2007 2014 2007 2014
Manufacturing & construction 18.9 18.6 19.2 27.6
Trade 17.6 9.5 21.0 19.0
Service 14.1 15.3 18.4 20.1
Total 16.3 14.4 19.4 21.8
CONClUSION
An examination of the classical characteristics of informality among HBs and more specifically in the informal sector confirms in some respects that there is a typical informal sector in Vietnam, e.g. small-size businesses, a disregard for state regulations and a lack of modern management tools. It also shows some heterogeneity in terms of the types of premises where businesses are operated and the degree of instability this implies. Likewise, it shows that some characteristics of informality are shared by formal HBs, which are not so different than informal ones in terms of size and respect for regulations.
As elsewhere, the HB sector, and more specifically the informal sector in Vietnam, is characterised by its small size. However, the trend in the size of informal HBs shows that a structural change is at play, as self-employed workers, in particular those in pre-carious trade activities, are being progressively replaced by family HBs.
The characteristics of a premises for an activity reflect the heterogeneity of the HBs. Al-though most of the HB owners operate their business out of their home and own their premises, a segment of the informal sector has either no fixed premises or a precarious occupancy status. One third of the informal HBs have no fixed location from which to run their business, reflecting a high level of instability and precariousness, and around half of the HB owners benefit from a high degree of stability because they operate their business in their home, which they generally own. However, they are restricted in their growth prospects as space in their home is limited. Finally, a minority of the HBs, mostly formal ones, rent a professional premises. Even though that results in an additional cost, these HBs operate in more adequate conditions and have a higher potential for growth as they are not constrained by the limited space in their own home.
About one fourth of the total number of HBs are formal HBs that have a business certificate, suggesting relatively loose administrative links to the state of household businesses in general. While one third of the HBs in urban areas are registered, only 20 per cent of the HBs in rural areas are registered, even though the average size of the HBs in rural areas is not smaller. Rural HBs are even larger on average and more oriented towards manufacturing and construction activities. This suggests a lack of enforcement of the regulations in rural areas.
The main reason why formalisation is not enforced and why informal businesses are not willing to formalise is a lack of information related to the regulations. Indeed, a
large proportion of the informal HB owners think that they are not subject to regis-tration, and this proportion does not vary according to the size of the business or the kind of premises. This clearly shows a lack of knowledge of the regulations, not only among the HB owners but also the local authorities. A lack of incentive to formalise is another obstacle as more than half of the informal HBs see no advantage in re-gistering their business. Only 17 per cent of the formal HBs registered because they thought that being officially registered would facilitate their business. The decision to register is mainly motivated by the obligation to have a business certificate rather than by any advantages they may expect as a result of registering.
In addition to the predominance of informal HBs, a non-negligible share of HBs de-fined as formal do not have the expected attributes of formality. Formal HBs, those which have a business certificate, are required register with the tax department. A little more than two thirds comply with this rule. While formalisation of HBs has had an effect on tax registration, this has not been the case with social security registration. The very low rate of compliance with social security registration requirements, even among formal HBs, aggravates the vulnerability of all the workers in the HB sector. Incentives to comply with social security regulations should be envisaged to improve the social protection of not only the informal sector but also workers at formal HBs. Finally, most of the HBs do not keep books or records of their activities, not even the formal HBs. In that respect formal HBs are closer to informal HBs than formal enter-prises. If bookkeeping is an indicator of the quality of management of a business, then it can be said that formal as well as informal HBs in Vietnam have weak management. This calls for policy aimed at improving the accounting of small businesses, especially formal ones, by training the owners and by implementing some tools adapted to the conditions of operation at these businesses.
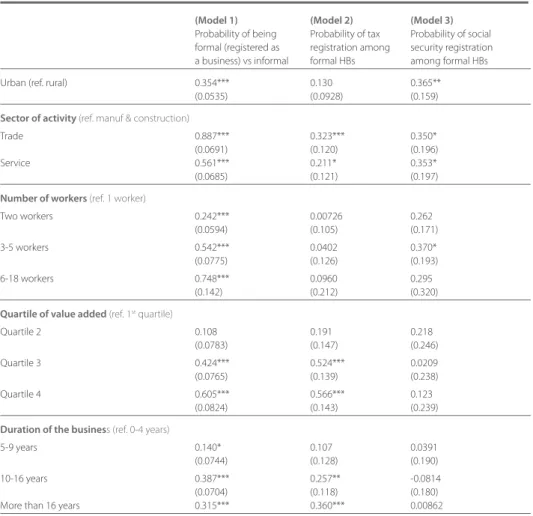
appENDIx - DETERmINaNTS Of REgISTRaTION Of HBS
IN VIETNam
This section applies the probit regression model to identify factors behind the deci-sion to register or not among household businesses in Vietnam using data from the 2014/15 HBIS. The dependent variables are the binary response showing whether an HB has registered its business or not for all HBs (Model 1), whether an HB has complied with tax registration requirements or not (for formal HBs only) (Model 2), and whether an HB has complied with social security registration requirements or not (for formal HBs only) (Model 3). In order to identify the determinants of why owners decide to register their business or not, the marginal effects of all explanatory variables X on the probability of registering is calculated. This corresponds to a change in the probability of registering due to an increase of one unit of the explanatory variable from the ba-seline or reference group.
TaBle 3.a deTermInanTs of BusIness reGIsTraTIon, TaX reGIsTraTIon and socIal securITY reGIsTraTIon
(model 1) (model 2) (model 3)
Probability of being Probability of tax Probability of social formal (registered as registration among security registration
a business) vs informal formal HBs among formal HBs
Urban (ref. rural) 0.354*** 0.130 0.365**
(0.0535) (0.0928) (0.159)
sector of activity (ref. manuf & construction)
Trade 0.887*** 0.323*** 0.350*
(0.0691) (0.120) (0.196)
Service 0.561*** 0.211* 0.353*
(0.0685) (0.121) (0.197)
number of workers (ref. 1 worker)
Two workers 0.242*** 0.00726 0.262 (0.0594) (0.105) (0.171) 3-5 workers 0.542*** 0.0402 0.370* (0.0775) (0.126) (0.193) 6-18 workers 0.748*** 0.0960 0.295 (0.142) (0.212) (0.320)
Quartile of value added (ref. 1st quartile)
Quartile 2 0.108 0.191 0.218 (0.0783) (0.147) (0.246) Quartile 3 0.424*** 0.524*** 0.0209 (0.0765) (0.139) (0.238) Quartile 4 0.605*** 0.566*** 0.123 (0.0824) (0.143) (0.239)
duration of the business (ref. 0-4 years)
5-9 years 0.140* 0.107 0.0391
(0.0744) (0.128) (0.190)
10-16 years 0.387*** 0.257** -0.0814
Note: Standard errors in parentheses; *** p<0.01, ** p<0.05, * p<0.1 Source: 2014/15 HB&IS, VASS-CAF & IRD-DIAL; authors’ calculations
Type of premises (ref: no fixed premises)
At home 0.941*** 0.113 -0.718***
(0.0839) (0.177) (0.218)
Professional premises 1.125*** 0.197 -0.737***
(0.0841) (0.176) (0.216)
motivation (ref: no job as wage worker or farmer)
Higher income 0.0766 0.194* 0.284
(0.0729) (0.115) (0.179)
Independence -0.199*** 0.0190 0.325
(0.0770) (0.132) (0.206)
Family tradition or other -0.0835 0.262** 0.250
(0.0665) (0.112) (0.182)
Female owner -0.149*** 0.00388 -0.0191
(0.0552) (0.0926) (0.135)
education level of the owner (ref. no diploma/certificate)
Primary 0.229*** 0.129 0.360* (0.0614) (0.108) (0.184) Lower secondary 0.429*** 0.270** 0.420** (0.0663) (0.113) (0.184) Upper secondary 0.572*** 0.363* 0.141 (0.125) (0.187) (0.284) Superior 0.130** 0.0922 0.0980 (0.0570) (0.0936) (0.138) Constant -2.968*** -0.891*** -2.218*** (0.134) (0.261) (0.400) Observations 3,406 1,028 1,028
wOrkers IN The INfOrmaL secTOr:
whO are They aND whaT are TheIr
wOrkING cONDITIONs?
Nguyen Thu hien
As mentioned in Chapter 3, operating conditions in the informal sector are poor and insecure. In addition, Vietnam has experienced spectacular development over the past ten years. Therefore, how these precarious operating conditions affect employment and labour conditions in this sector and whether improvement of working conditions has come with this development warrants analysis. Based on HBIS surveys, this chapter complements Chapter 2 by providing an in-depth overview of the working conditions in the HB sector. With regard to the objective of inclusive growth, it aims to understand the source of vulnerability and the precariousness of the wor-kers in this sector and to identify the groups of worwor-kers that are the most vulnerable in order to ensure better protection and stability of the labour force.
This chapter includes three sections. Section 1 describes the socio-demographic characteristics of the workers in the informal sector and calls into question the common perception of workers in the informal sector, in particular with regards to the gender, migratory status, seniority and qualifications of the workers. Section 2 presents an overall picture of the working conditions in the informal sector. As shown in Chapter 2, although this sector is an important source of employment and it generates income for many people, the labour conditions are precarious and the workers lack protection. The HB&IS survey allows us to go further in the analysis of these conditions. In particular, it provides new knowledge about the earnings of workers in the informal sector, and it yields new insights into the lack of formal gua-rantees in this sector by considering the relationship between the owner and the employees as a substitute for formal arrangements. Section 3 analyses the trend in working conditions observed in Hanoi and Ho Chi Minh City between 2007 and 2014 and highlights a mitigated improvement of these conditions.
1.
wHO aRE THE wORkERS IN THE HOUSEHOlD BUSINESS
aND INfORmal SECTORS?
This first section presents an overall picture of the socio-demographic characteristics of the workers in the informal sector, including gender, seniority, migratory status, education and training.
1.1. Gender
As shown in Chapter 2, women are not overrepresented in the HB sector compared to the rest of the labour force: They account for 46 per cent of the labour force in the informal sector and 45 per cent in the formal sector. This section presents in greater detail the distribution of female workers in the HB sector to find out which indus-try or position attracts the most female workers. As shown in Figure 4.1, women are the spouse of the owner in the same proportion as men, but women are more likely to be own-account workers than men, and they are wage workers less often than men. Among formal HBs, they are slightly less likely to be employers than men as well. Although working on one’s own-account is usually considered to be vulnerable employment,1 it provides an important source of livelihood for women since working
in this sector gives them more flexibility to fulfil family obligations. They can work at home or at a market. Over a quarter of the female informal HB owners say that they decided to work on their own account in order to be able to reconcile family and pro-fessional life, and this was the case for only 6 per cent of the men.2
Figure 4.1 shows that women are much more represented in the trade sector (espe-cially retail trade) and food services than men. In contrast, there are very few women in the transport and construction sectors, and they are underrepresented in the other services and in the formal manufacturing sector.
1. According to the ILO, Key Indicators of the Labour Market 03 (KILM03), although we will see in this chapter that this does not hold true in the HB sector when compared with the status of wage workers. 2. For further information, see Chapter 11.
1.2. migratory status
The share of migrants at urban informal HBs is very small, only 3 per cent of the total number of workers, including the HB owners. The urban manufacturing and construc-tion sector has the highest proporconstruc-tion of migrants, but the figure is still modest (5 per cent at informal HBs and 8 per cent at all HBs). The proportion of migrants at formal HBs is higher than that at informal ones, but it is only 7 per cent in urban areas. This finding is interesting as it goes against findings3 from other contexts which show that
the urban informal sector mainly consists of migrants from rural areas. That is not the case in Vietnam.
3. Source: Urban Informal Sector in Asia: An annotated bibliography, Geneva, International Labour Office, 1992 (International Labour Bibliography, No. 13).
0 % 10 % 20 % 30 % 40 % 50 % 60 % 70 % 100 % 80 % 90 % Informal Male Informal Female Formal Male Formal Female Informal Male Informal Female Formal Male Formal Female Employer Family helper Spouse Own-account worker Apprentice Wage worker Construction Other services Transport Manufacturing Trade Rest. & Accom. fIGure 4.1.
dIsTrIBuTIon of female and male workers BY joB sTaTus and IndusTrY
(PERCENTAGE)
1.3. seniority
The average seniority of workers at HBs is high, as was the case in 2007 in Hanoi and Ho Chi Minh City (Cling et al. 2010). Over one third (39 per cent) of the informal HB workers had more than ten years’ seniority at their HB, and only 4 per cent had been there less than one year. Seniority is correlated to job status.
Employers rank first with an average seniority of 11.5 years at informal HBs and 12.4 at formal ones, followed by own-account workers at 10.6 years. Both the long duration of HBs (see Table 4.2) and the fact that they rarely change ownership explain the high seniority for these categories of workers. The spouse and family helpers have high seniority as well, showing that they generally help the owner from the start of the business. On average, the spouse joins the business one year after it starts up while other family workers join it after three years. This suggests that family helpers are not an adjustment factor for the business activity. On the contrary, they join the business as soon as it reaches the critical level of activity, and they then become a structural element of the business. This illustrates the specific way that family businesses (which constitute 37 and 43 per cent of the informal and formal HBs respectively) function in the context of Vietnam, as described in Chapter 3.
High seniority was not observed for wage workers. They only work at an HB for around 4 years. Two reasons may explain the short duration of wage workers at HBs. First, HBs have to wait several years before being able to recruit wage workers. Second, wage workers are recruited or fired according to the needs of the business. This second expla-nation is the most convincing because only 18 per cent of the informal HBs with wage
TaBle 4.1.
share of mIGranTs In The hB secTor BY IndusTrY and formalITY sTaTus
(PERCENTAGE)
migrant (%) rural urban Total Industries
Manufacturing & construction 2.3 7.7 4.3
Trade 0.9 3.6 2
Service 1.5 3.7 2.7
Informal HBs 1 2.9 1.7
Formal HBs 3.4 7.1 5.5
All HBs 1.6 4.7 2.9
workers and 24 per cent of the formal ones have experienced a growth of their work-force since their start-up (see Chapter 6), which shows that most of the HBs with wage workers do not have to wait for several years before being able to hire wage workers.
1.4. education and training
As shown in Chapter 2, educational attainment in the informal sector is found to be significantly lower than in the other institutional sectors. Only one fifth of the informal HB workers have completed secondary education (see Figure 4.2). Moreover, more than half of them did not go further than primary education. Generally, educational attainment among formal HBs is higher than among informal ones for all kinds of workers (see Figure 4.2). On average, the proportion of workers who have completed upper secondary education and work at formal HBs is twice that of those who work at informal HBs (38 per cent and 20 per cent respectively). In addition, only one third of the formal HB workers and more than half of the workers at informal HBs have only a primary education or less.
Interestingly, wage workers have almost the same level of education as the owners or their spouses. In contrast, family helpers, who constitute 8 per cent of the wor-kers at HBs, are on average more educated than the others, especially in the informal sector: The proportion of family helpers having completed secondary education is 14 and 9 points of percentage higher than for other workers at informal and formal
TaBle 4.2.
senIorITY of workers and duraTIon of hB, BY joB sTaTus (YEARS)
job status Informal hBs formal hBs
Own-account worker 10.6 10.6 Employer 11.5 12.4 Spouse 9.0 10.5 Wage worker 4.2 3.6 Family helper 8.4 9.3 Total 9.2 8.2 hB duration 1 worker 12.0 10.4 2 workers 9.9 11.8 3-5 workers 11.6 12.8 6-18 workers 12.7 12.0 Total 11.2 11.6
HBs respectively. This can be explained by the upward mobility in education from one generation to the next. Indeed, two thirds of the family helpers (67 per cent) are the owner’s children. The majority of these children have a higher level of education than the owner and almost half of them have completed upper secondary school. On the one hand, this may be viewed as low prospects for the children of HB owners. On the other hand, this may be interpreted as an opportunity for HBs to benefit from new skills and potential to develop their business. The second interpretation should be preferred as a significant share of these children have another main job and only help to manage the family business. Nearly one third of them have a secondary job and two thirds of them are part-time workers.4
4. Part-time workers are defined as workers who work less than 35 hours per week (see section 2.5 of this chapter).
Owner spouse wage worker family helper Total IhB
53.6 19.4 56.1 18.5 52.2 17.5 52.4 20.4 40 33.3
Primary or less >= upper secondary
Informal hBs
Owner spouse wage worker family helper Total fhB
formal hBs
34.6 37.7 32.7 34.2 34.4 38.1 33.2 37.9
26.7 47.5 fIGure 4.2.
level of educaTIon BY joB sTaTus and formalITY sTaTus
(PERCENTAGE OF WORKERS)