Université de Montréal
A test of articular modelling in response to load in human upper limbs
Par Karyne Rabey
Département d’ Anthropologie Faculté des Arts et Sciences
Mémoire présenté à la faculté des études supérieures En vue d’obtention du grade de M.Sc. en Anthropologie
ra’J2CCflf;YA
)COflp
Décembre, 2006
Qg7 S © Karyne Rabey, 2006
:
Direction des bibliothèques
AVIS
L’auteur a autorisé l’Université de Montréal à reproduire et diffuser, en totalité ou en partie, par quelque moyen que ce soit et sur quelque support que ce soit, et exclusivement à des fins non lucratives d’enseignement et de recherche, des copies de ce mémoire ou de cette thèse.
L’auteur et les coauteurs le cas échéant conservent la propriété du droit d’auteur et des droits moraux qui protègent ce document. Ni la thèse ou le mémoire, ni des extraits substantiels de ce document, ne doivent être imprimés ou autrement reproduits sans l’autorisation de l’auteur.
Afin de se conformer à la Loi canadienne sur la protection des renseignements personnels, quelques formulaires secondaires, coordonnées ou signatures intégrées au texte ont pu être enlevés de ce document. Bien que cela ait pu affecter la pagination, il n’y a aucun contenu manquant.
NOTICE
The author of this thesis or dissertation has granted a nonexciusive license allowing Université de Montréal to reproduce and publish the document, in part or in whole, and in any format, solely for noncommercial educational and research purposes.
The author and co-authors if applicable retain copyright ownership and moral rights in this document. Neither the whole thesis or dissertation, nor substantial extracts from it, may be printed or otherwise reproduced without the author’s permission.
In compliance with the Canadian Privacy Act some supporting forms, contact information or signatures may have been removed from the document. While this may affect the document page count, it does flot represent any loss of content from the document.
Ce mémoire intitulé:
A test of articular modelling in response to load in human upper lirnbs
Présenté par: Karyne Rabey
a été évalué par un jury composé des personnes suivantes:
Isabelle Ribot président-rapporteur Michelle Drapeau directeur de recherche Bernard Chapais membre du jury
Abstract
It has long been recognized that mechanical loading plays an important role in skeletal development. Articulations were often considered to be less responsive to the mechanical environrnent and be much more constraint genetically than the long bone diaphysis. However, recent animal studies have shown that mechanical loads do influence joint architecture. Stiil, the contribution of the mechanical environment during bone growth to the variability of joint surface size and shape is incompletely understood, particularly in humans. This project tests the hypothesis that joint surfaces are, in part, shaped by the mechanical environment. Most humans use preferabÏy one arm over the other and as a resuit, have stronger muscles on the preferred side. Specifically, this project tests the hypothesis that the side that has larger muscle markings will have joints that are modelled to accommodate Ïarger Ioads by being larger or shaped differently. Least-square regression was used to evaluate the influence of muscle size on the upper-limb articulations’ shape and size on a sample of 108 humans from pre-industrialized populations. Resuits show that, unlike what was expected upper-limb articulations are rarely asymmetrical relative to muscular asymmetry. Only a few left-right comparisons support the hypothesis that the side with larger muscle markings will have joints that are larger or shaped differently. These unexpected resuits suggests that right-lefi differences in the articulations may be very small or the sample too smalÏ to observe any significant differences in the upper-limb articular morphology.
Résumé
Il est reconnu depuis longtemps que les charges mécaniques jouent un rôle important sur le développement osseux. Les articulations ont souvent été considérées moins malléables à l’environnement mécanique et pltis contraintes génétiquement que les diaphyses des os longs. Cependant, des études récentes sur des animaux ont démontré que les charges mécaniques ont une influence sur l’architecture des articulations. Malgré ceci, la contribution de l’environnement mécanique durant le développement osseux à la variabilité de la taille et de la forme des surfaces articulaires n’est pas complètement comprise, surtout chez les humains. Ce projet teste l’hypothèse selon laquelle les surfaces articulaires sont en partie formées par l’environnement mécanique. La plupart des humains utilisent préférentiellement un bras plutôt que l’autre et ont donc des muscles plus forts sur le côté le plus utilisé. De façon plus spécifique, ce projet teste l’hypothèse selon laquelle le côté ayant de plus grandes insertions musculaires aura des articulations qui seront modelées pour accommoder les plus grandes charges, en étant soit de taille ou de forme différente. Des régressions linéaires sur un échantillon de 108 humains de populations préindustrielles ont été utilisées afin dévaluer l’influence de la taille des insertions musculaires sur la taille et la forme des articulations du membre supérieur. Contrairement à ce qui était attendu, les résultats montrent que les articulations du membre supérieur sont rarement asymétriques relativement à l’asymétrie musculaire. Seulement quelques comparaisons droite-gauche supportent l’hypothèse que le côté avec les plus grandes insertions musculaires aura des articulations de taille et/ou de forme différente. Ces résultats inattendus suggèrent que les différences droite gauche dans les articulations sont peut-être très faibles ou que l’échantillon est trop petit pour pouvoir observer des différences significatives dans la morphologie des articulations du membre supérieur.
Mots clés: Anthropologie, biologie, développement, articulations, insertions musculaires.
Table of contents
Abstract iii
Résumé iv
Table of contents y
List of figures vi
List of tables viii
Acknowledgements x
Chapter 1: Introduction 1
1.1 Introduction 1
1.2 Chondral modelling theory 2
1.3 Mechanotransduction 5
1.4 Muscle attachments 8
1.5 Hypotheses to be tested 10
Chapter 2: Materials and methods 16
2.1 Materials 16 2.2 Methods 17 2.3 Analysis 23 Chapter 3: Results 25 3.1 Shoulder; size 25 3.2 Elbow; size 26 3.3 Wrist; size 31 3.4 Hand; size 32 3.5 Shoulder: shape 32 3.6 Elbow; shape 33 3.7 Wrist; shape 36 3.8 Hand; shape 37 3.9 Surnmary 38
Chapter 4: Discussion and conclusion 40
4.1 General discussion 40
4.2 Shoulder 40
4.3 Elbow 41
1.3.] Distal humeras 42
1.3.2 FroximaÏ ziÏna and radius 43
4.4 Wrist 45
4.5 Conclusion 45
List of figures
Figure I: Representation of adjoining joint surfaces to demonstrate the problems of incongruence and lack of smoothness. A raised area, indicated by the arrow, concentrates the load over a small portion of the joint surface. b increase congruence and smoothness and reduce large loads per unit, the growth will stop where there is high stress (raised area). Where there is little stress in areas around the raised surface, growth will be stimulated. This will alter the joint curvature and maintain a normal kinematic pathway (from Plochocki, 2003)..
Figure II: How mechanical use and disuse may regulate bone modelling. Nornial mechanical use would maintain levels of osteoblast and osteoclast activation. Increased fluid ftow in lacunae and canaliculi from overuse will increase osteocyte stress levels and osteoblast activation. Lower levels of fluid flow from disuse increase osteoclast activation and/or decrease activation of
osteoclast suppressors (from Plochocki, 2003) 7
Figure III: Muscle attachment sites of the upper limbs (from Nordin and
Frankel, 2001) 9
Figure IV: Example of muscle contraction shown by the deltoideus (above-lefi) and the pectoralis major (below-right) on the shoulder joint causing the head of the humerus to compress the glenoid surface of the scapula. The black arrow represents the medially directed load from the muscular contraction acting on the shoulder articulation Figure shows anterior view of the shoulder (from
Sénécal, 2003) 12
Figure V: Example of the muscle contractions caused by the flexors and extensors ofthe forearm acting on the elbow articulation (from Platzer, 2001).
Figures show anterior views ofthe elbow 13
Figure VI: Schematic illustration showing a strong medial keel on the eÏbow
articulation (from Schmitt, 2003) 13
Figure VII: Pronation (rotation ofthe hand laterally) and supination (rotation of the hand medially) movements of the foreann (from DePuy Orthopaedics,
2005) 14
Figure VIII: Points taken on the shoulder, lateral view. The superior (1), middle (5) and inferior (3) points fonn the SI angle and the anterior (2), middle (5) and posterior (4) points form the AP angle 19 Figure IX: Points taken and angles calculated at the humero-ulnar articulation, anterior view. A - Inferior medial angle (points 1, 3, 2), B - Inferior lateral
angle (points 1, 3, 4), and C - Medial angle ofthe humeral trochlea (points 2, 3,
Figure X: Points taken at proximal surface of the radius, superior view. The medial (2), middle (5) and lateral (4) points form the ML angle and the anterior (1), middle (5) and posterior (3) points form the AP angle 20 Figure XI: Points taken at the distal surface of the radius, inferior view. Anteriorly the medial (3), middle (6) and lateral (1) points form the ML angle 1 and ML angle 2 is posteriorly (1, 6, 4). The anterior (2), middle (6) and
posterior (5) points form the AP angle 20
Figure XII: Points taken at the proximal surface ofthe first metacarpal, superior view. The medial (2), middle (5) and lateral (4) points form the ML angle and the anterior (1), middle (5) and posterior (3) points form the AP angle 21 Figure XIII: Regression between size of the humeral head and the size of the
greater tubercle 26
Figure XIV : Regression between the size ofthe SI height ofthe capitulum and
the size ofthe lateral epicondyle 27
Figure XV: Regression ofthe size ofthe SI height ofthe capitulum and the size
of the insertion of the pronator teres muscle 28
Figure XVI: Regression between the size of the trochlea and the size of the
olecranon 28
Figure XVII: Regression between the size of the radial head and the size of the
radial tuberosity 30
Figure XVIII: Regression between the size of the radial notch and the size of
the insertion of the silpinator muscle 31
Figure XIX: Regression ofthe shape values ofthe inferior lateral angle (B) of
the hurneral trochlea and ulnar tuberosity 34
Figure XX: Regression of the shape values of the inferior lateral angle of the humerai trochlea (B) and the radial tuberosity 34 Figure XXI: Regression ofthe shape values ofthe AP angle ofthe radial head
and the olecranon 36
Figure XXII: Regression of the shape values of the ML angle 2 of the distal radius and the insertion oftheabductorpotÏicis Ïongtts muscle 37
List of tables
Table 1: Study sample 16
Table 2: Linear measurements 17
Table 3: Muscle attachments 21
Table 4: Measurement enors for the articular measurements ofthe left and right sides included in this study (n= 3 individuals) 22
Table 5: Measurement errors for the muscle site measurements of the right and left sides included in this study (n= 3 individuals) 23
Table 6: Correlation coefficients and significance ofthe regressions ofarticular size and muscle attachment size at the shoulder 25 Table 7: Conelation coefficients and significance of the regressions of articular size and muscle attachrnent size at the distal humerus 27 Table 8: Correlation coefficients and significance of the regressions of articular size and muscle attachment size at the proximal ulnar measurements 29 Table 9: Correlation coefficients and significance ofthe regressions ofarticular size and muscle attachment size at the proximal ulna and radius 30 Table 10: Correlation coefficients and significance of the regressions of articular size and muscle attachment size at the wrist 31 Table 11: Correlation coefficients and significance of the regressions of articular size and muscle attachment size at the hand 32 Table 12: Correlation coefficients and significance of the regressions of articular shape and muscle attachment size at the glenoid cavity 32 Table 13: Correlation coefficients and significance of the regressions of articular shape and muscle attachment size at the distal humerus 33 Table 14: Conelation coefficients and significance of the regressions of articular shape and muscle attachment size at the radial head 35 Table 15: Correlation coefficients and significance of the regressions of articular shape and muscle attachment size at the distal radius 36 Table 16: Conelation coefficients and significance of the regressions of articular shape and muscle attachment size at the hand 37
Table 17: Summary of the resuits from the regressions where p 0.1 and r
Acknowledgements
I wouid like to thank my supervisor Dr. Michelle Drapeau for ail the time and encouragement she has given me the past two years. I am very grateful of ail the comments, critiques, reflections and discussions we shared. I learned so much under her supervision. it was a great experience.
Thanks are also due to Dr. Jerome Cybulski, Janet Young and Stacey Girling-Christie from the Canadian Museum of Civilization for the help and support they gave me while I was working on the collection in their care. Special thank goes to Dr. Jerome Cybulski for all the extra time he took to assure I had everything I needed during my stay at the museum. I also want to thank the Inuit Trust Heritage for granting me permission to study the priceless Nunavut collection.
I would aiso like to express my gratitude to my parents, Lise and Robert, and my brother Alan for keeping up with me ail these years. Ail of my famiiy, Gatane, Aldo, Maxime, Marc, Marika and Jocelyne, you’ve encouraged me to go ail the way and to keep doing what I love no matter what. Each and every one of you has participated in your own way in my joumey! Special thanks go to William and Linda for giving me shelter while I visited the museum.
A big thank you also goes to ail my ftiends who have helped and supported me through the good and the tough times. Marie-Eve, Claudiane, Sabrina, Constance, Catherine. Sadia; you guys have been there from the beginning, and to all of you that came about in the last year at the lab; Marie Christine and Claude, you have been wonderful in your time and encouragements. I can not forget ail those friends that are flot at the University but have also contributed in keeping me sane, you guys know who you are! And a special thank you to “Dude” for being the best person in the world and keeping up with me.
Last, but certainiy not least, I would like to thank Dr. Bernard Chapais and Dr. Isabelle Ribot for the comments and critiques you have given me on my research and future decisions.
1. 1 Introduction
It is recognized that mechanical loading plays an important role in skeietai deveioprnent (Martin et ai., 199$; Frost, 1999; Hamrick, 1999, 2000; Carter and Beaupré, 2001; Lieberman et ai., 2001; Nordin and Frankel, 2001; Plochocki. 2004, 2006). Bone is a dynamic tissue in constant modification, so it is ofien modelied by the activities practiced by an individuai. Given this piasticity, bone is an invaluable tool for the study of evolution, human behaviour, etc. For years, rnany researchers have concentrated their efforts on the cross section of the bones to understand bone modeiling and remodelling, because it has long been accepted that during growth, cross section of the diaphyses responds well to mechanical Ioads. Long bone diaphyses grow thicker and stronger as bone length, body mass and loading increase (Ruif et ai., 1994; Carter and Beaupré, 2001; Pearson and Lieberman, 2004). Since long bones modify their shape to better resist bending, twisting and compressions, then the cross-sectionai geometry of an animai’s bones is a good indicator of the mechanical forces induced to the animal and thus a reasonable reflection of habituai activities (Ruff, 2002a). On the other hand, articulations were ofien considered to be iess responsive to the mechanicai enviroment and be rnuch more constraint geneticaiiy (Lieberman et al., 2001).
However, recent animai studies (Frost, 1999; Hamrick, 1 999a, b; Carter and Beaupré, 2001; Piochocki, 2006) have shown that mechanical loads do influence joint architecture. Frost (1999) observed that compared to congenitaily or neonatally paraiyzed limbs, joints in normai iimbs deveiop greater diameters, greater radii of curvature and surface area, thicker capsules and ligaments and more subchondrai bone to support their articular cartilage. Those differences reveai the effects of postnatal mechanicai usage on a growing joint’s design and biologic activities. Piochocki (2006) found that exercise induced mechanical ioading affected the size, shape, and the distribution of joint tissue. He concluded that the mechanicai regulation of articuiar
take in vivo adaptations that provide greater resistance against larger ioads. Shape of the articuiar surface is therefore shown to be modified during growlh in response to ioads, inciuding those incurred by muscular contractions, in order to reduce the risk of damage to the articular cartilage (Frost, 1999; Hamrick, 1999b; Carter and Beaupré, 2001; Piochocki, 2006). Stiil, few studies (e.g., Tankakura et ai., 1986) have demonstrated joint piasticity in humans. The contribution of the mechanical environrnent during bone growth to the variability ofj oint surface size and shape is stiii incompietely understood.
This project tests the hypothesis that joint surfaces are, in part, shaped by the mechanical environment. It tests whether individuais with larger muscle markings are characterized by differently shaped joints or proportionaiiy larger joints. Most humans use preferabiy one arm over the other and as a resuit, have stronger muscles on the preferred side. SpecificaÏly, this project wiil test the hypothesis that the side that has larger muscle markings wiii have joints that are modeiled to accomniodate larger ioads. For each individual, the joint should be larger and/or of a shape that better resist loads on the preferred side when compared to the other side. The analysis of joint form and size is a key component to anthropological investigations such as the biomechanics of bones and articular shape in evoiutionary and prehistoric contexts. A thorough understanding of the determinants that shape joints is essential for accurateiy interpreting the bioiogy, behaviour, and evolutionary history of humans (Piochocki, 2003). It is therefore necessary to better understand the relationship between joint form and the mechanical environment.
1.2 Chondral rnodeÏÏing theory
Carter and Beaupré (2001) explain how muscular movements on the skeieton are essential to have the desired structure of the articular surfaces right from the begiiming of ontogeny. The absence of muscular activity in the developing chick embryo has been shown to cause distortion of skeletai rudiments, absence of joint cavities and fusion (fibrous, cartilaginous, or
osseous) across the joint regions. Tensile forces from muscles must create high stresses in the interzones (sites of future bone articulations). This will eventually lead to cleavage, joint motion and cavitations. Movement at the
j
oint therefore, helps to control and guide the contour of thej
oint surface so that it develops a kinematically efficient shape (Frost, 1999: Hamrick, 1999a, b; Carter and Beaupré, 2001). Mechanical loading associated with the postnatal developrnent of posture and locomotion may provide an important stimulus for the progression of ossification and the formation of articular cartilage in the epiphyses of growing mammals. Frost (1994, 1999), then Hamrick (1999b) looked at the process by which, afier formation of the joint cavities, limb joints maintain congruence.The chondral modelling theory (Frost, 1994, 1999; Hamrick, 1999b) tries to explain the relationship between mechanical enviromrient and joint fomt The theory proposes that the mechanical loadings to which lirnb joints are subjected during growth affect cartilage proliferation at the articutar surface, which strongly influences adult joint conformation. The theory argues that joint size, shape and congruence are maintained throughout mammalian postnatal ontogeny, in part, by the regulation of cartilage growth in articular regions by mechanical stress. Chondral modelling serves as a physiological mechanism that maintains a normal kinematic pathway through joints while preventing excessive loads that could irreparably damage articular cartilage (Frost, 1994, 1999; Hamrick, 1999b; Plochocki, 2003).
frost’s (1994, 1999) theory proposes that cartilage growth will cease in a region bearing excessive compressive load and increase in adjacent less loaded regions (f igure I). The direction of the cartilage growth and alignrnent of cartilage layers will always reflect the magnitude and direction of prevailing loads at the articular surface.
Figure I: Representation of adjoining joint surfaces to demonstrate the problems of incongruence and lack of smoothness. A raised area, indicated by the arrow, concentrates the load over a small portion of the joint surface. To increase congruence and smoothness and reduce large Ioads per unit, the growth will stop where there is high stress (raised area). Where there is littie stress in areas around the raised surface, growth will be stïmulated. This will alter the joint curvature and maintain a normal kinematic pathway (from Plochocki, 2003).
It is the relative magnitude, frequency, and distribution of hydrostatic pressure that regulate the metabolic activity of chondrocytes and flot compressive loading per se. frost’s theory is non-specific regarding the role of particular tissue layers in the modelling process and provides few specific details as to how mechanotransduction might regulate articular cartilage growth and development (Hamrick, 1 999b).
Hamrick (1999b) expanded on Frost’s original theory and explained further the mechanisms that facilitate functional integration in the developing mammalian locomotor system. The chondral modelling theory makes predictions based on the premise that hydrostatic compressive stress from the mechanical loading of cartilage affects local bone growth at the articular surface through the transduction of mechanical energy. The response will vary as stress, magnitudes, frequencies, and orientations vary throughout ontogeny.
The predictions ofthe theory are:
(1) Peak levels of hydrostatic pressures in articular cartilage increase between birth and skeletal maturity because articular cartilage thickness decreases, force generation increases, and relative joint size decreases.
(2) The articular cartilage of growing mammals responds to this ontogenetic increase in joint stress by a process of chondral modelling: chondrocyte (mature chondroblast ceil) division and cartilage matrix synthesis in response to changes in tissue’s mechanical environment.
(3) Hydrostatic pressure at a certain range and frequency stimulates chondrocyte division and matrix synthesis. The importance of load ftequency and periodicity in stimulating bone modelling and remodelling is emphasized.
(4) Chondrocyte metabolism can also be inhibited by loads that are static, infrequent, weak, or excessive.
Evidence from in vitro and in vivo studies suggests that rnechanotransduction is an important determinant of articulation growth and form. The regulation of cartilage growth by mechanical load is a primary mechanism by which extrinsic factors influence limb joint morphogenesis. While mechanotransduction (see below) explains the cellular physiological effects of mechanical stress on chondrocyte maturation, the chondral modelling theory explains the relationship between gross joint design and joint function throughout postnatal skeletal growth. This makes an understanding of chondral modelling useful for interpreting the significance of joint shape variation and understanding the evolutionary history, prehistory and adaptations of humans and other species (Plochocki, 2003)
1.3 Mechanotransduction
Mechanotransduction is the biological process of converting mechanical energy into electrical and biomechanical signais and by which the physiological adaptation of bone and cartilage to the mechanical environment occurs. These
are stili flot fully understood today, but a brief description of the state of knowledge follows. Osteocytes (mature bone ceils) act as mechano-sensors (cells that sense applied mechanical loadings). Osteocytes lie in fluid-fihled cavities (lacunae) in bones and extend processes outward through canaliculi (small chaimels). When bone is Ioaded, the direct deformation of bone celis is extremely smalL However, interstitial fluid flow in the canais exerts fluid shear stresses on the osteocyte surface sufficient to kick off a biomechanical response (Figure II). Osteocytes seem to be sensitive to pressure from fluids in the lacunae and canaliculi and express genes for bio-signais that affect osteoblasts (bone-forming celis responsible for synthesizing and depositing bone material ofien concentrated beneath the periosteum) and osteoclast (celis responsible for the resorption or removal of bone tissue) activity. Mechanicaliy loaded, these bone ceils express mRNA for insulin growth factor-1 (IGF-l) that promote bone formation and stimulates osteociast and osteoblast differentiation. As a resuit, mechanical stresses affecting osteocytes trigger the process of bone modeliing and remodelling. Osteoclasts and osteoblasts are activated and then alter the internai structure of bone in response to mechanical loading by locally resorbing and depositing bone. Through this physiological mechanisrn, bone can adapt to the mechanical environment.
In cartilage, chondrocytes act as mechano-sensors. They alter their biological activity in response to mechanical, osmotic and fluid stress. The compÏete process of the transduction of mechanical stress in cartilage is not weÏl understood due to complex properties of the constituents in the extracellular matrix. However, it seems that osmotic pressure provides the mechano-electrochemical stimuli that initiates the physiological response and aiters chondrocytes metabolic activity. Chondrocytes are responsible for bone growth and produce extracellular matrix that gives cartilage its mechanical properties (Plochocki, 2003).
Figure II: How mechanical use and disuse may regulate bone modelling. Normal mechanical use would maintain levels of osteoblast and osteoclast activation. Increased fluid flow in Iacunae and canaliculi from overuse wilI increase osteocyte stress levels and osteoblast activation. Lower levels of fluid flow from disuse increase osteoclast activation and/or decrease activation of osteoclast suppressors (from Plochocki, 2003).
Normal mechanical use
4
Fluid fihled j canaliculi Fluid flow increase leading to the activation of osteoblasts f luid llow decrease leading to the activation of Mechanical overuse‘u
4-Mechanical disuseB
osteoclastsThe mechanosensitivity of chondrocytes allows local bone growth rates to adapt bone and joint form to the mechanical environment. The process is site specific, responding to the characteristics of recent habituai local loads. Chondral modelling affects the longitudinal growth of bones from cartilage at the growth plate, as well as articular surface growth. Joint shape and size can be altered whlle joint congruence is maintained to prevent damage of articular and underlying bone. Through chondral modelling the hydrostatic compressive stresses exerted on chondrocytes during cartilage compression influence joint conformation. Mechanotransduction regulates the rate of chondrocyte maturation and metabolism, affecting local rates of bone growth adjacent to cartilage at the growth plate and articular surfaces (Plochocki, 2003).
1.4 Muscle attachments
Muscle attachment sites are often distinct skeletal markings and bony projections that occur where a muscle, a tendon, or a ligament inserts into the blood-supplying periosteum and underlying bony cortex (Hawkey and Merbs, 1995; Hawkey, 1998; Wilczak, 1998a, b; Knusel. 2000; Eshed et al., 2003; Weiss 2003, 2004; Zumwalt, 2005; Molnar, 2006;). These attachment sites, also called entheses, are the main visible records of muscles on the skeleton and may be an important record of human behaviour (Figure III).
It has been assumed in biological anthropology that the expression of muscle attachment sites is indicative of the relative size, strength, or activity of the attaching muscles (Hawkey and Merbs, 1995; Hawkey, 1998). When muscle insertion sites are subjected to stress, blood flow is increased, which stimulates bone forming celis that results in bone hypertrophy and increased size of musculoskeletal markers (Hawkey, 1998; Wilczak, 1998a, b). These markers can be used by anthropologists and paleontologists to interpret evolutionary history, prehistory, locomotor and manipulative adaptations of humans and other species as well as occupational pathologies, since muscle attachments are the result of continued muscle use in daily and repetitive tasks. which makes them ideal for reconstructing past lifestyles.
Figure III: Muscle attachment sites of the upper limbs (from Nordin and Fraukel, 2001).
MUSCLES 0F RIGHT UPPER EXTREMITY
Antenor View Posterior View
Ongins—Solid Supraspinatus Trapezius Lev. scapulae Flexor dig. superficaiis lnseilions—Stippfed
Muscle attachment sites can be studied in inter-specific comparisons of the relative sizes and positions of muscle or tendon attachment sites used to reconstruct functional morphology and evolutionary change. Muscle markers variation can also be studied within a single population to reconstruct the activity patterns of the individuals in the groups. In order to be able to use
Origins—Solid lnsertions—Stippled Serratus Coracobrachialis Pectoralis antrior Biceps (short head) minor
Supraspinatus —
Subscapuiaris Lat. dorsa
-Pectoralis maf.
Deltoid
Extensor carpi radialis Iongus Infraspinatus -Rhomboid maj.-— Subscapularis Deltoid ni raspinatus Y Tares minor Triceps (long head( —à--— Teres minor Triceps (lat. head( Deltoid Triceps (med. head( -y’ Teres Brachialis Pronator tares Superticial flexors Biceps brachii Triceps
Flexorpoilicislonges
Flesor dig. prof undus Pronator quad Fies dig. prof undus Supinator
Abri. digiti minimi fies. brevis Flexor dig. superticialis Flexor pollicis longue Est. carpi radialis brevis 5x1. carpi radiaux longus
Ext. poli icis longus
Est. digitorum
muscle attachments as a proxy of mechanical loadings, which in tum are hypothesized to affect the articular surfaces, muscle markers must be well understood (Zumwalt, 2005). Therefore, the following describes the effect of muscle contraction on the bone.
The stress on a surface equals the amount of force applied to that surface, divided by the area across which the force is applied. It is advantageous for bony attachment sites to increase in size to reduce stresses incurred by high muscle forces (Zumwalt, 2005). For example, on the surface of some primate skulls, sagittal bony crests build up during growth. These crests serve to enlarge the surface area for insertion of the temporalis (chewing) muscles and develops only if the muscle is enlarged enough to meet on top of the skull (Ankel-Simons, 2000). Some experirnental studies support the idea that muscle force directly affects attachment site morphology. For example, the effect of muscle size on attachment morphology was examined in mice in which myostatin, a negative-regulator of skeletal muscle growth, had been genetically knocked out (Hamrick et al, 2000). The rnyostatin-null mice exhibited a doubling of muscle mass as well as larger femoral third trochanters as compared to normal mice. Bone will respond to stimuli differently in different conditions, but the overall evidence of bone plasticity is consistent with mechanically induced musculoskeletal stress markers (MSM) hypertrophy. In addition muscle markers are the result of an accumulation of stresses experienced by an individual. As a result. activity can be correlated to the hypertrophy at muscle insertions (Wilczak, 1998b). Since muscle markers develop in response to muscle use and size, they can be used as a surrogate of the strength ofthe muscles.
1.5 Hypotheses to be tested
Loads in joints are incurred via muscle contraction and gravity. Body mass, because of gravity, contributes significantly to the mechanical demand on the articulations of the lower limbs. Since humans are bipedal, gravitational force has rnuch less influence on the upper limbs. Thus, articulations of the upper limbs incur loads almost exclusively through muscle contractions. Humans are
usually either lefi handed or right handed and the use of a preferred side originates early in chuldhood. As a consequence, it is possible to identify the preferred side of an individual found in an archaeological context by comparing the size and developrnent of right and lefi muscle insertions. Also, since muscle markers develop in response to muscle use and size, they can be used as proxy ofthe strength ofthe muscles.
Using muscle markers as surrogate for muscular strength, it is possible to determine whether articulations show a similar asymmetry. Previously, it was stated that, by responding to hydrostatic stresses, joint growth is hypothesized to follow a trajectory that reduces large loads per unit area while maintaining joint congruence through adaptations in joint size. shape, smootlmess and curvature (Frost. 1999; Hamrick, 1999b). Since very few studies have been able to demonstrate directly the influence of mechanical strain on the shape of joints in humans, this study further investigates the plasticity of articular surfaces. This project tests whether size and/or the shape of the articulations of the upper limbs change according to the forces that cross them. As stated above, muscle markers are used as proxy to muscle contraction strength and frequency.
The null hypothesis is:
Ho = There is no right-lefi differences in articular surfaces of the upper
limbs in humans relative to the difference in loads incurred by each side.
Two alternative hypotheses derive from the null hypothesis. They are not mutually exclusive and can both be supported.
Hi hie right-left shape differences in articular surfaces of the upper limbs in humans vary relative to the difference in loads incurred by each side.
H2 = The right-left size differences in articular surfaces of the upper
limbs in humans vary relative to the difference in loads incurred by each side. Individuals with larger muscle markings should develop flatter and larger articular surfaces to better distribute the larger loads induced by muscle contractions. For example, muscles su;iounding the shoulder (ex. the deÏtoideus, the rotator cuff muscles) push medially the humerai head when they
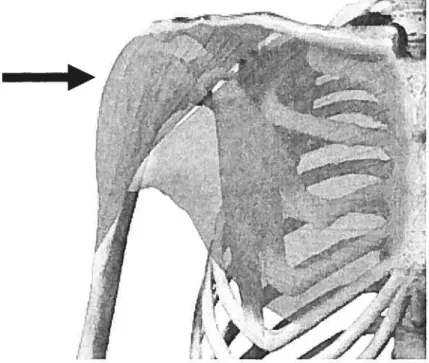
contract. These contractions cause the humerai head to cornpress the glenoid surface of the scapula (Figure IV). As a consequence of these forces, the glenoid surface and the humerai head should have a larger articular surface and the glenoid cavity should also be flatter.
Figure IV: Example of muscle contraction shown by the deltoideus (above left) and the pectoralis major (below-right) on the shoulder joint causing the head of the humerus to compress the glenoid surface of the scapula. The black arrow represents the medially directed load from the muscular contraction acting on the shoulder articulation. Figure shows anterior view of the shoulder (from Sénécal, 2003).
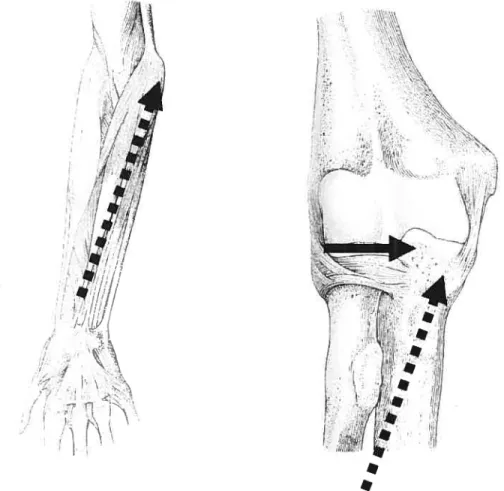
-However, the situation would be different at the elbow (Figure V). for example, many wrist and finger flexor muscles cross the
j
oint diagonally (dashed arrows). The transverse force vectors (full arrow) of these muscles act to dislocate the ulna from the humerus. In order to stabilize the articulation, the medial keel of the trochlea on the humerus is extended (figure VI) to prevent the ulna from being displaced medially. for this articulation, greater muscle contractions should result in an acute angle of the inferior surface of the humerai trochlea with a longer medial as well as a lateral trochlear hp. Ast
predicted for the shoulder, the distal articular surface of the hurnerus is hypothesized to increase in size in order to better resist the loads.
Figure V: Example of the muscle contractions caused by the flexors and extensors of the forearm acting on the elbow articulation (from Platzer, 2001). Figures show anterior views ofthe elbow.
Figure VI: Schematic illustration showing a strong medial keel on the elbow articulation (from Schmitt, 2003).
e
Medial keel
At the humero-radial articulation, the head of the radius rotates around the humerai surface as it accompanies the ulna during flexion-extension movement, and spins on the humerai surface during pronation and supination. During pronation-supination (Figure VII) the radiai head spins in place, while the distal radius rotates around the distal ulnar head at the distal radio-ulnar articulation. Supination (rotation of the hand medially) takes place at the humero-radial and proximal radio-ulnar joints with the radius rotating about a longitudinal axis passing through the centre of the capitulum and the radial head and the distal ulnar head (Nordin and Frankel, 2001). It is expected that the surface of the radial head should have a larger but flatter articular surface when there is more frequent muscle contraction. The proximal and distal radio ulnar articulations should have the same response to the greater muscle loadings. They are predicted to develop larger and flatter articular surfaces with recurrent and powerful muscle contractions.
Figure VII: Pronation (rotation of the hand laterally) and supination (rotation of the hand medially) movements of the forearm (from DePuy Orthopaedics, 2005).
The radio-carpal and carpo-metacarpal articulations are expected to develop flatter and/or larger articular surfaces as well to better distribute the greater loads induced by contraction of the muscles crossing the wrist and the hand.
In general, at each joint, it is expected to see a generally larger articular surface on the preferred side and that may have a different forrn, which is usually predicted to be flatter except for the hurnero-ulnar articulation.
2.] A/IateriaÏs
The skeletal collection (Table 1) used in this study is archaeological and of mixed ancestry. Both males and females were included. The sample integrated only non-pathological individuals. Juveniles were flot included because during growth, tendons and ligaments attach primarily to the periosteum. which is attached to the bone by a relatively small number of collagen fibres. Only afler epiphyseal growth plates close and growth is complete do the tendons and ligaments of long bones pass through the periosteum and attach firrnly to the underlying bone. This mechanism allows the attachment of soft tissue to migrate relatively easily during growth to maintain a constant position to the growth plate and adjacent joints. As a result, the morphologies of juvenile muscle attachment sites are unlikely to reflect fully the size or activity of the attaching muscle (Zumwalt. 2005). The stress of activity pattems accumulates over time, so older individuals have more pronounced muscle markers than younger individuals. In order to avoid measuring individuals that have greater markings simply because of their age or individuals whose activity levels might have decreased during life due to advanced age; the individuals approximately over 50 years were not included. The sample was aged and sexed using museum records. All specimens are housed at the Canadian Museum of Civilization, except for three (all Euroamericans) that are housed at the Paleoanthropology Laboratory of the Université de Montréal.
Table 1: Study sample
Croups Females Males Indeterminate Sample size Sadiermiut Inuit (Nunavut) 1$ 13 0 31 Amerinds (British-Columbia, Manitoba, 13 29 5 47 Ontario)
Euroamericans 4 25 1 30 Total 35 67 6 10$
2.2 Methods
The bones used in the analysis are: the clavicle, scapula. hurnerus, ulna, radius, as well as the first. second and third metacarpal. The articulations investigated are: gleno-humeral, humero-ulnar, hurnero-radial, proximal and distal radio-ulnar, and carpo-metacarpal of the three radial digits. An osteometric board was used to measure the bone length to the nearest O.5mm and the articular surface measurements were taken with siiding calipers and recorded to the nearest O.lmm (Table 2). Measures were taken using the rnethods described in Martin and SaÏler (1957).
Table 2: Lînear measurements
Linear measurement Abbreviation S1hciht ofglenoid surface SGSI APlength ofthe glenoid surface SGAP SI height of humerai head HHSI AP length of humerai hcad HHAP ML width distal articular surface HDML ML width ofthe trochlea HTML SI height ofthe capitulum HCSI SI height of the zona conoidea HZSI SI height ofthe trochlear surface HTSI ML width stiperior portion of proximai ulna articular surface UTML ML width inferior portion ofproximal ulna articular surface URML ML width at mid-portion ofproximal ulna articular surface ULAT SI height of trochlear notch UTSI SI height of radial notch on the ulna RNSI AP length of radial notch on the ulna RNAP ML width of uinar distai articular surface UNML AP length ofuinar distal articular surface UNAP ML width ofradial head RHML AP length of radial head RHAP ML width ofradiocarpal surthce RDML AP length ofradiocarpai surface medial side RDAP AP length ofmid radiocarpal surface RDAPM ML width oftirst metacarpal head MC HML AP length offlrst metacarpal head MC HAP ML width oftirst metacarpal base MC BML AP lemzth offirst metacarpal base MC BAP ML width of second metacarpal head MC2HML AP length of second metacarpal head MC2HAP ML width ofsecond metacarpal base MC2BML AP length of second metacarpal base MC2BAP ML width offirst proximal phalange base PBML APlength oftirst proximal phalange base PBAP *Sl: supero-inièrior. AP: antero-posterior. ML: medio-lateral
When comparing the articular size, only one variable per articulation was included. When possible an average value for the two measures (ex. SI
height and AP length of the glenoid surface) for one joint was used as the size variable. The combination of the two measures could only be donc if they were thought to reflect accurately the overali size of the articulation. As for the articular shape analysis ail angles measured on one articulation were analyzed separately in order to better understand how the surfaces may be modified to better resist loads.
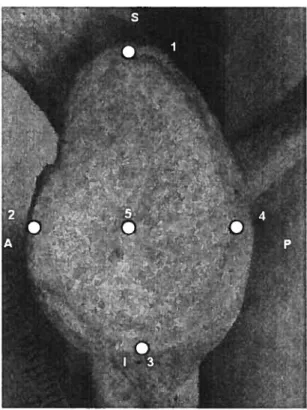
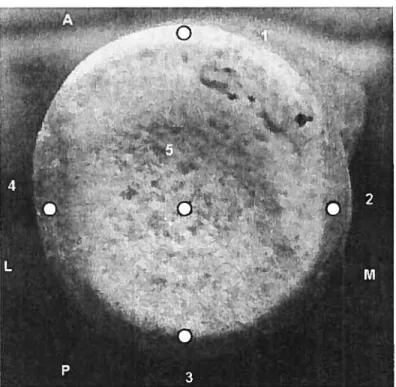
Joint shape was recorded using a digitizer (Microscribe G2X). Data was collected on the glenoid surface (f igure VIII), on the distal humerus (Figure IX), on the proximal and distal radius (figure X and XI), and on the proximal first (figure XII) and third metacarpals. On the third metacarpal, the points were the same as on the flrst, except that the posterior point was taken on the styloid process. Angles were calculated from these three-dimensional points and were analyzed to determine whether the shape of an articular surface might be different due to the different mechanical environment. Angle C of the distal humerus was calculated using digital pictures (Figure IX).
Muscle marker size is used as a surrogate for the charges incurred by the articulations during life. The attachments included the area covered by the tendinous attachment and the areas immediately adjacent to this attachrnent that show formation of new bone on the smooth cortical surface (Table 3). Wilczak’s method (199$a, b) was used to measure most of the maximum length and width of the attachments. The maximum length was aligned vertically by placing the siiding callipers at the most superior and inferior points of each insertion. The maximum width was aligned by placing the sliding clippers on either side of the widest point perpendicular to the maximum length (Wilczak, 1998b). In addition, the maximum projection of the coracoid process and the acromion as well as the projection of the medial and lateral epicondyles were taken. The maximum projection was aligned by placing the sliding callipers on the associated articulation to the end of the bony projection. There are limitations to using quantitative estimates of insertion size (Wilczak, 1998a. b; Zumwalt, 2005). Since bone is a three-dimensional structure, information about the morphology ofthe insertion site is lost and rugosity is flot considered.
Figure VIII: Points taken on the shoulder, lateral view. The superior (1), middle (5) and inferior (3) points form the SI angle and the anterior (2), middle (5) and posterior (4) points form the AP angle.
Figure IX: Points taken and angles calculated at the humero-ulnar articulation, anterior view. A - Inferior medial angle (points 1, 3, 2), B
-Inferior lateral angle (points 1, 3, 4), and C - Medial angle of the humeral
Figure X: Points taken at proximal surface of the radius, superior view. The medial (2), mïddle (5) and lateral (4) points form the ML angle and the anterior (1), middle (5) and posterior (3) points form the AP angle.
Figure XI: Points taken at the distal surface of the radius, inferior view. Anteriorly the medial (3), middle (6) and lateral (1) points form the ML angle 1 and ML angle 2 is posteriorly (1, 6, 4). The anterior (2), middle (6) and posterior (5) points form the AP angle.
figure XII: Points taken at the proximal surface of the first metacarpal, superior view. The medial (2), middle (5) and lateral (4) points form the ML angle and the anterior (1), middle (5) and posterior (3) points form the AP angle.
Muscle Corresponding structure measured Coracobrcwhiatis. biceps brachii and pectoralis Coraco id process
ininor
Deltoid and trape:ius Acromion Subscapularis Lesser tubercle Teres minor, supraspinatus and infraspinus Greater tuberci e
Pectoralis major Insertion ofthepectora/is major Deltoideus Insertion ofthe deltoideus Pronator teres, jiexor carpi radialis, flexor carpi Media! epicondyle u/naris. pahnaris longus andfiexor digitorum
superficialis.
-1nconetis, brachioradialis, supinator, extensor Lateral epicondyle
carpi radialisIongus, extensor carpi radialis brevis, extensorcarpiulnaris, extensordigitorum
and extensorcligitimini,ni.
Bicepsbrachii Radia! tuberosity Tricepsbrachii O!ecranon Brachialis U!nar tuherosity
Pronator cïuadratus ]nsertion of the pronator guadrattis Pronator teres !nsertion ofthe pronator tetes Stipinator Insertion ofthe supinator
1bductorpol1icis Iongits Origin ofthe abcluctorpollicis longus
Three individuais were measured three times over a period of severai weeks to test for measurement error (Table 4 and Table 5). Measurement errors were caiculated using the method outlined by White and Foikens (2001) in which differences from the mean of the measurements are averaged and expressed as a percentage of the mean measure. Ail linear measurements for the articulations are under 3%. Muscle site measurernents are ail under 6% except for the lateral epicondyle projection, which ranges around 9%. This error is taken into consideration in the analysis.
Table 4: Measurement errors for the articular measurements of the left and right sides included in this study (n= 3 individuals).
*Si: supero-inferior. AP: antero-posterior. ML: medio-iaterai
Articulation measurements Mean percentage oferror Right Left Average side side
S1 heightofgienoid surface 0.21% 0.31% 0.26°o AP iength ofthe glenoid surface 0.63 0.77 0.7 SI height of humerai head 0.54 0.20 0.37 AP iength of humerai head 0.45 0.35 0.4 ML width distai articular surface 0.51 0.52 0.51 ML width ofthetrochlea 1.08 1.48 1.28 SI height ofthe capitulum 0.50 1.07 0.78 SI height ofthe zona conoidea l.5 I 1.23 1.37 SI heightofthe trochlear surface 1.2$ 1.32 1.30 ML width superior portion of proximal uina articular surface 0.61 0.98 0.79 ML width inferior portion ofproximai uina articular surface 0.79 0.67 0.73 ML width at mid-portion ofproximal ulna articular surface 1.83 1.15 1.49 SI height oftrochlear notch 1.92 1.76 1.84 SI heightofradial articulation on the ulna 1.81 1.92 1.86 AP length ofradial articulation on the ulna 2.12 1.94 2.03 ML width ofuinardistal articular surface 2.50 2.21 2.35 AP length of ulnar distai articutar surface 87 2.37 2.62 MLwidthofradialhead - t5 2.15 1.8
A? length of radiai head - M 2.34 1.87
ML width ofradiocarpai surface - .56 1.65 1.60
AP iength ofradiocarpai surface mediai side - .14 0.60 0.87
AP length ofmid radiocarpal surface (192 (124 0.58 ML width oftirst metacarpal head - .24 1.14 1.19
AP length of lirst metacarpal head .16 1.08 1.12 ML width oftirst metacarpai base - 0 - .79 1.64
AP iength of lirst metacarpal base - 2 1.68 1.8
ML width of second metacarpal head - 2 - I6 1.54
AP iength of second metacarpai head .73 1.24 1.48 ML width of second metacarpai base 0.73 0.99 0.86 A? Iength of second metacarpal base 0.67 1.27 0.97
Muscle site measurements Mean percentae of error
Right side Left side Average Coracoidprocess 2.01% 1.15% 1.58°/ Acromion 1.64 1.52 1.58 Lesscr tubercle 3.42 3.70 3.56 Greater tubercle 0.77 1.47 1.12 Insertion ofthepectora/ismajor 4.92 3.22 4.07 Insertion ofthedeltoideus 5.31 3.85 4.58 Media! epicondyle 6.34 4.19 5.26 Lateral epicondyle 9.46 9.23 9.34 Radial tuberosity 2.55 2.47 2.51 Olecranon 3.36 3.47 3.41 Ulnartuberosity 1.51 2.99 2.25 Insertion of thepronator teres 1.29 1.31 1.30 Insertion ofthesupinator 5.46 5.19 5.32 Origin ofthe abductorpollicislongus 1.59 1.56 1.57
2.3 Analysis
Skeletal bilateral directional asymmetries (DA) are commonly used as indicators of the influence of the mechanical environment on bone. DA occurs when one side of the skeleton is consistently more developed than the other and is largely attributable to differential mechanical loading during growth. Humans are unique among primates in the magnitude of directional bilateral asymmetry exhibited on the upper lirnb, favouring one side (usually the right) over the other. Difference in asyrnmetry of muscular and articular surfaces was calculated using the following formula in order to control for the effect of size:
DA= (right—lefi) / (right+ lefi)
* 2000
Although there is no standard method of calculating DA, this method and similar variants, are cornmonly employed (Steele and Mays. 1995; Mays et al., 1999; Plochocki, 2002, 2004). Negative scores indicate left dominance, while positive score indicate right dominance ofthe individuals.
There is much debate concerning the relationship of muscle attachment with age, sex and geographic origins (Hawkey and Merbs, 1995: Wilczak, 1998a. b; Eshed et al., 2003; Ruif, 2003; Weiss, 2003, 2004; Zumwalt, 2005; Molnar, 2006). DA was used in this project to concentrate muscular contractions by controlling for those factors that may influence the size of the muscle markers. Also, as seen in chapter 1, muscle attachment sites can be studied in inter-specific comparisons of the relative sizes and positions of Table 5: Measurement errors for the muscle site measurements of the riglit and left sides included in this study (n= 3 individuals).
muscle or tendon attachment sites used to reconstruct functional morphology and evoiutionary change (Zumwalt, 2005). Therefore, in order to study the functional morphology of the upper limb joints, ail of the variation in the sample was combined.
For each articulation, only the muscles crossing at that particular articulation were used as the suffogate of muscular force. The measurements for the coracoid process, acromion, lesser and greater tubercle, and insertions of the pectoratis major and the deÏtoideus were correlated with the shoulder articulation measurements. The medial and lateral epicondyle, along with the radial and ulnar tuberosities. the olecranon, and the insertions of the supinator and the pronator teres were coirelated with the eibow articulation measurements. The medial and lateral epicondyles and the origin of the abductor poÏÏicis longus measurements were correlated with the wrists joint measurements. f inaily, the lateral and medial epicondyles were correlated with the second or third metacarpal and the origin of the abductor poÏÏicis longtts was conelated with the first metacarpal.
Least-square regression is used to evaluate the influence of muscle size on joint shape and size. Statistical significance was set at 0.05 in ail tests. Ml analysis were done using SPSS for Windows statistical software version 13.0. The number of individuals in each analysis varied due to the fact that the sample used is archaeological and fragmentary.
3.1 $houlder; size
As shown in Table 6, only one significant relationship was found at the shoulder. The humerai head correlates positiveiy (p = 0.02$, r = 0.279) with
the asymmetry of the greater tubercle (Figure XIII). This positive coiieiation indicating a greater size of the humerai head with larger muscle attachment is as hypothesized.
The size of the glenoid surface is close to have a significant negative relationship with the size of the coracoid process (p 0.0$, r = 0.3 14). This
negative correlation indicating a smaiier surface area of the gienoid cavity with increasing muscle marking size is contrary to what is expected.
Table 6: Correlation coefficients and significance of the regressions of articular size and muscle attachment size at the shoulder
Muscle/Independent Glenoid_surface Humerai head
variable 11* P b r n p b r Coracoid process 32 0.080 -0.173 0.314 32 0.310 -0.046 0.185 Acromion 39 0.532 0.039 0.103 40 0.530 -0.025 0.102 [esser tubercle 56 0.837 0.010 0.028 68 0.309 -0.027 0.125 Greater tubercle 49 0.826 -0.018 0.032 62 0.028 0.080 0.279 Insertionofpectoralis 59 0.708 0.0 10 0.050 72 0.875 -0.002 0.0 19 major Insertion ofdettoidetts 66 0.517 0.018 0.t)81 73 0.364 0.t)14 0.108 *n: number of individuals with paired skeletal elements. p: statistical significance. b: regression coefficient (siope value), r: correlation coefficient
Figure XIII: Regression between size of the humerai head and the size of the greater tubercle.
10000-
75.00-::.
< -25.00 o -5000-I I I I -400.00 -200.00 0.00 200.00 400.00Asymmetry 0f the greater tubercle
3.2 Elbow; size
There are a few more significant relations at the elbow (Tables 7, $ and 9). At the distal humerus, the height of the capitulum (p = 0.030, r 0.243)
correlates positively with the size of the lateral epicondyle (Figure XIV). This positive correlation indicating a larger surface area of the capitulum with increasing muscle attachment size is as expected. However, the height of the capitulum (p 0.033, r 0.285) and the size of the trochlea, which is the combination of the SI and ML measurements of the trochlea (p = 0.002, r =
0.363), correlates negatively with the insertion for the pronator teres (Figures
XV) and the olecranon (Figure XVI) respectively. As it can be seen, the size of the trochlea and the olecranon size have a pretty strong negative relationship. The ML width of the distal articular surface of the humerus is close to have a significant negative relationship with the size of the media! epicondyle (p =
0.068, r = 0.197). These negative re!ationships are contrary to what was
expected. At the dista! e!bow, many measurements show that the articu!ar surfaces are reduced in size with greater muscular contractions.
Table 7: Correlation coefficients and significance of the regressions of articular size and muscle attachment size at the distal humerus
Muscle! ML width distal articular surface SI height of the capitulum Independent variable p b R n p b r Medial epicondyle $7 0.06$ -0.020 0.197 83 0.755 0.007 0.035 Lateral epicondyle 82 0.287 -0.010 0.119 80 0.030 0.041 0.243 Radial tuberosity 75 0.880 0.003 0.01$ 73 0.141 -0.054 0.174 Olecranon 72 0.659 0.00$ 0.53 73 0.745 -0.013 0.039 Ulnartuberosity 78 0.704 0.007 0.044 76 0.105 -0.057 0.18$ Insertion of 59 0.352 -0.009 0.123 56 0.033 -0.044 0.285 pramitor teres
Muscle! SI height of the zona conoidea Trochlea Independent variable n p B r n p b r Medial epicondyle 85 0.787 -0.005 0.030 82 0.5 15 -0.017 0.072 Lateral epicondyle 80 0.203 -0.022 0.148 76 0.809 -0.005 0.027 Radial tuberosity 75 0.385 0.029 0.105 70 0.349 -0.038 0.110 Olecranon 75 0.002 -0.104 0.363 72 0.824 -0.009 0.026 Ulnar tuberosity 78 0.374 -0.028 0.104 75 0.624 0.01$ 0.056 Insertionofpronatorteres 58 0.183 -0.025 0.184 54 0.858 -0.004 0.224
*m number of individtials with paired skeletal elements. p: statistical significance. b: regression coefficient (siope value). r: correlation coefficient
150,00
0.00
-50.00’
10000
Figure XIV: Regression bebveen the size of the SI height of the capitulum and the size of the lateral epicondyle.
E z z 0. 100.00 w o 50.00 0) G) U) w o G) E E >. 8) o o o o 0 0 0 0 0 0 Oo O 0 0 00 0 0000 00 0 0 0 o o 00 0og o o I I I I 40000 -200.00 0,00 200.00 40000 600.00 800.00
Figure XV: Regression of the size of the SI height of the capitulum and the size of the insertion of theproilator teres muscle.
E D D 0. 10000-w o 50.00-o, w ci, w OEIlS o •E -5000-E E In -100.00-I I I I I -1000.00 -500.00 0.00 500.00 1000,00 1500.00
Asymmetry0fthe pronator teres muscle
Figure XVI: Regression between the size of the trochlea and the size of the olecranon. o o o o o o 00 0 c 00 0 0000 w o o 50.00-w -t e w E E In
There are no significant relationships at the proximal ulnar measurements (Table 8). Only the ML width of the inferior portion of the proximal ulna articular surface is close to having a significant positive relationship with the olecranon (p = 0.088, r = 0.210). This correlation agrees
with the expectations since a greater width vas hypothesized with greater muscle markings.
Table 8: Correlation coefficients and significance of the regressions of articular size and muscle attachment sïze at the proximal ulnar measurements
Muscle! Trochlear notch ML width inferior portion of proximal ulna Independent articular surface
variable p b r N p b r Medial epicondyle 73 0.319 0.033 0.118 70 0.607 -0.026 0.063 Lateral epicondyle 66 0.709 0.009 0.047 65 0.786 0.0 10 0.034 Olecranon 67 0.329 - 0.121 67 0.08$ 0.139 0.210 0.051 Ulnar tuberosity 72 0.697 0.017 0.047 72 0.754 -0.020 0.03$ Radial tuberosity 69 0.180 - 0.163 71 0.644 -0.033 0.056 0.059 Insertion of 52 0.544 - 0.086 56 0.7 17 -0.0 16 0.050 pronator teres 0.0 19
Muscle! ML width at mid-portion ofproximal ulna articular surface Independent variable n P b r Medial epicondyle 77 0.690 -0.012 0.046 Lateral epicondyle 70 0.651 0.010 0.055 Olecranon 75 0.645 0.02 I 0.054 Ulnartuberosity 79 0.217 -0.048 0.141 Radial tuberosity 77 0.627 -0.020 0.056 Insertionof pronator teres 60 0.188 -0.033 0.172
*n: number of individuals with paired skeletal elements. p: statistical significance. b: regression coefficient (siope value), r: correlation coefficient
As shown in Table 9, two significant relations are observed at the articulations of the proximal ulna and radius. The size of the radial head correlates positively (p 0.045, r = 0.265) with the size of the radial tuberosity
(Figure XVII). A greater surface area of the radial head with a greater muscle attachrnent was predicted. As for the size of the radial notch found on the ulna, it correlates negatively (p 0.043, r 0.23 3) with the insertion ofthe supinator
(figure XVIII). The size of the radial head cornes close to a significant negative correlation (p 0.089, r = 0.234) with the size of the medial
epicondyle. These results indicating a srnaller surface area of the radial notch and the radial head with increasing muscle marking size is contrary to what was expected.
Muscle! Radial notch - Radial head
Independent variable * p B r n p b r Medial epicondyle 74 0.160 0.082 0.165 54 0.089 -0.053 0.231 Lateral epicondyle 69 0.412 -0.036 0.100 50 0.125 -0.038 0.220 Olecranon 74 0.328 0.076 0.115 52 0.700 0.019 0.055 Ulnar tuberosity 77 0.762 -0.023 0.035 58 0.120 0.061 0.206 Radial tuberosity 73 0.931 -0.007 0.010 58 0.045 0.079 0.265 Insertion ofpronatorteres 57 0.179 -0.070 0.181 53 0.697 0.007 0.055 Insertion ofsupinator 76 0.043 -0.079 0.233 58 0.150 0.029 0.192 number of individuals with paired skeletal elernents. p: statistical significance. b: regression coefficient (slope value), r: correlation coefficient
V w V (u w o w E E >. Cl) 4 -5000-I I I I -40000 -20000 000 20000 40000
Asymmetry0f the radial tuberosity
Table 9: Correlation coefficients and significance of the regressions of articular size and muscle attach ment size at the proximal ulna and radius
Figure XVII: Regression between the size of the radial head and the size of the radial tuberosity.
100 00- 5000- 0.00-o0 O w 00 6’ 00 000 00 0DO C) o o o O o o o -10000 600 00
Figure XVIII: Regression between the size of the radial notch and the size of the insertion of the supinator muscle.
C.) o (u •0 (u G) o G) E E G) 3.3 Wrist; size
There is no significant relationship at any of the wrist articulations (Table 10). There is no relation that is close to being significant.
Muscle! ML width ofradio-carpal surface AP length of radio-carpal surface medial Independent side variable n* p b r n p b R Medial 68 0.606 -0.034 0.064 69 0.299 -0.067 0.127 epicondyle Lateral 66 0.430 -0.039 0.099 67 0.954 0.002 0.007 epicondyle Insertion of 70 0.798 0.010 0.031 72 0.893 0.005 0.0l6 tibthictor polikis longud
Muscle! AP length of mid radio-carpal Ulnar head Independent variable surface
n p b r n p B r Medial epicondyle 61 t).175 -0.043 0.Ô93 58 0.881 0.007 0.020 Lateral epicondyle 60 0.953 -0.003 0.008 53 0.9 15 0.004 0.015 Insertion oftzbductor 65 0.415 0.032 0.103 60 0.175 0.047 0.177 pollicLs longud
*n: number of individuals vith paired sKeletal elernents. p: statistical signiticance. b: regression coet’licient (siope value). r: correlation coefficient
-100000 5QQ00 000 000,00 1000,00
Asymmetry 0f the Supinator muscle
Table 10: Correlation coefficients and significance of the regressions of articular size and muscle attachment size at the wrist
3.4 Hand; size
There is no significant relationship either at any of the hand articulations (Table 11). There is no relation that is close to being significant.
Muscle! HeadofMcl BaseofMcl
Independent p b R n p b r
variable
Insertion of 53 0.768 0.007 0.041 49 0.161 -0.078 0.208 abductor pollicis
Ioitgiis
Muscle! Head ofMc2 BaseofMc2
Independentvariable
n p b ]R n p b r
Medialepicondyle 47 f).757 -0.024
I
0.050 54 0.173 0.001 0.188Lateral epicondyle 32 0.310 0.024
I
t).169 67 0.930 0.004 0.013Therefore, when looking at the size of the joint in relation to muscular insertion size, significant relationships were found only at the shoulder and elbow.
3.5 ShouÏder; shape
Table 12 shows no significant relationship in the different angles of the glenoid cavity in relation to the muscular contractions at the shoulder. The SI angle of the glenoid surface has a positive relationship close to significant (p 0.084, r 0.310) with the coracoid process. This resuit in a less concave surface of the glenoid cavity as it was expected. It is however the only relationship close to being significant at this joint.
Table 12: Correlation coefficients and significance of the regressions of articular shape and muscle attachment size at the glenoid cavity
Muscle!lndependent variable gIeSI gleA-P
-n p B r n p b r Coracoid process 33 0.084 0.031 0.310 35 0.593 0.122 0.095 Acromion 41 0.73t) 0.673 0.119 41 0.120 0.175 0.250 Lessertubercle 59 0.460 0.030 0.100 58 0.165 0.032 0.187 Greater tubercle 52 0.443 -0.309 0.110 54 0.814 -0.057 0.033 Insertionofpectoralisrnajor 62 0.716 -0.079 0.048 63 0.354 -0.077 0.121 Insertionofdelloideus 69 0.414 0.077 0.103 69 0.917 -0.268 0.013 *m number of individuals with paircd skcletal elements. p: statistical signiticance. b: regression coefficient (slope value). r: correlation coefficient
Table 11: Correlation coefficients and significance of the regressions of articular size and muscle attachment size at the hand
*fl; number of individuals with paired skeletal elernents, p; statistical significance, b; regression
3.6 Elbow; shape
Table 13 shows that the inferior laterai angle of the humerai trochiea is positively correiated with both the ulnar tuberosity (p 0.017, r 0.332; Figure XIX) and the radial tuberosity (p = 0.031 r = 0.312; Figure XX). The inferior
iaterai angle of the humerai trochiea is also close to having a positive significant reiationship with the olecranon (p = 0.081, r = 0.257). This indicates
that the lateral hp of the distal humerus becomes more vertical to resist the greater muscular contractions as was predicted. The inferior medial angle of the humerai trochlea is also close to a significant negative colTelation (p =
0.086, r 0.091) with the size of the lateral epicondyle. This indicates that contrary to what was expected, the medial hp of the distal humerus becomes more horizontal to resist the greater muscular contractions. However, the correlation coefficient is very low (r = 0.091), indicating that muscle
contractions by the elbow extensors do not greatly influence the angle of the medial hp.
Table 13: Correlation coefficients and significance of the regressions of articular shape and muscle attachment size at the distal humerus
Muscle! inferior mediai angle of Inferior lateral angle ofthe Medial angle ofthe Independent the humerai trochlea (A) humerai trochlea (B) humeraI trochiea (C) variable n p b r n P b r n p b r Mediai 49 0.220 - 0.024 49 0.836 - 0.030 51 0.792 0.006 0.038 epicondyle 0.01$ 0.009 Lateral 48 0.086 - 0.091 46 0.227 - 01X1 51 0.523 0.016 0.043 epicondyie 0.043 0.050 Olecranon 47 0.103 0.069 0.108 47 0.081 0.123 0.257 49 0.358 - 0.136 0.039 Ulnar 50 0.523 0.022 0.013 51 0.017 0.137 0.332 53 0.926 0.004 0.057 tuberosity Radial 48 0.222 0.04$ 0.049 48 0.031 0.134 0.312 50 0.571 0.019 0.056 tu berosity Insertion of 38 0.868 0.003 0.096 39 0.832 - 0.035 41 0.552 - 0.083 pronator 0.006 0.0 14 teres
number of individuals with paired skeletal elements. p: statistical significance. b: regression coefficient (siope value). r; correlation coefficient
Figure XIX: Regression of the shape values of the inferior lateral angle (B) of the humerai trochlea and ulnar tuberosity.
500.00-o o O) 0 C 400_DO o —o 2 300.00 0 O 000 00 0 0 200.00 0 0 0 8 O o E E OO.OO- O ‘o I I I I -400.00 -200.00 0.00 200 00 400,00
Asymmetry0f the ulnar tuberosty
Figure XX: Regression of the shape values of the inferior lateral angle of the humeral trochlea (B) and the radial tuberosity.
500.00-o 1? O) O C 400.00-—o 00000 0 0 300 00-000 0 0 .2OOEO0- O
‘s
o E E 10000’ 0 ‘o I I I -400 00 -200 00 0.00 200.00 400.00 600.00Table 14 shows a strong positive colTelation between the AP angle of the radial head (p = 0.019, r= 0.342) and the olecranon (Figure XXI). The ML
angle of the radial head has an almost significant positively correlated relationship (p 0.055, r = 0.285) with the lateral epicondyle. The AP angle
has a close to significant positive correlation (p = 0.097, r= 0.311) with the size
of the ulnar tuberosity. These resuits indicate a larger AP or ML angle with stronger muscle contraction as expected. However. the ML angle of the radial head almost has a significant negativety correlated relationships with the ulnar tuberosity (p = 0.088, r = 0.234) and the insertion of the pronator teres (p =
0.078, r= 0.282). These go against the two previous results and the predictions,
and the outcome is an acute angle, or more concave surface, correlated with stronger muscular contractions.
Table 14: Correlation coefficients and sïgnificance of the regressions of articular shape and muscle attachment size at the radial head
Muscle! Independent variable Radial head (AP angle) Radial head (ML angle) n*P B R np b r Medial epicondyle 52 0.211 -0.324 0.176 49 0.111 0.055 0.228 Lateral epicondyle 45 0.149 -0.222 0.218 16 0.055 0.062 0.285 Olecranon 47 0.019 0.589 0.342 46 0.221 -0.065 0.178 Ulnar tuberosity 50 0.097 0.311 0.197 51 0.08$ -0.017 0.234 Radial tuberosity 52 0.855 -0.047 0.f)26 53 0.246 0.059 0.162 Insertion ofproittitorteres 39 0.101 0.144 0.198 40 0.078 -0.037 0.282 Insertion ofsupinator 49 0.746 -0.023 0.028 50 0.216 0.017 0.101
*fl: number ol’ individuals w ith paired skcletal elernents. p: statistical significance. b: regression coefficient
Figure XXI: Regression of the shape values of the AP angle of the radial head and the olecranon.
60000-w 40000-w •0 w w 20000-0, 000-5 -200 00-w E E -40000 U) -60000--40000 -20000 000 20000
Asymmetry 0f the olecranon 40000
3. 7 Wrist; shape
As shown in Table 15, the posterior ML angle of the distal radius is negatively correlated (p 0.032, r 0.253) with the insertion of the abditctor poïticis iongus (Figure XXII). This resuit indicates a more keeled angle of the distal radius with stronger muscular contractions, which is contrary to predictions. No other muscle insertion bas a significant relationship at the wrist.
Table 15: Correlation coefficients and sïgnificance of the regressions of articular shape and muscle attachment size at the distal radius
Muscle! ML angle I ML angle 2
Independent n p b R n p b r variable Medial epicondyle 74 0.653 -t).0l7 0.05 I 75 0923 -0007 0.011 Lateral epicondyle 68 0.68$ 0.007 0.050 68 0.161 -0.153 0.173 Insertion of 71 0.325 0.07 I 0.119 72 0.032 -0.093 0.253 tzbdzictor pollicis longus o o o 0 o o o 000 00 0 0° 0 0 co° o o 0 00 o g 00 o
Muscle!Independent AP angle 1 variable n P b r Medial epicondyle 70 0.565 -0.068 0.072 Lateral epicondyle 66 0.696 0.025 0.050 Insertion ofabductor 72 0.669 0.043 0.035 pollicis longus
*1,:number of individuals with paired skctetal elernents. p: statistical significance. b: regression coefficient
(siope value), r: correlation coefficient
Figure XXII: Regression of the shape values of the ML angle 2 of the distal radius and the insertion of the abductorpot!icis Iongtts muscle.
50000-u, 40000-u, w 20000-e 10 000- -10000-
-20000-Finally, Table 16 shows no significant relationships with the muscles crossing the hand joints. Once again. no relation is close to being signfficant. Table 16: Correlation coefficients and significance of the regressions of articular shape and muscle attachment size at the hand
Muscle! Independent Mcl (SI angle) 1’Ic1 (ML angle)
variable n* p b R n p b r Insertion ofabduclor 51 0.415 -0.120 0.082 50 0.390 0.077 0.124
pollicis longus
Muscle! Independent Mc3 (SI angle) Mc3 (ML angle)
variable n p b R n p b r Medial epicondyle 56 0.521 0.032 0.117 53 0.669 0.019 0.060 Lateral epicondyle 51 0.260 0.042 0.065 48 0.711 0.008 0.055
*fl; number of individuals with paired skeletal elements, p: statistical significance, b; regression
coefficient (slope value), r; correlation coefficient o o o 0 o 0 000 0 o q,000 0 0 000Q 0o 0 0 ‘6 000 00 -100000 -50000 000 50000 100000
Asymmetry0fthe insertion of the abductor pollicis
Iongus