HAL Id: hal-01154605
https://hal.archives-ouvertes.fr/hal-01154605
Submitted on 28 May 2015
HAL is a multi-disciplinary open access
archive for the deposit and dissemination of
sci-entific research documents, whether they are
pub-lished or not. The documents may come from
L’archive ouverte pluridisciplinaire HAL, est
destinée au dépôt et à la diffusion de documents
scientifiques de niveau recherche, publiés ou non,
émanant des établissements d’enseignement et de
Sustainable supply chain network design: An
optimization-oriented review
Majid Eskandarpour, Pierre Dejax, Joe Miemczyk, Olivier Péton
To cite this version:
Majid Eskandarpour, Pierre Dejax, Joe Miemczyk, Olivier Péton.
Sustainable supply chain
network design:
An optimization-oriented review.
Omega, Elsevier, 2015, 54, pp.11-32.
�10.1016/j.omega.2015.01.006�. �hal-01154605�
Sustainable supply chain network design: an
optimization-oriented review
Majid Eskandarpour
1Pierre Dejax
1Joe Miemczyk
2,3Olivier P´
eton
11Ecole des Mines de Nantes, IRCCyN UMR CNRS 6597
(Institut de Recherche en Communications et Cybern´etique de Nantes), Nantes, France email: {majid.eskandarpour, pierre.dejax, olivier.peton}@mines-nantes.fr
2 Audencia Nantes School of Management, 44312 Nantes, France
3 Aix Marseille Universit´e, CRET-LOG EA 881, 13625, Aix en Provence, France
email: [email protected] January 2015
1
Introduction
Supply chain management has become a strategic issue for any company looking to meet targets in terms of economic competitiveness, time and quality of service especially in an economic environment characterized by the globalization of trade and the acceleration of industrial cycles. The trade press is replete with examples of logistics network configuration, re-configuration, re-organization, mergers, outsourcing, and so on. These developments have been influenced by successive trends in the economy and society resulting from computerization, increased complexity of trade flows, increased competition and certainly not least, sustainable development. Thus the strategic design and planning of logistics networks is a topic that is becoming more important for businesses and researchers alike. Supply chain network design is at the intersection of disciplines such as management, strategy, logistics, operations research and as such, there is a significant challenge to researchers to consolidate and synthesize the research in this field, which leads to the focus of this paper.
Supply Chain Management (SCM) spans all movements and storage of raw materials, work-in-process inventory, and finished goods from the point-of-origin to the point-of-consumption [Simchi-Levi et al., 2004]. It encompasses three decision levels: strategic, tactical and operational. In particular, at the strategic level, Supply Chain Design comprises the decisions regarding the number and location of pro-duction and storage facilities, the amount of capacity at each facility, the conciliation of market demand, and decisions on supplier selection from a total cost perspective [Chopra and Meindl, 2004]. From an operations research point of view, Supply Chain Network Design (SCND) is the discipline used to de-termine the optimal location and size of facilities and the flow through the facilities [Autry et al., 2013]. As recalled in Zanjirani Farahani et al. [2014], “there are many models in the SCND literature. Different decisions are made in the SCND and perhaps the most critical one is locating the facilities in different tiers of the supply chain”.
Fifty years ago, the seminal paper by Hakimi [1964] generalized the original Weber problem [Weber and Peik, 1909] from a single facility location problem to a multiple facility location problem. This publication marked a revival of the facility location problem, which has become one of the standard problems in the operations research community. Recent years have been characterized by a rapid enrichment of these
mathematical model solutions. Rich models now handle multiple levels in the logistics network, multiple periods, products, technologies, transportation modes and types of facilities. They integrate capacity constraints, tactical decisions and complex product flows. Thus, Supply Chain Network Design (SCND) can be considered as the meeting point of the academic facility location problem and the real-life SCND problem.
As already mentioned, among the major trends in SCM, the principles of sustainable development have spread across the scientific literature. Current research mainly consists of assessing SCM policies according to a triple bottom line including economic aspects, environmental performance and social responsibility. Sustainable SCM has been the subject of numerous survey papers in both qualitative and quantitative disciplines. A number of review papers have been published in recent years, which relate to major trends in Supply Chain Management and investigate and suggest research opportunities. Importantly, research in sustainable SCND has hardly been reviewed at all. However, the integration of sustainability into SCND may change the locations of production facilities and inventories (see for example Figures 12–14 in You and Wang [2011]) and therefore have a significant impact on the environment and society. The goal of this paper is to bridge this gap.
More precisely, our objective is to review SCND problems that include a clear assessment of at least two of the three dimensions of sustainable development: economic aspects, environmental performance and social responsibility. We review papers containing mathematical models (linear and nonlinear programs with integer or mixed-integer variables) with binary decision variables modeling the selection of candidate facilities.
Our research questions can be briefly stated as follows: (i) which environmental and social criteria are considered in sustainable SCND research? (ii) how are they integrated into mathematical models? (iii) which optimization methods and tools are used? (iv) which real-life applications of sustainable SCND are described in the scientific literature?
Section 2 describes the methodology adopted for the collection of research papers and compares our work with existing reviews on related topics. SCND problems with environmental and social aspects are investigated in sections 3 and 4, respectively. In section 3, we give a special focus on LCA-based methods and review the scope of the environmental assessment, the environmental criteria used and the metrics chosen to evaluate these criteria. The section 5 reviews the mathematical models. We used 3 main classification dimensions: mono-objective versus multi-objective models, linear vs non linear, deterministic vs stochastic. The solution methods are described in section 6, which lists the use of solvers, other exact methods and heuristic or metaheuristic approaches. We devote section 7 to the description of case studies and real-life applications of sustainable SCND. The references are classified according to the type of economic activity and the nature of the data. Finally, in section 8 we conclude and suggest a number of future research directions.
2
Review methodology
2.1
Delimitations and search for literature
A comprehensive search of related research from 1990 to 2014 was applied to produce a synthesis of peer-reviewed literature. The start of the time period was chosen such that the Brundtland Report of the World Commission on Environment and Development [Burton, 1987] served as a starting point, in a similar way to Seuring and M¨uller [2008] and Chen et al. [2014].
We searched papers published in international peer-reviewed journals from the main electronic bib-liographical sources (Scopus, Web of Science) using keywords such as sustainable development, green, environmental or social along with classic keywords such as supply chain, network design or facility location in the titles or the topics covered. We use back-tracking to find earlier relevant sources, and forward-tracking in Web of Science to find literature that are referring to the central sources. We also
looked for recent surveys in related domains in order to find additional sources including a few conference papers.
From the collected material, we filtered the papers according to the following rules: (i) the papers must be written in English language, (ii) they include decision variables modeling the location or selection of candidate facilities, (iii) the measure of environmental or social impact is explicit either in the objective function or in the constraints of the model.
From the second rule, we excluded a large number of articles dealing with the routing of product flows in an already defined network. This is the case, for example, in the paper by Ramos et al. [2014], in which the authors present depot selection as an extension of their work. The third rule enabled us to filter many papers in the field of reverse logistics and management of undesirable facilities. Reverse logistics and closed-loop supply chain have become a major area of supply chain management. Several surveys have been published in the last fifteen years (see for example the surveys by Fleischmann et al. [1997], Dekker et al. [2004], Bostel et al. [2005], Pokharel and Mutha [2009] or the special issues [Guide and Van Wassenhove, 2006a,b]). Clearly, the goal of reverse or closed-loop supply chain is closely related to that of sustainable supply chain management. However, as explained in Srivastava [2008] (Figure 4), the main optimization often relies on a single economic objective. Environmental and social dimensions are generally not explicitly assessed, but the resolution of these problems evidently contributes to designing sustainable supply chain networks.
Undesirable facilities are those facilities that have adverse effects on people or the environment. They generate some form of pollution, nuisance, potential health hazard, or danger to nearby residents; they also may harm nearby ecosystems [Melachrinoudis, 2011]. Thus, the modeling of SCND problems that include undesirable facilities often implicitly include environmental or social aspects.
On that basis, 87 papers were identified. In the following, they are denoted as reference papers and listed in a separate category in the reference list in the end of this review.
2.2
Position in the literature
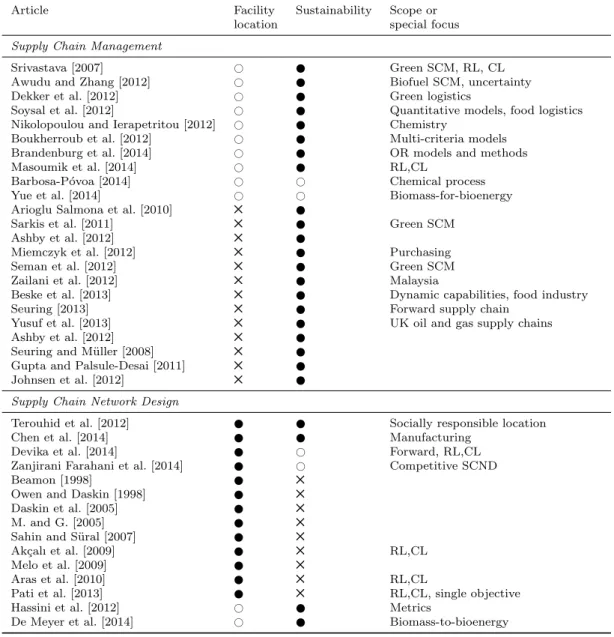
As many review papers have been written in neighboring domains, we needed to check whether the scope of the present paper was not already covered by the existing literature. Table 1 summarizes the reviews published in related areas. The symbol in columns 2 means that the corresponding paper considers facility location as a main topic. The symbols # and 5 mean that facility location is one topic among others or is not studied in the paper. The symbols have the same meaning in further tables.
We can classify the review papers in two categories. The first category gathers papers dealing with Supply Chain Management in general. In these papers, facility location is either not studied or is only one feature among many others. For example, Brandenburg et al. [2014] mention network design as one out of 13 application areas. They mention 13 papers in this area, all except one being published between 2010 and 2013. Seuring [2013] indicates that more than 300 articles have been published in the last 15 years on the topic of green or sustainable (forward) supply chains, only 36 articles of which apply quantitative models. Note that the review by Barbosa P´ovoa [Barbosa-P´ovoa, 2014] concerns supply chain management, but with a strong emphasis on supply chain network design. The second category regroups review papers on SCND. Only 5 of them deal with sustainability.
Table 2 details the content of the reviews which could potentially cover the sections 3, 5 and 6 of our work: LCA based approaches (column 4), optimization models (column 5) and optimization methods (column 6). The last column reports the number of references also mentioned in the present review.
Several reviews are dedicated to one activity: chemical and process industries [Barbosa-P´ovoa, 2014, Nikolopoulou and Ierapetritou, 2012], biomass-to-energy [De Meyer et al., 2014, Yue et al., 2014].
Boukherroub et al. [2012] focus on multi-criteria decision making models for supply chain design. They point 42 papers with environmental or social concern, and 43 papers with facility location decisions, 12 of them having both characteristics. The broad review by Dekker et al. [2012] contains one section on
Table 1: Existing reviews in related areas. RL = Reverse Logistics, CL = Closed-Loop
Article Facility Sustainability Scope or
location special focus
Supply Chain Management
Srivastava [2007] # Green SCM, RL, CL
Awudu and Zhang [2012] # Biofuel SCM, uncertainty
Dekker et al. [2012] # Green logistics
Soysal et al. [2012] # Quantitative models, food logistics
Nikolopoulou and Ierapetritou [2012] # Chemistry
Boukherroub et al. [2012] # Multi-criteria models
Brandenburg et al. [2014] # OR models and methods
Masoumik et al. [2014] # RL,CL
Barbosa-P´ovoa [2014] # # Chemical process
Yue et al. [2014] # # Biomass-for-bioenergy
Arioglu Salmona et al. [2010] 5
Sarkis et al. [2011] 5 Green SCM
Ashby et al. [2012] 5
Miemczyk et al. [2012] 5 Purchasing
Seman et al. [2012] 5 Green SCM
Zailani et al. [2012] 5 Malaysia
Beske et al. [2013] 5 Dynamic capabilities, food industry
Seuring [2013] 5 Forward supply chain
Yusuf et al. [2013] 5 UK oil and gas supply chains
Ashby et al. [2012] 5
Seuring and M¨uller [2008] 5
Gupta and Palsule-Desai [2011] 5
Johnsen et al. [2012] 5
Supply Chain Network Design
Terouhid et al. [2012] Socially responsible location
Chen et al. [2014] Manufacturing
Devika et al. [2014] # Forward, RL,CL
Zanjirani Farahani et al. [2014] # Competitive SCND
Beamon [1998] 5
Owen and Daskin [1998] 5
Daskin et al. [2005] 5
M. and G. [2005] 5
Sahin and S¨ural [2007] 5
Ak¸calı et al. [2009] 5 RL,CL
Melo et al. [2009] 5
Aras et al. [2010] 5 RL,CL
Pati et al. [2013] 5 RL,CL, single objective
Hassini et al. [2012] # Metrics
Table 2: Existing reviews in related areas
Article Facility Sustainability LCA Optimization Optimization # of shared
location models methods references
Nikolopoulou and Ierapetritou [2012] # # # 12
Boukherroub et al. [2012] # 12 Dekker et al. [2012] # 5 # 5 7 De Meyer et al. [2014] # 5 5 Barbosa-P´ovoa [2014] # # 5 # # 7 Yue et al. [2014] # # # # # 12 Terouhid et al. [2012] 5 5 5 1 Chen et al. [2014] 5 5 5 1 Devika et al. [2014] # 5 10
Zanjirani Farahani et al. [2014] # 5 5 5 9
facility location (7 shared papers).
Terouhid et al. [2012] and Chen et al. [2014] propose a framework for classifying the sustainability characteristics. They study the factors affecting location decisions, but these reviews do not review the quantitative models and methods. Devika et al. [2014] is a research paper including a section with a review of the literature.
We conclude that none of these reviews addresses the subject of OR models and methods for sustain-able supply chain network design.
2.3
Distribution across the time period and main journals
Figure 2.3 displays the yearly distribution of the reference papers. A remarkable fact is that almost 90% of these papers have been published since 2008, making it clear that sustainable SCND has been receiving growing attention.
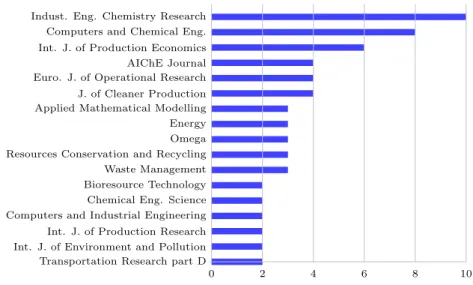
The reference papers can be found in 41 distinct journals, only 17 of them having published more than 1 paper. Figure 2.3 shows the distribution of the reference papers in these 17 journals, which represent 72% of the reference papers. The high number of papers in Computers and Chemical Engineering and Industrial & Engineering Chemistry Research underlines the importance of sustainability in chemical and process industry. Many papers are published in journals which focus on sustainability or on one field of application. For example, Resources, Conservation and Recycling and Waste Management fall into this category. On the other hand, the papers published in Industrial Engineering and Operational Research journals are spread out in a large variety of journals.
2.4
The 3 dimensions of sustainable development
The reference papers do not all address the 3 dimensions of sustainable development: economic aspects, environmental performance and social responsibility. Figure 2.4 shows their distribution with respect to these dimensions. This distribution is consistent with that already observed in other reviews, such as Chen et al. [2014]. The paucity of papers including social aspects has been already observed by many preceding reviews, and this is even more striking in quantitative models.
3
Environmental Supply Chain Network Design
Network design mathematical models traditionally aimed at minimizing cost or maximizing profit, with very little consideration of environmental objectives and constraints. The increasing importance of
en-0 2 4 6 8 10 12 14 16 18 20 22 24 26 28 30 32 34 36 38 40 42 44 46 1991 1994 1997 2000 2003 2006 2009 2012 1993 1996 1999 2002 2005 2008 2011 2014 period of publication number of articles
Figure 1: Time distribution of reference papers
0 2 4 6 8 10
Indust. Eng. Chemistry Research Computers and Chemical Eng. Int. J. of Production Economics AIChE Journal Euro. J. of Operational Research J. of Cleaner Production Applied Mathematical Modelling Energy Omega Resources Conservation and Recycling Waste Management Bioresource Technology Chemical Eng. Science Computers and Industrial Engineering Int. J. of Production Research Int. J. of Environment and Pollution Transportation Research part D
Social Economic Environmental 3 74 0 10
Figure 3: Distribution of reference papers with respect to the 3 sustainability dimensions
vironmental issues has prompted decision-makers to incorporate environmental factors fully into the decision process [Ilgin and Gupta, 2010], giving birth to Environmental Supply Chain Network De-sign (ESCND). In other words, ESCND generalizes SCND by incorporating environmental factors, which may concern facilities, transportation modes, processes, product design, technological choices, etc. As shown for example in the case study in You and Wang [2011], the optimal solutions of pure economic, environmental or intermediate models differ a lot.
This raises several questions that should be clarified when designing supply chains. Which environ-mental factors should be considered? How can they be quantified? How can they be integrated into mathematical models and optimization methods?
Table 4 in Brandenburg et al. [2014] or Table 1 in Seuring [2013] show that many possible way to model environmental decision making: Life Cycle Assessment (LCA), reasoning maps, Analytic Hierar-chy Process (AHP), Analytic Network Process (ANP), Data Envelopment Analysis (DEA), equilibrium models, simulation, etc. However, LCA is the most commonly used technique and it is particularly con-venient to integrate its output in optimization models. Moreover, this technique is a general framework for a holistic assessment of a supply chain from extraction of raw material to disposal of end products. Thus, in subsection 3.1, we focus on papers which assess supply chain environmental impact through an LCA approach. Some reference papers adopt a full LCA approach and others only calculate one or a few LCA indicators which are further integrated into optimization models. These two approaches will be discussed in sections 3.1.2. Subsection 3.2 concerns papers that do not adopt an LCA approach. They rather propose partial assessment of environmental factors, focused on one or several dominating aspects of the application considered, for example emissions caused by transportation or facilities.
3.1
LCA based models
LCA assesses environmental impacts associated with all stages of a product life-cycle from raw material extraction to final disposal or recycling [ISO, 2006]. It compiles and evaluates inputs, outputs and potential environmental impacts of a product system throughout its manufacturing process (see the reviews by Azapagic [1999] and Pieragostini et al. [2012]), its life-cycle and all related supply chain decisions.
The Figure 4 represents the four main steps of LCA as defined by the ISO 14040 and 14044 standards [ISO, 2006].
Goal and scope definition Inventory analysis Impact assessment Interpretation 1 2 3 4
Figure 4: Conceptual framework of LCA [ISO, 2006]
and boundaries of the system.
2. Inventory analysis is inventory of all flows from and to nature for a product system. All emissions (in air, water and soil), extractions and land use are listed and quantified.
3. Impact assessment measures environmental impact of all emissions listed in the preceding step. 4. Results interpretation consists in analyzing and interpreting results of each of the three preceding
steps. The outcome of the interpretation phase is a set of conclusions and recommendations for the study.
We found 39 papers that integrate principles of LCA into their supply chain network design models. Among the four LCA steps, we review the goal and scope definition and the impact assessment steps. The inventory analysis is an important intermediate step but it is directly related to supply chain decisions. The mathematical models resulting from the preceding steps are considered by several authors as a part of the interpretation step.
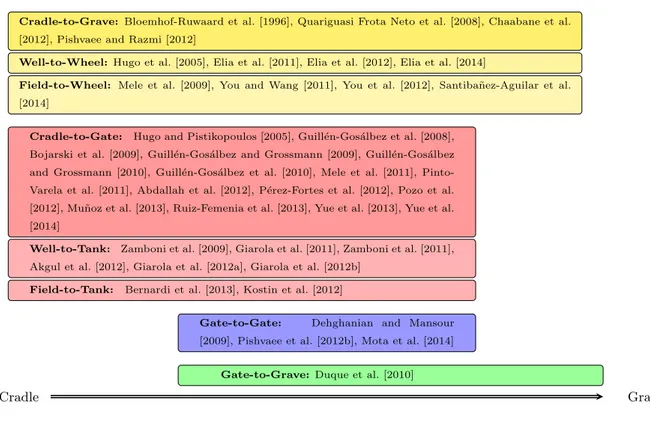
3.1.1 Scope definition
To determine boundaries of the supply chain is the first critical decision in LCA.
The cradle-to-grave scope assumes a comprehensive assessment of environmental impact through the whole supply chain from raw material to materials processing, manufacture, distribution, use, repair and maintenance, disposal and recycling. This category regroups 12 papers. In the context of fuel supply chains, cradle-to-grave is called well-to-wheel (WTW). For example, Elia et al. [2011] provide an analysis for hybrid coal, biomass, and natural gas to liquid (CBGTL) plants. The supply chain described includes both cultivation of biomass and coal and natural gas mining, followed by industrial and logistics operations. In the context of biomass supply chains, cradle-to-grave is called field-to-wheel (FTW). This is applied to cellulosic ethanol [You et al., 2012], sugar cane to ethanol [Mele et al., 2009] or to a general “biomass-to-liquid” supply chain [You and Wang, 2011].
The cradle-to-gate scope concerns all steps from extraction to the factory gate (23 papers). This scope is frequent for B2B companies having multiple customers. In fuel supply chains, this LCA scope is called well-to-tank in order to distinguish the GHG emitted during fuel production from those emitted by the vehicle operations. It is called field-to-tank in biomass supply chains.
Gate-to-gate (3 papers) generally concerns companies in intermediate echelons of a supply chain, which manufacture or transform and deliver goods to their customers without extracting raw materials
Cradle Grave
Cradle-to-Grave: Bloemhof-Ruwaard et al. [1996], Quariguasi Frota Neto et al. [2008], Chaabane et al. [2012], Pishvaee and Razmi [2012]
Well-to-Wheel: Hugo et al. [2005], Elia et al. [2011], Elia et al. [2012], Elia et al. [2014]
Field-to-Wheel: Mele et al. [2009], You and Wang [2011], You et al. [2012], Santiba˜nez-Aguilar et al. [2014]
Cradle-to-Gate: Hugo and Pistikopoulos [2005], Guill´en-Gos´albez et al. [2008], Bojarski et al. [2009], Guill´en-Gos´albez and Grossmann [2009], Guill´en-Gos´albez and Grossmann [2010], Guill´en-Gos´albez et al. [2010], Mele et al. [2011], Pinto-Varela et al. [2011], Abdallah et al. [2012], P´erez-Fortes et al. [2012], Pozo et al. [2012], Mu˜noz et al. [2013], Ruiz-Femenia et al. [2013], Yue et al. [2013], Yue et al. [2014]
Well-to-Tank: Zamboni et al. [2009], Giarola et al. [2011], Zamboni et al. [2011], Akgul et al. [2012], Giarola et al. [2012a], Giarola et al. [2012b]
Field-to-Tank: Bernardi et al. [2013], Kostin et al. [2012]
Gate-to-Gate: Dehghanian and Mansour [2009], Pishvaee et al. [2012b], Mota et al. [2014]
Gate-to-Grave: Duque et al. [2010]
Figure 5: LCA scopes
or playing any role in disposal of of-life products. This scope is also used in transformation of end-of-life products which are re-used in the same or another supply chain. For example, Dehghanian and Mansour [2009] study a recovery network for scrap tires which can be used as a substitute for fuel in cement plants.
Gate-to-Grave (1 paper) focuses on the last steps of a supply chain, from factory gate to product disposal. This scope is convenient in the study of waste supply chains or reverse logistics activities. 3.1.2 Life-Cycle Impact Assessment
The goal of life-cycle impact assessment (LCIA) is to express the complex output of inventory analysis into a few environmental areas of interest. Mid-point oriented LCIA methods cover various impact categories such as greenhouse effect (or climate change), natural resource depletion, stratospheric ozone depletion, acidification, eutrophication, human toxicity, aquatic toxicity, etc. Damage-oriented methods (or endpoint methods) aggregate mid-point categories into fewer categories of damage: damage to human health, ecosystem health or damage to resources. There exist several LCIA methodologies, which include different midpoint and endpoint categories.
In the mathematical models described in the reference papers, the environmental assessment can be based either on midpoint or endpoint categories. Models can include exhaustive LCA or only a small subset of pertinent impact categories. We call the latter approach an LCA-based approach.
LCIA methods
The Table 3 lists papers based on endpoint methodologies. Three methods are described in reference papers: Eco-Indicator 99 (EI-99), Impact 2002+ and ReCiPe.
Table 3: LCIA methods
Method Articles
Eco-Indicator 99 (EI-99) Pishvaee and Razmi [2012], Hugo and Pistikopoulos [2005], Guill´ en-Gos´albez et al. [2008], Guill´en-Gos´albez and Grossmann [2009], Duque et al. [2010], Guill´en-Gos´albez and Grossmann [2010], Mele et al. [2011], Abdallah et al. [2012], Pozo et al. [2012], Dehghanian and Man-sour [2009], Chaabane et al. [2012], Kostin et al. [2012],Santiba˜ nez-Aguilar et al. [2014],Yue et al. [2013]
IMPACT 2002+ Bojarski et al. [2009], P´erez-Fortes et al. [2012], Mu˜noz et al. [2013]
CML92 Bloemhof-Ruwaard et al. [1996]
ReCiPe Mota et al. [2014]
Eco-indicator 99 [Goedkoop and Spriensma, 2000] gathers 11 impact categories into three damage categories (human health, ecosystem quality and resources). The overall environmental impact is finally measured as a single metric. EI-99 is chosen in 15 papers, mainly with a cradle-to-gate scope.
Depending of the industrial activity, some impact categories can be omitted. For example, in the con-text of chemical supply chain, Hugo and Pistikopoulos [2005] use the 10 most relevant impact indicators. IMPACT 2002+ [Jolliet et al., 2003] has 14 midpoint indicators and 4 categories of damage: human health, quality of ecosystems, climate change and resource depletion. It is used in 3 papers with a cradle-to-gate scope. In these papers, an overall environmental objective is the sum of all endpoint damages for each facility in the supply chain.
CML92 is used in Bloemhof-Ruwaard et al. [1996] with seven impact categories. ReCiPe [Goedkoop et al., 2009] has 18 midpoint categories combined into 3 endpoint damage categories (human health, ecosystems, resource surplus cost). This method also results in one single score.
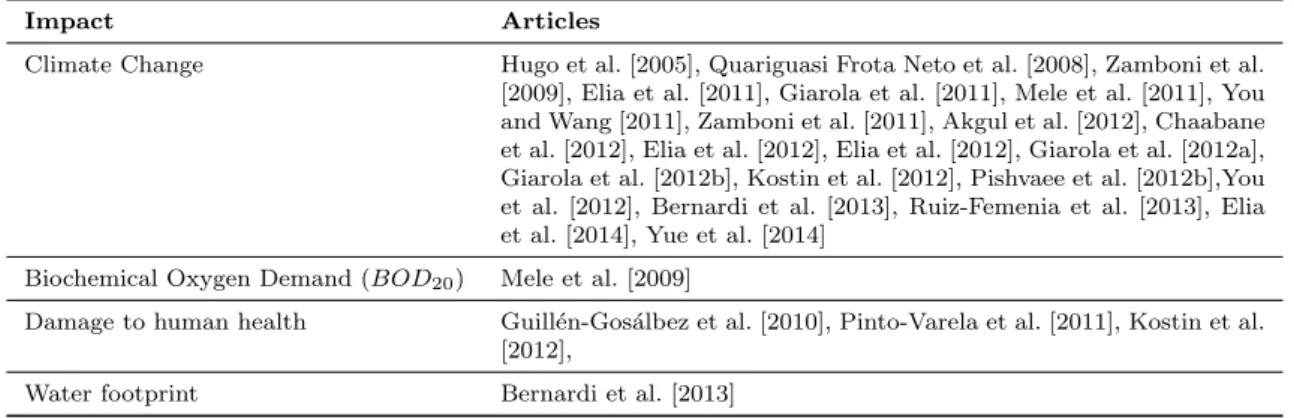
Impact categories
The score provided by Eco-Indicator 99 or ReCipe can be easily incorporated into optimization models as an environmental objective function. However, although they use this approach, Pishvaee and Razmi [2012] claim that LCA process is costly, time consuming and needs expertise in environmental manage-ment. Several authors do not lead an exhaustive LCIA approach and only borrow one or a few impact categories which are directly integrated into their mathematical models. The papers that adopt this approach are listed in Table 4.
Table 4: Impact categories and indicators
Impact Articles
Climate Change Hugo et al. [2005], Quariguasi Frota Neto et al. [2008], Zamboni et al.
[2009], Elia et al. [2011], Giarola et al. [2011], Mele et al. [2011], You and Wang [2011], Zamboni et al. [2011], Akgul et al. [2012], Chaabane et al. [2012], Elia et al. [2012], Elia et al. [2012], Giarola et al. [2012a], Giarola et al. [2012b], Kostin et al. [2012], Pishvaee et al. [2012b],You et al. [2012], Bernardi et al. [2013], Ruiz-Femenia et al. [2013], Elia et al. [2014], Yue et al. [2014]
Biochemical Oxygen Demand (BOD20) Mele et al. [2009]
Damage to human health Guill´en-Gos´albez et al. [2010], Pinto-Varela et al. [2011], Kostin et al. [2012],
Climate change is often quantified by the Global Warming Potential (GWP) indicator [IPCC, 2007]. It is captured by inventorying CO2, CH4, N2O emissions and regrouping them in a single indicator expressed as CO2-equivalent emissions during a predefined period, typically 100 years. GWP is mainly used with cradle-to-grave, well-to-wheel, field-to-wheel and well-to-tank scopes.
It is often used as a single indicator of environmental impact or is completed with some application dependent indicators: Bernardi et al. [2013] consider GWP and water footprint, which indicates the amount of freshwater consumed or polluted during the whole production process of a commodity.
Mele et al. [2009] measure environmental performance with biochemical oxygen demand (BOD20),
because of its importance as an indicator of pollution of watercourses.
There can be two reasons for resorting to partial LCIA approach instead of exhaustive LCIA: simpli-fying calculation or focusing on impacts which are most relevant for the application considered. Guill´ en-Gos´albez et al. [2010] explore the environmental benefits of adopting a hydrogen economy, in terms of overall contribution to climate change. For this reason, instead of calculating the EI-99 itself, they focus on only one of its impact categories: damage to human health caused by climate change. Pinto-Varela et al. [2011] calculate a partial EI-99 by only considering damage to human health caused by electricity and diesel consumption. Other authors choose to consider individual impact indicator to complement one LCIA score. Kostin et al. [2012] consider three impact categories from the EI-99 (damage to human health, damage to eco-system quality, damage to resource), the EI-99 itself, and the GWP. Mele et al. [2011] consider the EI-99 and the GWP.
3.2
Partial assessment of environmental factors
For various reasons, implementing a methodology such as LCA is not always possible. Awareness of environmental concerns in companies is generally gradual, so that assessing only a subset of environmental factors can be viewed as an intermediate step towards full integration. Partial assessment of environmental factors also makes sense when obtaining environmental data and modeling the whole supply chain is too difficult. This section has a structure similar to that of the preceding section. We first review the scope chosen for integrating environmental concerns, i.e. which activity in the supply chain is concerned. Then, we list the performance measures used in each paper.
3.2.1 Scope
The easiest way to partially assess environmental factors has been to enrich traditional SCND models with one or a number of environmental objectives, constraints or parameters. This keeps the focus on logistics operations in the supply chain, while integrating new concerns into the decision process. For example, knowing that transport and industrial facilities account for 22% and 20% of global CO2 emissions respectively [OECD/IEA, 2012], several SCND models integrate CO2emissions due to transport or facilities.
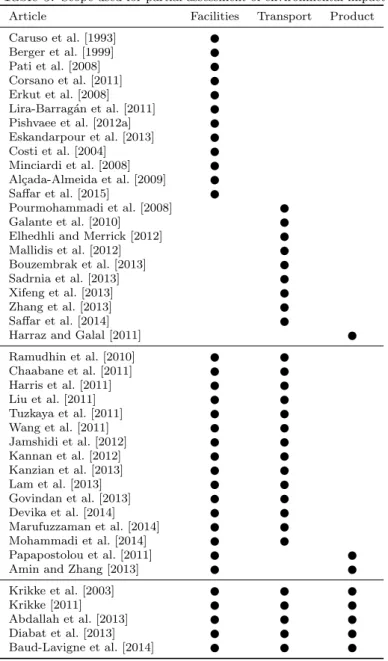
Table 5 list three categories in which environmental criteria are most often incorporated: facilities, transport and product related criteria. Next paragraphs detail the content of this table.
• Facilities
Since facility location is a central decision in SCND models, integrating environmental impact of facilities into mathematical models seems to be natural. This impact is considered in 28 of the papers in Table 5, but surprisingly enough only 6 of them measure the GHG emissions due to facilities. The most classic metric to assess the environmental impact of facilities is energy consumption, which can depend on sizing decisions and technological choices. The models by Amin and Zhang [2013], Caruso et al. [1993], Costi et al. [2004], Galante et al. [2010], Lam et al. [2013], Papapostolou et al. [2011], Pishvaee et al. [2012a] and Wang et al. [2011] include the choice between
Table 5: Scope used for partial assessment of environmental impact
Article Facilities Transport Product
Caruso et al. [1993] Berger et al. [1999] Pati et al. [2008] Corsano et al. [2011] Erkut et al. [2008] Lira-Barrag´an et al. [2011] Pishvaee et al. [2012a] Eskandarpour et al. [2013] Costi et al. [2004] Minciardi et al. [2008] Al¸cada-Almeida et al. [2009] Saffar et al. [2015]
Pourmohammadi et al. [2008] Galante et al. [2010]
Elhedhli and Merrick [2012] Mallidis et al. [2012] Bouzembrak et al. [2013] Sadrnia et al. [2013] Xifeng et al. [2013] Zhang et al. [2013] Saffar et al. [2014] Harraz and Galal [2011] Ramudhin et al. [2010] Chaabane et al. [2011] Harris et al. [2011] Liu et al. [2011] Tuzkaya et al. [2011] Wang et al. [2011] Jamshidi et al. [2012] Kannan et al. [2012] Kanzian et al. [2013] Lam et al. [2013] Govindan et al. [2013] Devika et al. [2014] Marufuzzaman et al. [2014] Mohammadi et al. [2014] Papapostolou et al. [2011] Amin and Zhang [2013] Krikke et al. [2003] Krikke [2011] Abdallah et al. [2013] Diabat et al. [2013] Baud-Lavigne et al. [2014]
competing technologies as decision variables. Pishvaee et al. [2012a] integrate the average amount of waste generated with each technology in their environmental and social objective function. Other measures include the number of obnoxious facilities installed [Eskandarpour et al., 2013] (which is influenced by technological choices) or the risk placed on the nearby population [Al¸cada-Almeida et al., 2009].
• Transport
One of the easiest ways to incorporate environmental criteria into pure economic models is to cal-culate emissions of GHG and partical-culates due to transport. Tools for calculating and converting emissions into a single CO2 equivalent measurement can be provided by national or regional orga-nizations, such as the Mobile6 software used by Elhedhli and Merrick [2012] for heavy duty diesel vehicles.
Some models integrate selection of transportation modes into strategic network design decisions. In these models, transportation modes generally compete on cost, environmental impact and capacity. The choice between transportation modes can also be determined by loading/unloading conditions, frequency, minimum lot-size etc.
Since SCND models generally consider aggregated data, operational characteristics such as vehicle speed and daily variations are mostly ignored. We did not find any reference considering more global assessment of transportation, such as impact of vehicles on road network.
• Process and product design
Decisions concerning product flows and design can also be fully integrated into environmental SCND. Krikke et al. [2003] propose a Mixed-Integer Linear Program (MILP) whose decision vari-ables concern both network design and product design. They analyze interactions between both types of variables and conclude that logistics network structure has most impact on costs, whereas product design has most impact on energy and waste. Abdallah et al. [2013] observe that price of raw material increases as the product becomes greener. Thus, supplier selection has contradictory impact on cost and environmental dimension [Kumar et al., 2014]. Amin and Zhang [2013] assess impact of choosing environmentally-friendly materials in the production process.
3.2.2 Performance measures
According to Krikke et al. [2003] or Harraz and Galal [2011], given LCA complexity, it becomes regular practice to use more pragmatic indicators such as residual waste and energy used.
Ahi and Searcy [2015] identified 2555 unique metrics to measure performance in green and sustainable supply chains. Due to lack of a generic assessment methodology, a wide range of ad hoc performance measures have been developed to assess environmental performance of a supply chain, so that identifying the most appropriate performance measures is still a challenging issue [Nikolopoulou and Ierapetritou, 2012].
Table 6 details the metrics found in the reference papers for assessing the environmental impact. Columns 2–6 report various families of performance measures: GHG emissions (column 2), amount of waste generated (column 3), energy consumption (column 4), amount of material recycled (column 5) and others measures (column 6).
• Carbon footprint
The most popular metric for measuring environmental impact is the carbon footprint, which is the total amount of GHG emitted by a company or a supply chain (25 papers). All GHG emissions may be considered, but for practical reasons, baseline indicators with only CO2, CH4 and N2O are also used [Wright et al., 2011]. For example, Jamshidi et al. [2012] consider two objective functions:
Table 6: Metrics used for partial assessment of environmental impact
Article GHG Waste Energy Material Others
emissions use recovery
Ramudhin et al. [2010] Chaabane et al. [2011] Krikke [2011] Wang et al. [2011]
Elhedhli and Merrick [2012] Jamshidi et al. [2012] Kannan et al. [2012] Mallidis et al. [2012] Abdallah et al. [2013] Diabat et al. [2013] Govindan et al. [2013] Kanzian et al. [2013] Sadrnia et al. [2013] Xifeng et al. [2013] Zhang et al. [2013] Baud-Lavigne et al. [2014] Marufuzzaman et al. [2014] Saffar et al. [2014] Saffar et al. [2015] Caruso et al. [1993] Berger et al. [1999] Lira-Barrag´an et al. [2011] Pishvaee et al. [2012a] Eskandarpour et al. [2013] Galante et al. [2010] Pati et al. [2008]
Lira-Barrag´an et al. [2013] Verma et al. [2013]
Al¸cada-Almeida et al. [2009] Liu et al. [2011] Lam et al. [2013] Devika et al. [2014] Harris et al. [2011] Tuzkaya et al. [2011] Krikke et al. [2003] Harraz and Galal [2011] Amin and Zhang [2013] Corsano et al. [2011] Papapostolou et al. [2011] Costi et al. [2004] Erkut et al. [2008] Minciardi et al. [2008] Bouzembrak et al. [2013] Mohammadi et al. [2014] Pourmohammadi et al. [2008]
one minimizes the total costs within the supply chain and the other one minimizes dangerous gases produced, such as NO2, CO and Volatile Organic Compounds.
GHG emissions are not always calculated explicitly. In Pourmohammadi et al. [2008] the amount of GHG emitted is considered through an input-output approach to estimate the cost of air pollution. In Harris et al. [2011], the quantity of energy used is a mean to estimate GHG emissions.
• Waste generated, energy use, material recovery and other measures
Environmental performance can be measured by many possible criteria which generally arise from the economic sector concerned. The quantity of waste generated is mentioned in 16 papers, the use of energy is included in 8 models and the material recovery in 7 models. For example, Pati et al. [2008] measure the value of wastepaper recovered by a paper recycling system. Amin and Zhang [2013] measure the use of renewable and recycled energy, such as solar power. Finally, 7 papers use criteria that cannot be classified in the preceding categories. Other metrics include use of water [Caruso et al., 1993, Lira-Barrag´an et al., 2013, Papapostolou et al., 2011], noise pollution [Bouzembrak et al., 2013, Mohammadi et al., 2014] or an overall estimation of long-term impact and cleanup cost of oil-spill caused by vessels [Verma et al., 2013]. Pourmohammadi et al. [2008] measure a virgin material opportunity costs which is the extra expense that a firm is willing to pay when it refuses to substitute the virgin material market by an acceptable recycled material. Other metrics are sometimes not detailed, such as the land specific technical requirement in Tuzkaya et al. [2011].
3.3
Conclusion
The integration of environmental criteria in SCND is a natural idea for activities with a high impact. The 83 papers dealing with environmental SCND share almost equally between LCA (39) and non-LCA (44) approaches. The most popular LCIA methods are Eco-Indicator 99 and Impact 2002+. To our knowledge, ReCipe has been used only in Mota et al. [2014]. Since it is a more recent method and it provides a single score, more authors are likely to use it in forthcoming years. As far as impact indicators are concerned, GWP is particularly designed for very long-horizon activities such as process industries or fuel/energy supply chains. Other indicators are used when they are relevant for their respective domain of application. Non-LCA approaches measure environmental performance on tangible domains (facilities, transport, product design) and measures (GHG emission, waste produced, energy used etc.). This goes along with a collection of various ad hoc measures depending on the application considered.
Finally, let us point out 2 papers about sustainable extensions to special facility location problems: the hub location problem [Mohammadi et al., 2014] and the location routing problem [Govindan et al., 2013]. Incorporating environmental criteria into these problems seems to be a novel research issue.
4
Social Supply Chain Network Design
Social sustainability has been examined to a far lesser degree than environmental or green supply chain management [Seuring and M¨uller, 2008]. Furthermore the definition of social sustainability itself is still under development [Benoˆıt-Norris, 2014]. Social sustainability in supply chains addresses issues of social justice and human rights with studies focusing on practices such as supplier human rights actions, labor conditions, codes of practices and social auditing, supplier compliance with child labor laws, and the delivery of social equity through sourcing from diverse suppliers in terms of gender, size, ethnicity and avoidance of conflicts of interest. Including social aspects in network design decisions allows to better evaluate the impact of a supply chain on its stakeholders: employees, customers and local communities. This also helps obtaining consistency between qualitative and quantitative decisions.
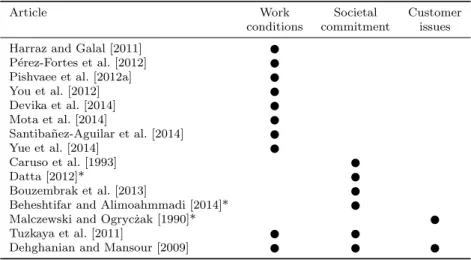
We analyze 13 references papers having an assessment of social impact with the framework proposed in Chardine-Baumann and Botta-Genoulaz [2014]. The Table 7 presents this classification. Columns 2 to 4 correspond to 3 of the 5 fields proposed in Chardine-Baumann and Botta-Genoulaz [2014]. It is worth noting than no paper addresses the two last fields: human rights (child and forced labor, freedom of association, discrimination) and business practice (fight against corruption, fair-trading, promotion of corporate social responsibility in the sphere of influence). Reference papers followed by a * do not include the environmental dimension.
Table 7: Models with the social dimension
Article Work Societal Customer
conditions commitment issues
Harraz and Galal [2011] P´erez-Fortes et al. [2012] Pishvaee et al. [2012a] You et al. [2012] Devika et al. [2014] Mota et al. [2014]
Santiba˜nez-Aguilar et al. [2014] Yue et al. [2014]
Caruso et al. [1993] Datta [2012]*
Bouzembrak et al. [2013]
Beheshtifar and Alimoahmmadi [2014]* Malczewski and Ogryc ˙zak [1990]* Tuzkaya et al. [2011]
Dehghanian and Mansour [2009]
In the field work conditions, employment is the main social indicator used in literature. The number of jobs created is considered by most authors, with slight variations. Mota et al. [2014] define a social benefit indicator which prefers job creation in the less developed regions. Devika et al. [2014] distinguish the fixed jobs opportunities (which are independent of the level of activity ) from the variables jobs (which increase with the level of activity). Dehghanian and Mansour [2009] aim at creating jobs in the widest range of communities. They maximize the number of facilities installed, which corresponds to the idea of fixed jobs in Devika et al. [2014]. The damage to workers and security measures, such as the exposure to chemical elements is considered in Dehghanian and Mansour [2009] and Pishvaee et al. [2012a].
The Societal commitment field regroups all decisions contributing to improve a population’s health, education, culture [Datta, 2012]. It includes local development policies [Dehghanian and Mansour, 2009], equity in access to healthcare [Beheshtifar and Alimoahmmadi, 2014], the impact of the supply chain on real estate [Bouzembrak et al., 2013], but also the political opposition [Caruso et al., 1993, Tuzkaya et al., 2011].
The field customer issues regroup all impacts individually affecting each customers. Malczewski and Ogryc˙zak [1990] consider the environmental pollution at hospital sites as a social criterion since its impact relates directly to patients and users. In Dehghanian and Mansour [2009], the customer issue concerns the risk of using recycled material.
As pointed by several previous reviews, including social concerns into sustainable SCND models raises many modeling and assessment difficulties. First of all, social responsibility is a fully multi-disciplinary and multi-stakeholder issue [Pishvaee et al., 2012a]. As a consequence, social performance is generally hard to model with pertinent quantitative indicators. For example, Chaabane et al. [2012] state that tangible indicators such as noise and pollution can play the role of indicators of both environmental and social performance. However, they do not integrate them in their MILP since they do not identify good measures of social sustainability. Moreover, social and environmental impacts sometimes strongly
interact. Pishvaee et al. [2012a] aggregate three social impacts and one environmental impact (amount of waste generated) into a single indicator. Since the social impact is often qualitative by nature, it is difficult to build a single metric to measure it. Multi-Criteria Decision Making (MCDM) can be a suitable tool to overcome this problem. Dehghanian and Mansour [2009] aggregate their four social criteria into a single indicator with an Analytical Hierarchy Process (AHP) [Saaty, 1990]. AHP is also used in Datta [2012]. Hence, selecting the most appropriate criteria and incorporating them into mathematical models are still challenging issues.
5
Modeling Approaches
In this section, we review the main characteristics of mathematical models for sustainable supply chain design problems. Such problems have resulted in a large variety of models. This can be explained not only by the variety of industrial contexts (single or multiple period, single or multiple products, structure of the logistics network), but also by modeling issues: single or multiple objectives, deterministic or uncertain data.
The main decision variables in SCND models are binary variables concerning the location of facilities, sizing decisions, the selection of suitable technology levels and the selection of transportation modes between facilities. Since product flows along the supply chain are generally modeled by continuous constraint, the SCND models are often mixed-integer formulations, which can be linear or nonlinear. Some stochastic models are also found that enable the consideration of uncertainties such as the demand level.
The section is organized into two parts. In section 5.1, we review the models with a single objective function. This objective can be either economic or environmental, but is never social only. Multi-objective models are then described in section 5.2. Both sections are divided into two subsections, describing deterministic and stochastic models, respectively.
5.1
Models with a single objective
The easiest way to incorporate environmental issues into classic SCND models is to express the objective function as a weighted average of all objective functions. This requires applying conversion factors to convert non-homogeneous measures into a single one.
For example, when the whole environmental impact can be expressed through a quantity of GHG emis-sions, it is possible to convert the environmental impact into its monetary equivalent by using conversion factors. Then the monetized environmental damage can be aggregated with the economic objective into a single objective.
The main characteristics of single objective deterministic and stochastic models are summarized in Table 8.
5.1.1 Deterministic models
As mentioned above, some authors consider the economic objective as the main one and represent the environmental dimension by constraints in their models. These constraints may express a maximal autho-rized level of GHG emissions. For example, the objective function in Elia et al. [2011] is to minimize the cost of facility investment, feedstock purchase and transportation. The authors introduce an environmen-tal constraint by imposing an overall GHG emission target level for each hybrid coal, biomass and natural liquid gas plant. Papapostolou et al. [2011] consider a pure economic objective function. Environmental constraints limiting the land use and water consumption are included in their linear model.
Other authors mix economic and environmental criteria into the objective function. In Elhedhli and Merrick [2012], the objective function includes two terms related to pollution cost and three terms
Table 8: Models with single objective
Article Dimensions Multi- Multi- Multi-product period mode Linear models
Krikke [2011] Eco - Env Datta [2012] Eco - Soc Elhedhli and Merrick [2012] Eco - Env Kannan et al. [2012] Eco - Env Bloemhof-Ruwaard et al. [1996] Eco - Env Liu et al. [2011] Eco - Env Papapostolou et al. [2011] Eco - Env Abdallah et al. [2012] Eco - Env Abdallah et al. [2013] Eco - Env Amin and Zhang [2013] Eco - Env Diabat et al. [2013] Eco - Env Mallidis et al. [2012] Eco - Env Bouzembrak et al. [2013] Eco - Env - Soc Elia et al. [2011] Eco - Env Elia et al. [2012] Eco - Env Elia et al. [2014] Eco - Env Stochastic linear models
Verma et al. [2013] Eco - Env Giarola et al. [2012a] Eco - Env Non-linear models
Lira-Barrag´an et al. [2013] Eco - Env Verma et al. [2013] Eco - Env Costi et al. [2004] Eco - Env Corsano et al. [2011] Eco - Env Lira-Barrag´an et al. [2011] Eco - Env
related to the cost of logistics operations. In Abdallah et al. [2012] and Kannan et al. [2012] the objective function is the sum of various logistics costs and an additional term associated with CO2emissions above the amount allocated by the government.
Lira-Barrag´an et al. [2011] minimize the total annual cost of a new industrial plant which impacts the water quality throughout a surrounding watershed. The objective function includes the wastewater treatment costs whereas the water quality appears as a constraint. Mallidis et al. [2012] propose a model with several objective functions related to cost, and the emission of CO2 or particulate matters (fine dust). The model is solved with each objective being considered one by one.
Note that Krikke [2011] proposes a linear variant of mixed integer programming: binary facility location variables are pre-fixed, resulting in one linear program for each scenario.
In some of the reference papers, the technical context leads to the formulation of nonlinear models. Costi et al. [2004] propose an MINLP model for the location of treatment facilities for solid waste man-agement. The objective function concerns the economic cost and environmental issues are modeled as constraints. The binary decision variables concern the existence of facilities. Continuous variables model the material flows between facilities. Non-linearity comes from multiplications between continuous vari-ables. Corsano et al. [2011] consider ethanol plant design and ethanol supply chain design simultaneously. Non-linearity arises from some non-convex constraints in the ethanol plant design model.
5.1.2 Stochastic models
By definition, sustainable SCND models aim at impacting the structure of the logistics network of a company in the long term. It is therefore realistic to expect to face uncertainties in the analysis of the problem. This is particularly true for the consideration of the uncertainties on the level of customer demands within a strategic planning horizon. Other factors such as transportation costs or the amount of waste or emissions generated or returned products may also be considered as uncertain parameters. Moreover, the data available at the moment strategic decisions are made are generally aggregated and lose accuracy as the time horizon recedes. A survey on the inclusion of stochastic components in facility location models is proposed by Snyder [2004].
However we found only two references of single objective stochastic models for sustainable SCND problems. Giarola et al. [2012a] propose a MILP for the design of a bio-ethanol supply chain, in which the costs of carbon and biomass are considered as uncertain parameters. To overcome this uncertainty, a two-stage stochastic programming approach is used. Verma et al. [2013] present a two-stage stochastic programming approach which tackles both the location and stockpile of equipment at emergency response facilities that deal with potential oil-spill emergencies on the south cost of Newfoundland in Canada. Their model includes two variants corresponding to linear and non-linear formulation of equipment acquisition cost.
5.2
Multi-objective models
5.2.1 Deterministic models
The deterministic multi-objective models for sustainable SCND are summarized in Table 9 (linear models) and Table 10 (non-linear models)
In practice, most sustainable SCND models are bi-objective linear models. Many authors see the economic objective as the traditional objective function, whereas the environmental or social objectives are considered as extensions of the traditional single objective models. A frequent modeling approach is to consider one economic objective and one environmental objective such as minimizing GHG emissions. Amin and Zhang [2013] extend their mono-objective model by considering an additional environmen-tal objective. In the area of domestic waste treatment, Berger et al. [1999] propose a comprehensive multi-periodic MILP model for the strategic design and tactical planning of an integrated regional solid
Table 9: Deterministic multi-objective linear models
Article Dimensions multi- multi- multi-product period mode Malczewski and Ogryc˙zak [1990] Eco-Soc
Caruso et al. [1993] Eco-Env-Soc Erkut et al. [2008] Eco-Env Minciardi et al. [2008] Eco-Env Al¸cada-Almeida et al. [2009] Eco-Env Dehghanian and Mansour [2009] Eco-Env-Soc Galante et al. [2010] Eco-Env Tuzkaya et al. [2011] Eco-Env-Soc Pozo et al. [2012] Eco-Env Xifeng et al. [2013] Eco-Env Govindan et al. [2013] Eco-Env Devika et al. [2014] Eco-Env-Soc Krikke et al. [2003] Eco-Env Pati et al. [2008] Eco-Env Quariguasi Frota Neto et al. [2008] Eco-Env Harraz and Galal [2011] Eco-Env-Soc Amin and Zhang [2013] Eco-Env Lam et al. [2013] Eco-Env Baud-Lavigne et al. [2014] Eco-Env Hugo et al. [2005] Eco-Env Jamshidi et al. [2012] Eco-Env Kanzian et al. [2013] Eco-Env Sadrnia et al. [2013] Eco-Env Hugo and Pistikopoulos [2005] Eco-Env Pourmohammadi et al. [2008] Eco-Env Mele et al. [2009] Eco-Env Bojarski et al. [2009] Eco-Env Pinto-Varela et al. [2011] Eco-Env Zamboni et al. [2011] Eco-Env Giarola et al. [2012b] Eco-Env P´erez-Fortes et al. [2012] Eco-Env-Soc Zamboni et al. [2009] Eco-Env Ramudhin et al. [2010] Eco-Env Chaabane et al. [2011] Eco-Env Mota et al. [2014] Eco-Env-Soc Marufuzzaman et al. [2014] Eco-Env Berger et al. [1999] Eco-Env Duque et al. [2010] Eco-Env Guill´en-Gos´albez et al. [2010] Eco-Env Giarola et al. [2011] Eco-Env Mele et al. [2011] Eco-Env You and Wang [2011] Eco-Env Akgul et al. [2012] Eco-Env Chaabane et al. [2012] Eco-Env Kostin et al. [2012] Eco-Env You et al. [2012] Eco-Env-Soc Bernardi et al. [2013] Eco-Env Santiba˜nez-Aguilar et al. [2014] Eco-Env-Soc
waste management planning. The model considers several types of treatment technologies and sites for treatment and land-fill as well as the possibility of recycling waste on the markets. Several environmental parameters and indicators may be used.
Chaabane et al. [2012] propose a bi-objective model for the design of an aluminum supply chain. A carbon credit component is included in the economic objective, whereas the second objective is to min-imize the GHG emissions. The model also considers tactical issues such as inventory control decisions. Akgul et al. [2012] propose a multi-period, multi-product MILP model for the optimization of a biofuel supply chain regarding cost and environmental issues. All stages of the biofuel life-cycle, such as culti-vation, transportation and production, are integrated into the proposed model. Quariguasi Frota Neto et al. [2008] propose a bi-objective model to assess the flow of materials, the amount of production at each plant and to select the most suitable end-of-use alternatives, such as refurbishing and recycling. Guill´en-Gos´albez et al. [2010] develop a bi-objective MILP model for a hydrogen supply chain design. The influence of the hydrogen network operation on climate change is investigated as an environmental issue. In chance-constrained programming, the models embed the probability of satisfying constraints subject to uncertain data. The model considers capacity expansion (see also Hugo et al. [2005]).
A two-echelon multiple-vehicle location–routing problem with time windows for optimization of sus-tainable supply chain network of perishable food is studied by Govindan et al. [2013]. They propose a deterministic model involving an economic goal for the minimization of all fixed and variable costs and an environmental goal for the global minimization of environmental impacts of opening manufacturing and distribution facilities and for the emissions due to shipments between facilities.
Very few models have more than three objective functions. Erkut et al. [2008] develop a multi-criteria facility location model for the municipal solid wastes management at the regional level in North Greece. Their MILP model includes 5 objective functions : 1 relative to minimum total cost of facilities implementation and flows, and 4 related to the environmental impacts (GHC effects, landfilling, energy and materials recovery. A solution to the model consists of locations and technologies for transfer stations, material recovery facilities, incinerators and sanitary landfills, as well as the waste flow between these locations.
Table 10: Deterministic multi-objective non-linear models
Article Dimensions multi- multi- multi-product period mode Beheshtifar and Alimoahmmadi [2014] Eco-Soc
Guill´en-Gos´albez et al. [2008] Eco-Env Mu˜noz et al. [2013] Eco-Env Zhang et al. [2013] Eco-Env Eskandarpour et al. [2013] Eco-Env Wang et al. [2011] Eco-Env Yue et al. [2014] Eco-Env-Soc Liu et al. [2011] Eco-Env Yue et al. [2013] Eco-Env
Only a few bi-objective models are non-linear. In Beheshtifar and Alimoahmmadi [2014], one of the objective is to minimize the standard deviation of distances from the place of demand points to the open facilities. Due to economies of scale, Zhang et al. [2013] includes non-linear CO2 emissions due to transportation. In the last five references in the Table, the models can be linearized. Yue et al. [2014] and Yue et al. [2013] linearize their model with the Charnes-Cooper transformation and Glover’s linearization. The authors compare the performance of the linear and non-linear formulations of their models.
5.2.2 Stochastic models
Like many supply chain management problems, SCND problems are subject to uncertainty. Uncertainty can have many different sources, like the level of demand or the proportion of returned products in closed-loop supply chains. Uncertainty can also affect the outputs and depend on the performance of the process. Such an example is the level of GHG emissions. As pointed out by Guill´en-Gos´albez and Grossmann [2009], many uncertainties exist in the life-cycle inventory but many LCA methods assume nominal values for the input data. These authors mention however that the Eco-indicator 99 methodology is affected by three main sources of uncertainty: the operational or data uncertainty, but also the fundamental or model uncertainties, and the uncertainty on the completeness on the model. If well taken into account, uncertainty will impact the design of a supply chain. The number and size of production and transport facilities clearly depends on the mean values of input data, but also of their possible variation. Uncertainty will also affect the evaluation of a supply chain in terms of costs, GHG emissions, etc.
The stochastic multi-objective models encountered in our review are summarized in Table 11.
Table 11: Stochastic multi-objective models
Article Dimensions Multi- Multi- Multi-product period mode Linear models
Pishvaee et al. [2012a] Eco - Env - Soc Ruiz-Femenia et al. [2013] Eco - Env Saffar et al. [2014] Eco - Env Saffar et al. [2015] Eco - Env Pishvaee and Razmi [2012] Eco - Env Pishvaee et al. [2012b] Eco - Env Amin and Zhang [2013] Eco - Env Non-linear models
Guill´en-Gos´albez and Grossmann [2009] Eco - Env Guill´en-Gos´albez and Grossmann [2010] Eco - Env Mohammadi et al. [2014] Eco - Env
In Pishvaee et al. [2012a], a first objective function minimizes a sum of logistics costs and a second objective function aggregates the four social and environmental impacts already presented in section 4. Amin and Zhang [2013] extend their deterministic model by considering uncertain demand and amount of returned products. They use a scenario-based stochastic programming approach.
Ruiz-Femenia et al. [2013] study the effect of demand uncertainty on the economic and environmental performance of supply chains. Their model seeks to maximize the expected profit and minimize the probability for environmental factors to exceeding a given limit.
Guill´en-Gos´albez and Grossmann [2009] provide a MINLP model to maximize the net present value and minimize the environmental impact for chemical supply chains, with uncertainty about the amount of emissions released and the feedstock requirement. In Guill´en-Gos´albez and Grossmann [2010], the value of damage factors is considered an uncertain parameter so a chance-constraint model is applied to handle them.
Mohammadi et al. [2014] propose a novel variant of the hub location model called the sustainable hub location problem (SHLP) in which two new environmental-based cost functions accounting for air and noise pollution of vehicles are incorporated and related to fuel consumption. The cost of emission at the hubs is also considered. To cope with uncertain data incorporated in the model, a mixed
possi-bilistic–stochastic programming approach is proposed to construct the crisp counterpart, resulting in a mixed integer nonlinear programming (MINLP) optimization model according to the nonlinear form of the objective functions.
Fuzzy set theory [Zadeh, 1978] provides an efficient tool to capture the imprecision of data. It is employed when there are not enough historical data to estimate probability distribution functions of uncertain parameters. This approach is chosen in Pishvaee and Razmi [2012], Pishvaee et al. [2012a] and Pishvaee et al. [2012b].
Pinto-Varela et al. [2011] model two case studies in a Portuguese industry with multiple products and periods. Their approach includes a fuzzy-like modeling to indicate the trade-off between the economic and environmental objectives considered. Like in Guill´en-Gos´albez and Grossmann [2009], the stochastic model is converted into a deterministic one to facilitate its solution.
5.3
Conclusions on modeling
In summary, a large variety of modeling techniques have been used in order to address sustainable SCND problems among which most used techniques are MIP for linear or non linear problems. Non linearity often arises from the modeling of non-linear industrial processes.
Some models consider a single objective aggregating the economic and environmental or sometimes social factors. However most of the models explicitly consider two or three different objectives functions (or sometimes more) , which is natural to cope with the different dimensions of sustainable development. Since the social impact can be difficult to quantify, it is sometimes not addressed explicitly into a mathe-matical model, but rather in a preliminary step of scenario definition or in a post-optimization evaluation of the solutions.
6
Solution Methods
The goal of this section is to review the solution methods and the tools employed for solving sustainable SCND models. SCND problems are NP-hard [Pishvaee et al., 2010], since they generalize facility location problems. However, instances of average size are still tractable by mathematical solvers. Thus a large variety of solution methods are used. This section is divided into three subsections. Subsection 6.1 reviews the methods used for solving single-objective models. This includes multi-objective models for which the objective function is a weighted sum of the objectives. Subsection 6.2 is devoted to methods for multi-objective models: ε-constraint, metaheuristics, multi-criteria decision analysis (MCDA), and other methods. Finally, subsection 6.3 describes the use of modeling tools and solvers in all reference papers.
6.1
Solution methods for models with a single objective
Heuristics and metaheuristics are widely applied in the SCND literature, but still rarely employed in sustainable SCND. Elhedhli and Merrick [2012] use Lagrangean relaxation to decompose their three-echelon model into a capacitated facility location problem with single sourcing and a concave knapsack problem that can be solved easily. The Lagrangean relaxation is completed with a Lagrangean heuristic which finds a near-optimal solution for a set of instances with up to 10 suppliers, 20 plants and 150 customers. Tuzkaya et al. [2011] use the weighted sum to integrate the two objective functions of their bi-objective model. Then they resort to a genetic algorithm to solve single objective models.
6.2
Solution methods for multi-objective models
Table 12: Solution methods for multi-objective models
Type of method Articles Weighted sum of
objec-tives
Caruso et al. [1993], Krikke et al. [2003], Bojarski et al. [2009], Galante et al. [2010], Amin and Zhang [2013], Bernardi et al. [2013], Kanzian et al. [2013], Marufuzzaman et al. [2014]
ε-constraint Guill´en-Gos´albez et al. [2008], Guill´en-Gos´albez and Grossmann [2009], Mele et al. [2009], Duque et al. [2010], Guill´en-Gos´albez and Grossmann [2010], Guill´en-Gos´albez et al. [2010], Chaabane et al. [2011], Mele et al. [2011], You and Wang [2011], Akgul et al. [2012], Kostin et al. [2012], P´erez-Fortes et al. [2012], You et al. [2012], Pishvaee and Razmi [2012], Pishvaee et al. [2012a], Pozo et al. [2012], Amin and Zhang [2013], Ruiz-Femenia et al. [2013], Xifeng et al. [2013], Yue et al. [2013], Baud-Lavigne et al. [2014], Marufuzzaman et al. [2014], Mota et al. [2014], Santiba˜nez-Aguilar et al. [2014], Yue et al. [2014]
Goal Programming Al¸cada-Almeida et al. [2009], Galante et al. [2010], Pati et al. [2008], Ramudhin et al. [2010], Chaabane et al. [2011], Harraz and Galal [2011]
Interactive fuzzy approach Malczewski and Ogryc˙zak [1990], Pinto-Varela et al. [2011], Pish-vaee et al. [2012b]
Metaheuristics GA: Dehghanian and Mansour [2009], Tuzkaya et al. [2011], Zhang et al. [2013], MA: Jamshidi et al. [2012], VNS: Eskan-darpour et al. [2013], Devika et al. [2014], PSO: Govindan et al. [2013], SA+ICA: Mohammadi et al. [2014]
NSGA II+TOPSIS: Beheshtifar and Alimoahmmadi [2014] NSGA II+Fuzzy: Saffar et al. [2014] NSGA II+ε-constraint: Saffar et al. [2015]
Others Hugo and Pistikopoulos [2005], Erkut et al. [2008], Minciardi et al. [2008], Quariguasi Frota Neto et al. [2008], Zamboni et al. [2009], Galante et al. [2010], Wang et al. [2011], Datta [2012], Sadrnia et al. [2013]
Weighted sum of objectives
An intuitive approach to handle multi-objective models is to weight each criterion and to minimize the weighted sum of all criteria. The main advantage of this approach is to model and solve multi-objective problems with single-objective approaches. Unfortunately, this modeling may not represent the decision-maker’s interest and may modify the Pareto structure of the problem [Pozo et al., 2012]. It can be used only when the Pareto set is convex. Such an approach is chosen in Bernardi et al. [2013] where the three conflicting objectives are the economic one, the impact on global warming, and the impact on water resources.
Pinto-Varela et al. [2011] use a symmetric fuzzy linear programming (SFLP) for a bi-objective model. The model maximizes a single variable 0 ≤ λ ≤ 1 representing the degree to which each objective must be satisfied.
Epsilon-constraint
The ε-constraint method consists in prioritizing a primary objective while expressing other objectives as constraints. Fixing various values of constraint enables the Pareto front to be approximated. This method is well adapted to the extension of a single-objective economic approach to bi-objective models integrating environmental or social criteria. Indeed, by considering the economic model as the primary objective, this approach enables decision makers to measure the financial impact of environmental or social constraints.
The model in P´erez-Fortes et al. [2012] includes economic, social and environmental criteria. Since the social metric is discrete, only the environmental criterion is represented in the ε-constraint and the authors represent one Pareto front for each possible value of the social metric.
Guill´en-Gos´albez and Grossmann [2009] and Guill´en-Gos´albez and Grossmann [2010] propose bi-criteria MINLPs. In Guill´en-Gos´albez and Grossmann [2009], the environmental criterion is transferred to the ε-constraint. The MINLP model is decomposed into two levels: a master convex MINLP is solved to provide a vector of integer variables. In the second level, a continuous nonlinear problem is solved to obtain a lower bound. The approach in Guill´en-Gos´albez et al. [2010] is similar: an upper level problem and a lower level problem are solved repeatedly. Integer and logic cuts are added until the bounds converge. The model in Guill´en-Gos´albez and Grossmann [2010] is non-convex with a specific structure. The net present value is transferred to the ε-constraint. The resulting single-objective model is solved with a spatial branch-and-bound that exploits the specific structure of the model.
Pozo et al. [2012] solve their multi-objective optimization problem with an ε-constraint approach. They then use Principal Component Analysis (PCA) to reduce the dimensionality of the model with the objective of preserving its Pareto structure. Finally, the ε-constraint approach is used again on the reduced model. In Kostin et al. [2012], the ε-constraint is followed by the rigorous MILP dimensionality reduction approach based on the δ-error definition [Guill´en-Gos´albez, 2011].
In their multi-objective uncapacitated facility location problem, Xifeng et al. [2013] consider the minimization of CO2 emissions as the main objective. The economic and the service objectives are reformulated as constraints. The single-objective problem is solved with a greedy-drop heuristic. Metaheuristics for multi-objective models
Dehghanian and Mansour [2009], Tuzkaya et al. [2011], and Zhang et al. [2013] propose Genetic Algorithms (GA) to solve their models. Tuzkaya et al. [2011] propose a two-stage methodology for the strategic design of a reverse logistics network. The weights of each criterion are calculated with an Analytic Network Process (ANP) procedure, and then the candidate locations are evaluated with a fuzzy TOPSIS (Technique for Order of Preference by Similarity to Ideal Solution). In a second stage, the facility location problem is solved by means of a genetic algorithm. In Zhang et al. [2013], the upper level searches for


![Figure 4: Conceptual framework of LCA [ISO, 2006]](https://thumb-eu.123doks.com/thumbv2/123doknet/11579067.297989/9.892.307.587.145.354/figure-conceptual-framework-of-lca-iso.webp)