HAL Id: hal-00151555
https://hal.archives-ouvertes.fr/hal-00151555
Submitted on 14 Nov 2013
HAL is a multi-disciplinary open access
archive for the deposit and dissemination of
sci-entific research documents, whether they are
pub-lished or not. The documents may come from
teaching and research institutions in France or
abroad, or from public or private research centers.
L’archive ouverte pluridisciplinaire HAL, est
destinée au dépôt et à la diffusion de documents
scientifiques de niveau recherche, publiés ou non,
émanant des établissements d’enseignement et de
recherche français ou étrangers, des laboratoires
publics ou privés.
Fracture mechanics of PVDF polymeric material :
specimen geometry effects
Lucien Laiarinandrasana, Gilles Hochstetter, Mélanie Lafarge
To cite this version:
Lucien Laiarinandrasana, Gilles Hochstetter, Mélanie Lafarge. Fracture mechanics of PVDF polymeric
material : specimen geometry effects. Fracture of nano and engineering materials and structures, ECF
16, Jul 2006, Alexandroupolis, Greece. 8 p. �hal-00151555�
Fracture mechanics of PVDF polymeric material : specimen geometry effects
L. Laiarinandrasana
(1), G. Hochstetter
(2), M. Lafarge
(3)(1) Centre des Matériaux (UMR CNRS 7633) Ecole Nationale Supérieure des Mines de Paris BP
87, F-91003 Evry Cedex - FRANCE
e-mail :
lucien.laiarinandrasana@ensmp.fr
(2) ARKEMA - Centre d'Etude de Recherches et de Développement (CERDATO) F-27470
Serquigny - FRANCE
e-mail :
gilles.hochstetter@arkemagroup.com
(3) ARKEMA – CRRA – Rue Henri Moissan BP 63, F-69493 Pierre Bénite Cedex - FRANCE
e-mail :
melanie.lafarge@arkemagroup.com
ABSTRACT
Polyvinylidene fluoride (PVDF) is a semi-crystalline polymer that has been widely studied for structural applications, because it exhibits good mechanical properties and chemical resistance. During viscoplastic deformation, the material whitens after the onset of necking due to nucleation and growth of voids. Mechanical tests on cracked specimens show the crack instability on DENT specimens whereas stable crack growth on SENB specimens is also encountered. In the global approach of non linear fracture mechanics framework, the two-parameter approach indicates that according to the opening stress state in the remaining ligament, the crack growth can be more or less stable. Namely, tensile crack specimens such as DENT favour instabilities whereas bending specimens (like SENB) are proved to present stable cracking. This work deals with computing Q-stresses on DENT and SENB specimens with the help of FE modelling. The material toughness JIC is then determined by means of experimental data gathered with both specimens. JIC depends on the specimen geometry. A JIC-Q curve is then plotted for the PVDF material at 20°C.
1. INTRODUCTION
Polyvinylidene fluoride (PVDF) is a semi-crystalline polymer that has been widely studied for its piezoelectric properties [1], due to its polar β phase. Nevertheless, the apolar phase, α, is also studied for structural applications, because it exhibits good mechanical properties and chemical resistance [2]. During viscoplastic deformation, the material whitens after the onset of necking due to nucleation and growth of voids, as evidenced using small and large angle X-Ray diffraction [2]. In this study, an α-PVDF grade used for offshore applications is analysed at 20°C with respect to viscoplastic and damage behaviour. Double Edge Notch Tensile (DENT) as well as Single Edge Notch Bending (SENB) specimens were used in order to investigate sensitivity of toughness to the specimen geometry. A numerical simulation of these tests is performed using the Gurson Tvergaard Needleman (GTN) model [3-5] which was adapted to the present material. This model allows to ensure that the local stresses are correctly determined. In addition, J integral values can be calculated. By using the small scale yielding (SSY) concept , the second parameter Q can be obtained. The motivation is to investigate whether there exist a single JIC-Q curve as is the case for metallic materials.
2. EXPERIMENTS
2.1. Material and specimens
The material of interest was provided by ARKEMA and is generally used in multilayered offshore risers. In this work the PVDF under study differs from the standard industrial grade since it was extruded without plasticizer. Therefore, a significant porosity has been noted: the initial defect population was estimated by microscopic examination followed by image analysis, of a PVDF sample broken in liquid nitrogen. The porosity is equal to 10% consisting of 1 µm diameter
voids which are always observed in bulk PVDF and that are created during crystallisation and extrusion [1] ; a second, much smaller (0.1 µm) population is also observed in the investigated material.
Double edge notched specimens were tested in tension (DENT). They were machined from 12 mm thick extruded PVDF sheets (ASTM D638 M1). The length is 110 mm, the width (W) is 6 mm and the thickness is 12 mm. Various crack length (a) and width ratios (a/W) are used ranging from 0.25 to 0.5. The cracks are made with a cutter blade. Special attention is paid to guarantee alignment of both cracks. Initial crack lengths are measured from the fracture surfaces using an optical microscope. DENT tests are carried out at constant crosshead speed (0.15 mms-1), and a gage extensometer (gauge length: 6.2 mm) is used to monitor the crack opening displacement (COD).
Single edge notched specimens (SENB) were tested in three point bending at a constant displacement rate (0.15 mm/s) using an Inströn machine. Specimens were tested using a span-to-specimen width ratio, S/W, of 4:1. Width (W) and thickness (B) are respectively 14 mm and 7 mm, and the a/W ratio was 0.5. Displacement and load are monitored together with the crack opening displacement measured using a MTS extensometer.
2.2. Tests on cracked specimens
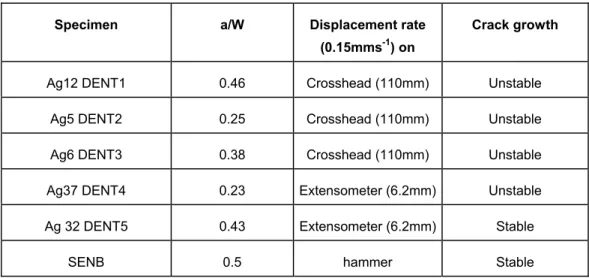
6 tests were selected in this work in order to investigate the crack inititiation characteristics regardless of the stableness of the crack growth see table 1. For DENT specimens the imposed displacement rate was applied by controlling either the machine crosshead (110mm), or the extensometer (6.2mm).
Table I . Selected tests for this study
Specimen a/W Displacement rate
(0.15mms-1) on
Crack growth
Ag12 DENT1 0.46 Crosshead (110mm) Unstable
Ag5 DENT2 0.25 Crosshead (110mm) Unstable
Ag6 DENT3 0.38 Crosshead (110mm) Unstable
Ag37 DENT4 0.23 Extensometer (6.2mm) Unstable
Ag 32 DENT5 0.43 Extensometer (6.2mm) Stable
SENB 0.5 hammer Stable
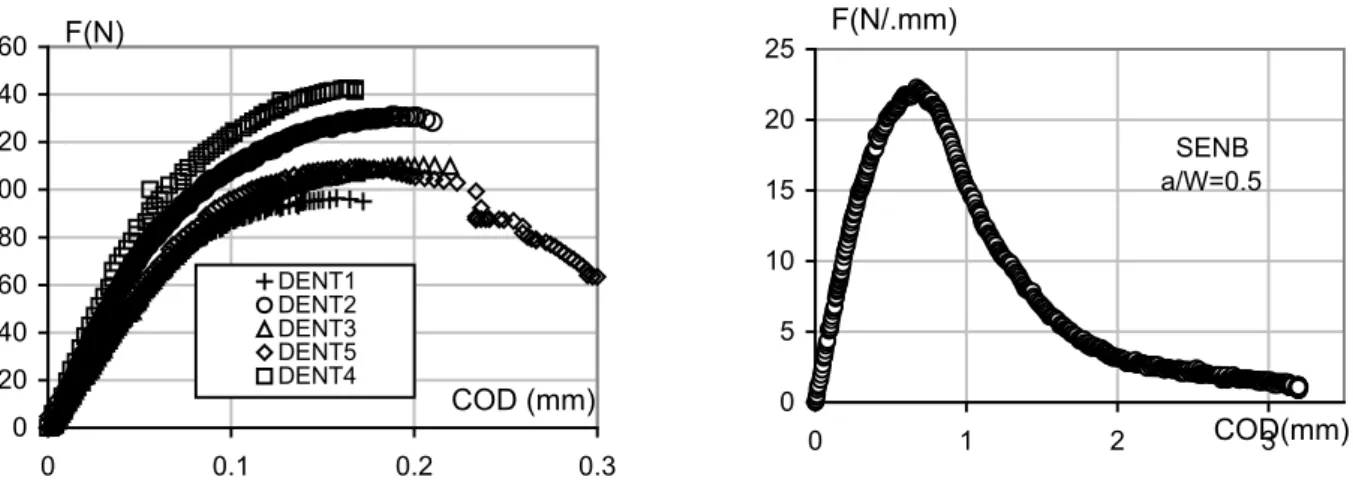
The produced experimental curves are illustrated in figure 1 where the load is plotted against the Crack Opening Displacement (COD). Stable crack growth was observed on DENT5 and SENB as indicated in table 1 and figure 1 by the load decrease at the final stage of the tests.
Figure 2 shows some pictures taken during the tests. Prior to crack initiation, the material in the vicinity of the crack tip whitens. In this zone, it has been observed that there is a significant void growth inducing inter-void fibrils stretching. It is assumed to be the crazed area. The crack starts growing at the back of the craze. This event appears at the maximum load for stable crack whereas for unstable crack growth it corresponds to the final experimental point of the test. In the following, the crack initiation will refer to these characteristic points.
In fact, in the process zone, two phases of material are in presence : the craze and the "sound" material. Since the crack tip is first located at the back of the craze, the stability of the crack growth can be defined by the ability of this crack tip, according to its speed, to reach the craze tip. The fracture surfaces of unstable crack clearly indicate two patterns.
0 5 10 15 20 25 0 1 2 COD(mm)3 F(N/.mm) SENB a/W=0.5 0 20 40 60 80 100 120 140 160 0 0.1 0.2 0.3 DENT1 DENT2 DENT3 DENT5 DENT4 COD (mm) F(N)
Figure 1 : Load versus COD curves of DENT and SENB tests
The first one is related to when the crack tip goes through the crazed material in a ductile manner, with deformed fibrils. The second one is concerned with brittle aspects when the crack tip has reached the crazed zone and evolves in the "sound" material. For stable crack growth, the crack tip is always embedded in the crazed zone during the test.
Figure 3 : Whitening due to void growth in the vicinity of the crack tip
3. Global approach 3.1. First attempt
The global approach of the Fracture Mechanics concept is based on load parameters such as : - the stress intensity factor (K) or the Energy release rate (G) for linear elasticity; - and J-integral for the non linear material behaviour.
The figure 1 clearly indicates the non linear relationship between the load and the crack opening displacement (COD). K and G will then be ignored in the following.
The J-integral concepts require that the stress-strain curve be modelled by a power law function (Ramberg-Osgood). The so-called plastic material coefficients have to be identified. For the PVDF under study the stress-strain curve exhibits a kind of plateau. This is presumably due to viscous effects (strain rate dependence) and void growth during the craze formation. Consequently, the Ramberg-Osgood coefficients cannot be determined either with the stress-strain curve, or with the load-COD plot by using an inverse optimisation method.
Since the goal is to determine the limitation of the global approach of the Non Linear Fracture Mechanics (NLFM) concepts, we will use the Finite Element (FE) analysis to capture the maximum information concerning the selected tests
As mentioned previously, the process zone is concerned with two material phases : the craze and the "sound" one. The use of the mechanics of porous media has been attempted in [1] where notched and cracked specimens were utilised in order to investigate void development over a wide range of loading conditions. A numerical simulation of these tests is performed using a modified Gurson-Tveergard-Needleman (GTN) model [3-5], which was adapted to the present material. The yield surface is expressed as:
( )
1 q f 0 2 q cosh . f . q 2 f , , * . def 2 2 1 * kk 2 1 2 * 2 eq * − − =σ σ σ + σ σ = σ σ Φ(1)
eq σ 2 qis the Von Mises stress, and σ the trace of the stress tensor. is the porosity, q and are model parameters. was expressed as a function of the maximum principal plastic strain p . Details of the present model are reported in reference [1].
kk f 1 q2
1
The GTN model allows to run FE analyses on the DENT end SENB specimens. For DENT specimen, 2D quadratic iso-parametric elements under plane strain (PE) conditions were used to model ¼ of the specimen. Each specimen was meshed according to its a/W ratio and the gauge length (110mm or 6.2mm). For the SENB test, half of the specimen was meshed corresponding to a/W=0.5, but the striker as well as the support were also modelled and the contact between the PVDF and these metallic components was accounted for with a friction coefficient of 0.2.
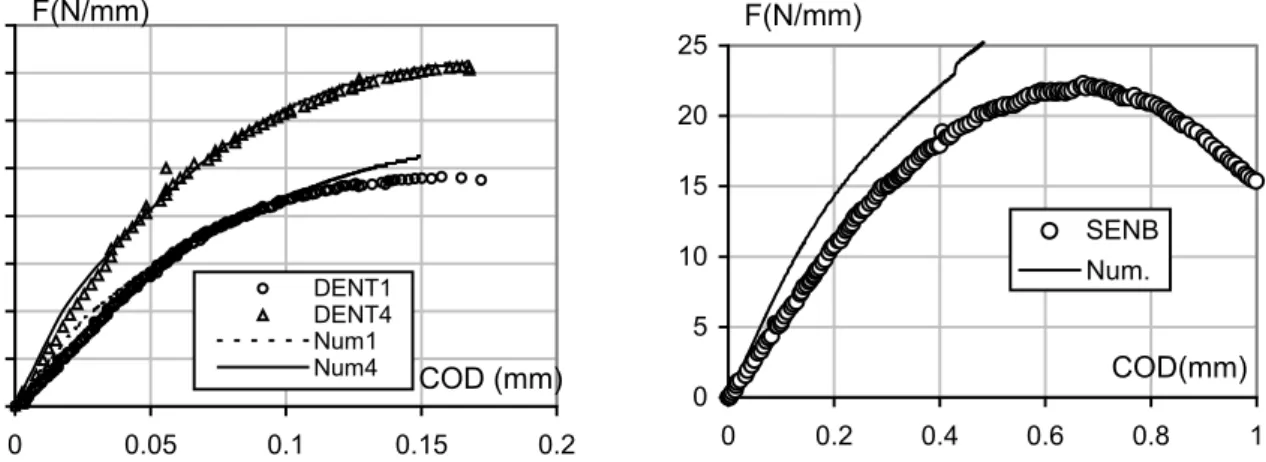
Figure 4 shows good agreement between simulated and experimental load versus COD curves, at least for DENT specimens. For SENB, the used PE condition is not so satisfactory. 3D simulations were performed in [1], but for the present work we just restrict investigations to 2D consideration. FE computations were carried out only until the crack initiation defined previously.
0 20 40 60 80 100 120 140 160 0 0.05 0.1 0.15 0.2 DENT1 DENT4 Num1 Num4 COD (mm) F(N/mm) 0 5 10 15 20 25 0 0.2 0.4 0.6 0.8 1 SENB Num. COD(mm) F(N/mm)
Figure 4 : Comparison between numerical and experimental load versus COD curves for DENT and SENB
The idea is here to take benefit of this relevant modelling in order to extract the global approach of the NLFM parameter. For instance the Z-set FE code [6] is provided with integral computation by using the De Lorenzi [7] approach. The J-integral is then calculated throughout the loading step and especially its value at the crack initiation is supposed to be the toughness JIC. J-integral value has been demonstrated to be path independent. Due to symmetry the numerical values of
J are multiplied by 4 for DENT specimens and by 2 for SENB specimens.
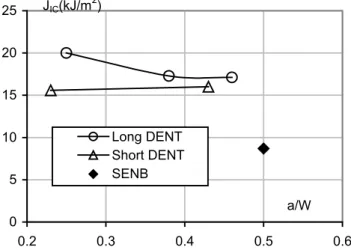
The JIC values are plotted in figure 5 according to the a/W ratios and the kind of loading. In this figure, "Long" and "Short"
refer to the distance of application of the displacement for DENT specimens as previously discussed. JIC vs a/W
ratios for the same specimen type and the specimen geometry (DENT vs SENB) on toughness JIC. It turns out that the
same trend as in metallic material is observed concerning both effects:
- for long DENT, JIC decreases when a/W increases, the stabilised JIC being obtained for long cracks (a/W >
0.4). This effect is not reflected by short DENT data;
- for approximately the same a/W = 0.5, JIC(SENB) is much lower than JIC(DENT). This effect has motivated
the two parameter approach [9] based on the loss of constraint and that will be developed further.
0 5 10 15 20 25 0.2 0.3 0.4 0.5 0.6 Long DENT Short DENT SENB a/W JIC(kJ/m 2 )
Figure 5. JIC values according to the a/W ratio
It should be mentioned that surprisingly, the values of toughness obtained for stable crack growth specimens are lower than those for unstable ones. So, unstable crack does not imply brittle fracture. In both cases, crack initiation occurs in a ductile manner in the crazed zone. Then for DENT specimens, there is a crack acceleration that provokes the brittle failure at the end of the test. This is not observed in metallic materials.
3.3. Q-parameter
In the global approach of NLFM, the two-parameter concept [9] has been used in order to account for specimen geometry effects. Typically, cracked specimen geometries are classified as flexural or tensile specimen according to the opening stress state in the ligament.
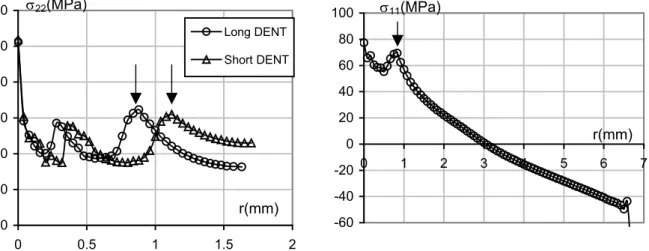
In figure 6, the opening stresses calculated by FE method are plotted as a function of the distance from the crack tip for both specimen geometries (DENT and SENB). These curves were obtained at the step corresponding to the crack initiation. For DENT specimen, the opening stress (σ22) is positive in the whole ligament, whereas for SENB
approximately one half of the ligament is subjected to compressive (negative) stress. Consequently the SENB is considered to be a flexural specimen. This kind of geometry (like Compact Tension (CT) specimen) is often used to characterise fracture criterion since it provides a low (hence conservative) value of toughness.
The trend of the stress singularity can be analysed as follows. The arrows indicate the extent of the crazed zone corresponding numerically to the material where the porosity is greater than the initial value of 10%. The maximum stress of about 70MPa is representative of the craze tip for both geometries. For the crack tip (at the back of the craze) the maximum opening stress is about 90MPa for DENT specimen and 80 MPa for SENB specimen. The intermediate maximum stress between the aforementioned maxima corresponds to the region, in the crazed zone, where the stress triaxiality ratio is maximum. This information is necessary to the definition of the second parameter.
40 50 60 70 80 90 100 0 0.5 1 1.5 Long DENT Short DENT r(mm) σ22(MPa) 2 -60 -40 -20 0 20 40 60 80 100 0 1 2 3 4 5 6 7 r(mm) σ11(MPa)
Figure 6. Opening stress singularities for DENT and SENB specimens (r distance to crack tip, σ11 (resp σ22) opening
stress for SENB (resp. DENT))
Following O'Dowd and Shih [10-11] the second parameter (called Q-parameter) is defined as :
0 ref FE Q σ−σ σ = (2) where
σ0 is the yield stress, in this work its value is 50MPa;
σFE is the opening stress calculated by FE method;
σref is a reference stress generally obtained by using the Hutchinson-Rice-Rosengren (HRR) stress field [12-13].
Figure 7 : Meshing used for SSY stress calculation
Since Ramberg-Osgood coefficients are not available, the HRR stress field cannot be calculated. We then suggest to take the small scale yielding (SSY) opening stress as reference stress. The SSY stress is obtained by FE method on a semi-circular mesh (figure 7) surrounding the crack tip (boundary layer) and by applying a displacement field corresponding to linear fracture mechanics concept (K-field). For each specimen, the K value used in K-field is given by the formula : ) 1 ( EJ K 2 Ic ν − = (3)
Figure 8 shows some examples of J-integral histories where the loading rate is taken to be as similar as possible for the real specimen and the K-field. This is required since the material exhibit viscous effects.
0 0.5 1 1.5 2 2.5 3 3.5 4 4.5 0 5 10 15 20 J_DENT1 J_SSY t(s) J/4(kJ/m2) 0 1 2 3 4 5 0 2 4 6 8 J_SENB J_SSY t(s) J/2 (kJ/m2) 10
Figure 8 : Comparison of J integral histories for both specimen geometries
Figure 9. Comparison between σFE and σSSY for DENT and SENB specimens
20 30 40 50 60 70 80 90 100 0 0.5 1 1.5 FE SSY r(mm) σ22(MPa) DENT 2 20 30 40 50 60 70 80 90 100 0 0.5 1 1.5 FE SSY r(mm) σ11(MPa) SENB 2 0 5 10 15 20 25 -0.3 -0.2 -0.1 0 0.1 0.2 Long DENT Short DENT SENB Q JIC(kJ/m 2 ) a) 0 50 100 150 200 250 -1.5 -1 -0.5 0 0.5 SENB CCP CCP FIT Q JIC(kJ/m 2 ) b)
Figure 10. JIc – Q curves a) for PVDF material at 20°C, b) for metallic material according to [8]
The determination of Q values consists in plotting together both σFE and σSSY, then equation (2) is applied. Figure 9
illustrates the comparison between σFE and σSSY. It is observed that σFE > σSSY for DENT specimen. Therefore Q
parameter in this case is positive. Conversely, for SENB specimen, σFE < σSSY. By taking the (σFE - σSSY) quantity at
about 1mm from the crack tip (at the tip of craze), we can determine the Q values. For all of our DENT specimens Q≈0.1 whereas for SENB Q≈-0.2. These values allow to plot the JIC-Q curve in figure 10a) for PVDF material. This trend is
opposed to what is known for metallic materials (figure 10b). In [7] and [8], flexural specimens exhibit positive Q whereas negative value of Q are often encountered in tensile specimens. It is to be mentioned that present Q values are determined at the tip of the craze whereas for metallic materials, since there is no crazed zone, Q is related to the crack tip. In addition, the global approach of NLFM is based on a homogeneous material. In the PVDF polymeric material under study, the crazed zone represents a second phase which can embed the fracture processes.
4. CONCLUSION
Polyvinylidene fluoride (PVDF) is a semi-crystalline technical polymer due to its good mechanical properties and chemical resistance. Subjected to deformation, the material whitens due to nucleation and growth of voids. Double Edge Notch Tensile (DENT) as well as Single Edge Notch Bending (SENB) specimens were used in order to investigate the geometry effects on the toughness. Tensile cracked specimen such as DENT favours instabilities whereas bending specimens (like SENB) are proved to present stable cracking.
J-integral formulae cannot be applied for this material since no power law coefficients can be indentified. In fact, the damage and fibrils streching in the material induce a plateau in the stress-strain curve. By using a modified Gurson Tvergaard Needleman (GTN) model, the crazed zone can be modelled and the J-integral can be computed at the crack tip by using this GTN model. The material toughness JIC is then determined by means of experimental data gathered with both specimens. Surprisingly, the values of toughness obtained for stable crack growth specimens are lower than those for unstable ones. Q-stresses values on DENT and SENB specimens were calculated with the help of FE results. The trend of JIC-Q curve for the PVDF material at 20°C differs from what is observed for metallic material.
REFERENCES
[1] Challier, M., Besson, J., Laiarinandrasana, L. and Piques, R. "Damage and Fracture of Polyvynilidene Fluoride (PVDF) at 20°C : experiments and modelling" Engineering. Fracture Mechanics, 73:79-90. 2006.
[2]Castagnet S, Girault S, Gacougnolle JL, Dang P. "Cavitation in strained PVDF : mechanical and X-ray experimental studies. Polymer.41(20):7523-7530; 2000.
[3] Gurson AL. "Continuum theory of ductile rupture by void nucleation and growth": Part 1-yield criteria and flow rules for porous ductile media. J Eng Mat Tech. 99:2-15; 1977.
[4] Tvergaard V. "Influence of voids nucleation on ductile shear fracture at a free surface" J Mech Phys Solids. 30:399-425; 1982.
[5] Tvergaard V, Needleman A. "Analysis of the cup-cone fracture in a round tensile bar" Acta Metal. 32:157-169; 1984. [6] Besson, J., and Foerch, R.,"Large scale object-oriented finite element code design". Computer Methods in Applied Mechanics and Engineering 142, 165-187; 1997.
[7] De Lorenzi, H.G. "Energy release rate calculations by finite element method" Engineering. Fracture Mechanics, 21(1):129-143 ; 1985.
[8] Sumpter, J.D.G., Forbes, A.T. " Constraint based analysis of shallow cracks in mild steel" Proceedings of TWI/AWI/IS International Conference on Shallow Crack Fracture Mechanics, Toughness tests and applications, paper 7, September 1992.
[9] O'Dowd N.P. and Shih, C.F. "Two-parameter fracture mechanics : theory and applications" Fracture Mechanics : Twenty fourth volume, ASTM STP 1207, ed. J.D Landes, D.E. Mc Cabe, J.A.M. Boulet, pp. 21-47, 1994.
[10] O'Dowd N.P. and Shih, C.F. "Family of crack-tip fields characterized by a triaxiality parameter I. Structure of fields" Journal of the Mechanics and Physics of Solids, Vol. 39, n° 8 pp. 989-1015, 1991.
[11] O'Dowd N.P. and Shih, C.F. "Family of crack-tip fields characterized by a triaxiality parameter II. Fracture applications" Journal of the Mechanics and Physics of Solids, Vol. 40, n° 5 pp. 939-963, 1992.
[12] Hutchinson, J.W., "Singular behaviour at the end of a tensile crack tip in a hardening material" Journal of the Mechanics and Physics of Solids, Vol. 16, pp. 13-31, 1968.
[13] Rice, J.R., Rosengren, G.F., "Plane strain deformation near a crack tip in a power law hardening material" Journal of the Mechanics and Physics of Solids, Vol. 16, pp. 1-12, 1968.
[14] O'Dowd N.P., Shih, C.F., Dodds, R.H. " The role of geometry and crack growth on constraint and implications for ductile/brittle fracture" Constraint effects in Fracture : Theory and Applications, Vol. 2, ASTM STP 1244, ed. M. Kirk, Ad Bakker, Philadelphia, pp. 134-159; 1995.
![Figure 10. J Ic – Q curves a) for PVDF material at 20°C, b) for metallic material according to [8]](https://thumb-eu.123doks.com/thumbv2/123doknet/11628672.305556/8.892.93.801.772.998/figure-ic-curves-pvdf-material-metallic-material-according.webp)
