HAL Id: hal-01404494
https://hal.sorbonne-universite.fr/hal-01404494
Submitted on 28 Nov 2016HAL is a multi-disciplinary open access
archive for the deposit and dissemination of sci-entific research documents, whether they are pub-lished or not. The documents may come from teaching and research institutions in France or abroad, or from public or private research centers.
L’archive ouverte pluridisciplinaire HAL, est destinée au dépôt et à la diffusion de documents scientifiques de niveau recherche, publiés ou non, émanant des établissements d’enseignement et de recherche français ou étrangers, des laboratoires publics ou privés.
Synthesis, Structure, and Electrochemical Properties of
Na3MB5O10 (M = Fe, Co) Containing M2+in
Tetrahedral Coordination
Florian Strauss, Gwenaëlle Rousse, Moulay Tahar Sougrati, Daniel Alves
Dalla Corte, Matthieu Courty, Robert Dominko, Jean-marie Tarascon
To cite this version:
Florian Strauss, Gwenaëlle Rousse, Moulay Tahar Sougrati, Daniel Alves Dalla Corte, Matthieu Courty, et al.. Synthesis, Structure, and Electrochemical Properties of Na3MB5O10 (M = Fe, Co) Containing M2+in Tetrahedral Coordination. Inorganic Chemistry, American Chemical Society, 2016, �10.1021/acs.inorgchem.6b02070�. �hal-01404494�
Synthesis, Structure and Electrochemical Properties of Na
3MB
5O
10(M = Fe, Co) containing M
2+in tetrahedral coordination
Florian Straussa, b,c,f, Gwenaëlle Rousseb,c,f,g, Moulay-Tahar Sougrati d,f,g, Daniel Alves Dalla Corte c,g, Matthieu Courty e,g, Robert Dominkoa,f, Jean-Marie Tarascon b,c,f,g,*
a
National Institute of Chemistry, Hajdrihova 19, SI-1000 Ljubljana, Slovenia b
UPMC Univ Paris 06, Sorbonne Universités, 4 Place Jussieu, F-75005 Paris, France
c
UMR 8260 “Chimie du Solide et Energie”, Collège de France, 11 Place Marcelin Berthelot, 75231 Paris Cedex 05, France
d
Institut Charles Gerhardt - UMR 5253, 34095 Montpellier Cedex 5, France
e
Laboratoire de Réactivité et Chimie des Solides, Université de Picardie Jules Verne, 33 Rue Saint Leu, 80039 Amiens, France
f
ALISTORE – European Research Institute, 33 rue Saint-Leu, Amiens 80039 Cedex, France
g
Réseau sur le Stockage Electrochimique de l’Energie (RS2E), FR CNRS 3459, 33 Rue Saint Leu, 80039 Amiens Cedex, France
Abstract
In the search for new cathode materials for sodium ion batteries, the exploration of polyanionic compounds has led to attractive candidates in terms of high redox potential and cycling stability. Herein we report the synthesis of two new sodium transition metal pentaborates Na3MB5O10 (M = Fe, Co), where Na3FeB5O10 represents the first sodium iron
borate reported at present. By means of synchrotron X-ray diffraction, we reveal a layered structure consisting of pentaborate B5O10 groups connected through M2+ in tetrahedral
coordination, providing possible three-dimensional Na-ion migration pathways. Inspired by these structural features we examined the electrochemical performances versus sodium and show that Na3FeB5O10 is active at an average potential of 2.5 V vs. Na+/Na0,correlated to the
Fe3+/Fe2+ redox couple as deduced from ex situ Mössbauer measurements. This contrasts with Na3CoB5O10 which is electrochemical inactive. Moreover, we show that their
electrochemical performances are kinetically limited as deduced by complementary AC/DC conductivity measurements, hence confirming once again the complexity in designing highly performant borate-based electrodes.
Introduction
Nowadays Li-ion batteries have become an essential device of our daily life, powering portable electronics such as laptops and mobile phones as well as electric- or hybrid vehicles. Despite a tremendous research effort over the last 25 years, they are still limited for large scale applications due to the high cost of stored energy per volume/ weight.1,2 Moving from Li- to Na-ion batteries could noticeably reduce the costs, considering the unlimited availability of sodium in earth’s crust contrary to lithium. Similar to the Li-ion technology, the energy density of Na-ion cells is in principal limited by the performance of the positive electrode.3 Therefore strong research efforts have been focused on several positive electrode materials in the past, mainly based on layered sodium transition metal (TM) oxides NaxMO24,5 or polyanionic type compounds such as Na3V2(PO4)2F3 (NVPF) 6 or
Na2Fe2(SO4)3.7 The latter class of materials shows promising properties such as elevated
redox potentials around 3-4 V vs. Na+/Na0 which are however negated by moderate gravimetric capacities due to the dead weight of the polyanionic group.7,8 Using borate BO3
3-instead of phosphate PO43- or sulfate SO42- offers higher theoretical gravimetric capacities. It
is well know that boron can adopt different oxygen coordination (BO33- and BO45-) capable of
forming a large variety of polyborate anionic networks.9 Materials built upon such polyborate networks can offer open structures, with possible cationic migration pathways,10–
12
making them prospective candidates as insertion/deinsertion cathode materials for rechargeable Na-ion batteries.
This encouraged us to explore polyborate based compounds as cathode materials for Na-ion batteries. Besides that, to the best of our knowledge, transition metal borates have not been explored yet as cathode materials for Na-ion batteries. Looking for appropriate model compounds, recent publications about the synthesis and structure of compounds out of the family of sodium pentaborates Na3MB5O10 (M = Mg, Ca, Zn)13,14 caught our interest,
since it should be theoretical possible to reversible desodiate these materials if M is an redox active TM. Based on this information we embarked in the synthesis of Na3MB5O10 bearing 3d
metals (M = Fe, Co). Herein we discuss our strategy to successfully prepare these new phases and describe their crystal structure as deduced by synchrotron X-ray diffraction. We also report their electrochemical and transport properties as deduced by means of galvanostatic- and AC/DC conductivity measurements. In spite of their rich crystal chemistry, these new phases are shown to present poor electrochemical performances due to kinetic limitations.
Experimental section
a) Synthesis
Stoichiometric amounts of NaOH (Sigma Aldrich, ≥ 97.0%), Fe(C2O4)∙2H2O (Sigma
Aldrich, 99.99%) or Co(OH)2 (Alfa Aesar, 99.9%) and H3BO3 (Alfa Aesar, 99+%) were mixed
together for 15 min in argon using a high energy milling apparatus (SPEX). The resulting solid was reground with a mortar and pestle, filled into an alumina boat and heated up to 700°C for 1 h under argon flow. Na3FeB5O10 was immediately transferred to the glove box for
further use, since it undergoes degradation in ambient atmosphere. At the opposite, Na3CoB5O10 is stable in air.
To prevent the precursors reacting with ambient atmosphere, all steps of the synthesis were carried out under inert atmosphere in an argon filled glove box or under argon flow in a tube furnace. All chemicals were stored under argon, sodium hydroxide NaOH and boric acid H3BO3 were dried prior to use at 200°C for 4 h in vacuum, and at 55°C
for 24 h in air, respectively.
b) Physical characterization
Synchrotron XRD patterns were recorded in transmission mode (=0.413965 Å) at the 11-BM beam line at Argonne National Lab. The powder was placed into the provided sample holders, however in the case of Na3FeB5O10 it was filled in Ø=0.7 mm quartz capillaries before which were sealed under inert atmosphere and then introduced into the sample holder. All powder patterns were refined using the Rietveld method15 as implemented in the FullProf program.16
57
Fe Mössbauer spectra were collected using 20-30 mg/cm² of positive electrode powder. The spectrometer is operated in the constant acceleration mode and in transmission geometry. A 57Co(Rh) source with a nominal activity of 370 MBq was used. The source and the absorber were always kept at 295 K. All the isomer shifts are given relative to
-Fe standard at 295 K.
Thermogravimetric analysis coupled with differential scanning calorimetry (TGA-DSC) measurements were recorded with a STA 449C Netzsch apparatus between room
temperature and 900°C under air by applying a heating rate of 5°C/min under air using around 15-20 mg of the pristine material.
c) Electrochemical characterization
Electrochemical tests were carried out in Swagelok-type cells. The positive electrode material was prepared by mixing the active material with 20 wt.% carbon SP for 10 min using a mortar and pestle under argon. Sodium was used as the negative electrode separated by two sheets of glassy fibber (Whattman GF/D borosilicate) soaked with the electrolyte from the positive side (~10 mg powder). As electrolyte a 1M solution of NaClO4 in a mixture of
ethylene carbonate (EC) and dimethyl carbonate (DMC) 1/1 (w/w) with 1wt.% fluoroethylene carbonate (FEC) additive was used. The cells were assembled in an argon filled glove box (MBraun, Germany, O2 and H2O < 0.1 ppm). Galvanostatic tests were
performed at 55°C at a C/40 (C-rate here is defined as the time needed to remove or insert 1 Na+ from Na3MB5O10 in 1 h) using a VMP3 potentiostat/galvanostat (BioLogic S.A.,Claix,
France).
Conductivity measurements were carried out using a BioLogic MTZ-35 setup with ionically blocking platinum electrodes equipped with a HTF-1100 furnace. AC impedance measurements were recorded from 30 MHz to 0.01 Hz in the temperature range from 250 to 400 °C under argon flow, applying 200 mV voltage amplitude. The activation energy Ea was
calculated from fitting the experimental values using the Arrhenius equation T = 0
·exp(-Ea/kBT), where is the conductivity, T the temperature, 0 is a pre-exponential factor and kB
the Boltzmann constant. DC measurements were done by applying a constant voltage of 0.5 V until the current response reached a constant value. The resistance was then calculated from the steady state current response using Ohm’s law. A pellet suitable for the measurement was prepared by pressing around 300 mg of powdered sample in a 10 mm die. The pellet was following annealed for 124 hours at 650°C under argon, or for 124 hours at 600°C in a vacuum sealed tube for M = Co and M = Fe, respectively. Note that the conductivity values are not corrected by the pellets porosities (around 65-75% of theoretical density).
Results and Discussion
a) Synthesis
A standard solid state synthesis, which consists in mixing stoichiometric amounts of Na2CO3, M(II) carbonate/nitrate and H3BO3 followed by annealing the mixture at
temperatures between 650-700°C in air for several days/weeks, had already been reported to prepare Na3MB5O10 (M = Mg, Ca, Zn).13,14 Our first attempts by replacing the
M(II)-carbonate/nitrate through Co/Fe(II)-oxalate and heating the mixture under argon to avoid oxidation of the transition metal were not successful. In contrast by using NaOH instead of Na2CO3 assodium source, we succeeded in forming the Na3FeB5O10 phase, but not the cobalt
one. The cobalt phase could only be obtained if cobalt(II) hydroxide Co(OH)2 was used as
Co-precursor, hence preventing the easy reduction to metallic Co pertaining to the use of Co(II)-oxalate.
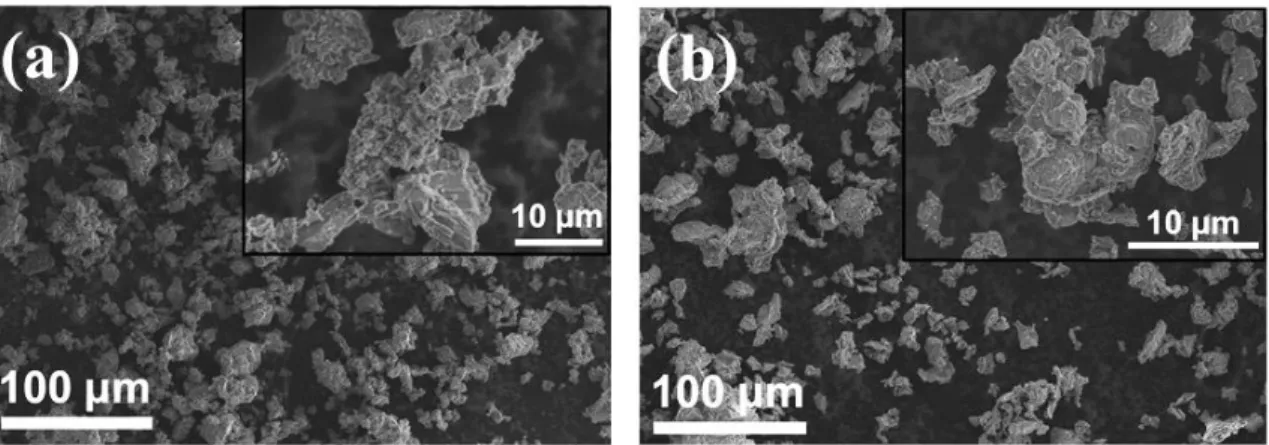
After the synthesis, both powders are made of large particles with sizes ranging from 1 to 50 μm as shown in Figure 1. Note that a longer annealing time did not improve the crystallinity of the products.
Figure 1: Representative SEM images of (a) Na3FeB5O10 and (b) Na3CoB5O10 as prepared.
b) Structural characterization
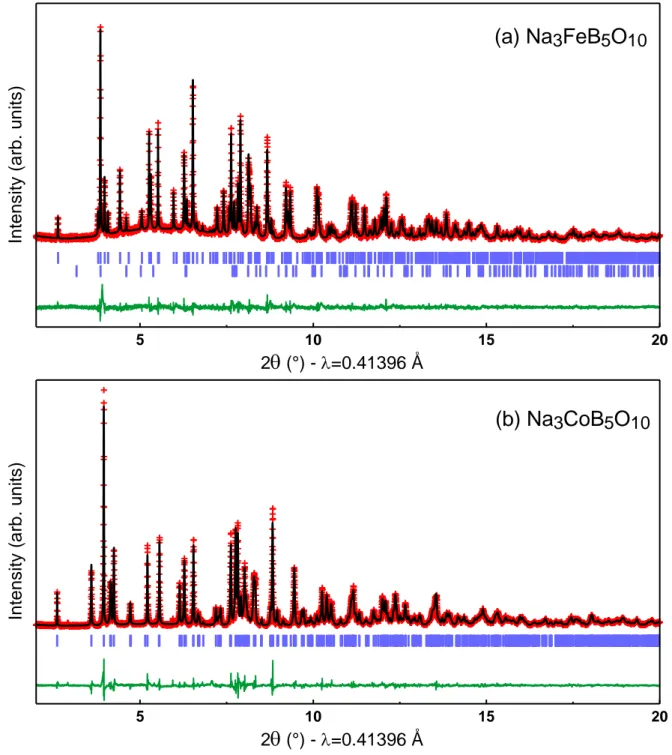
The structure of Na3FeB5O10 was examined by means of synchrotron X-ray powder
be perfectly indexed in an orthorhombic unit cell having a Pbca space group with lattice parameters a = 7.95493(1) Å, b = 12.30669(1) Å and c = 18.03978(1) Å and a unit cell volume V = 1766.073 Å3 (Table 1). We therefore refined the pattern with the Rietveld method starting from the isostructural model reported for Na3MgB5O10,13 but replacing Mg with Fe.
All atoms are placed in general positions 8c with one crystallographic site for iron, three for sodium, five for boron and ten for oxygen atoms. The Rietveld refinement is shown in Figure 2a and fully validates this approach. The final atomic positions are given in Table 1. Figure 3 shows the Na3FeB5O10 structure. Iron atoms are located in the center of slightly distorted
tetrahedra (Fe-O distances ranging from 1.97 to 2.12 Å) with an average bond length of 2.02 Å, in good agreement with reported Fe-O distances in tetrahedral oxygen coordination.17,18 All four oxygen ligands of the FeO4 tetrahedra are also terminal oxygen atoms of distinct
pentaborate anions [B5O10]5-. The latter are built upon one BO4 tetrahedra (average bond
length 1.48 Å) linked to four trigonal planar BO3 groups by oxygen vertices forming [B5O10]
5-units (Figure 3d). These pentaborate anions connect the FeO4 tetrahedra to form 2D layers
along the ab-plane. These layers are stacked along the c-axis with sodium atoms sitting between the layers as well as in channels along the a-axis.
The Fe-Mössbauer spectrum for the as prepared powder is shown in Figure 4, and the majority of iron can be fitted with a single doublet, confirming the occurrence of one single crystallographic site for iron. The isomer shift IS = 1.02 mm/s and a quadrupole splitting QS = 2.10 mm/s is typical of Fe2+ in tetrahedral coordination(Table S1).19,20 Note that the Mössbauer spectrum contains about 4% of Fe3BO5 impurity, consistent with the
Figure 2: Rietveld refinement of synchrotron X-ray diffraction patterns for (a) Na3FeB5O10,
and (b) Na3CoB5O10. The red crosses, black line, and green line represent the observed,
calculated and difference patterns, respectively. The positions of the Bragg reflections are shown as vertical blue bars. For Na3FeB5O10, the lower set of tick marks is Fe3BO5 (~4 w%).
5 10 15 20 2(°) - =0.41396 Å In te n s it y ( a rb . u n it s ) 5 10 15 20 2(°) - =0.41396 Å In te n s it y ( a rb . u n it s )
(a) Na
3FeB
5O
10(b) Na
3CoB
5O
10Figure 3: Structure of Na3FeB5O10 (a) and Na3CoB5O10 (b) viewed along different
crystallographic directions, and illustration of the pentaborate unit [B5O10]5-. Oxygen, boron,
sodium are coloured in red, green and yellow respectively. Iron atoms are in pink in (a) and cobalt atoms are in blue (b), and both are shown in their tetrahedral environnement.
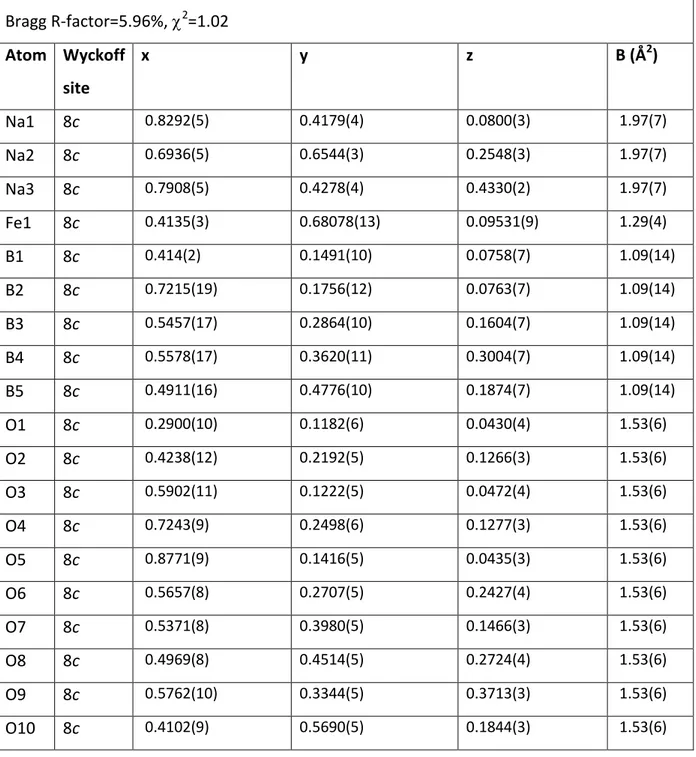
Table 1: Structural parameters of Na3FeB5O10 determined from Rietveld refinement of the
synchrotron XRD pattern. Isotropic temperature factors have been imposed equal for a same chemical species.
Na3FeB5O10 P b c a space group
a= 7.95493(5) Å, b= 12.30668(9) Å, c= 18.03983(13) Å V=1766.07(2) Å3 Z=8 Density = 2.548 g/cm3 Bragg R-factor=5.96%, 2=1.02 Atom Wyckoff site x y z B (Å2) Na1 8c 0.8292(5) 0.4179(4) 0.0800(3) 1.97(7) Na2 8c 0.6936(5) 0.6544(3) 0.2548(3) 1.97(7) Na3 8c 0.7908(5) 0.4278(4) 0.4330(2) 1.97(7) Fe1 8c 0.4135(3) 0.68078(13) 0.09531(9) 1.29(4) B1 8c 0.414(2) 0.1491(10) 0.0758(7) 1.09(14) B2 8c 0.7215(19) 0.1756(12) 0.0763(7) 1.09(14) B3 8c 0.5457(17) 0.2864(10) 0.1604(7) 1.09(14) B4 8c 0.5578(17) 0.3620(11) 0.3004(7) 1.09(14) B5 8c 0.4911(16) 0.4776(10) 0.1874(7) 1.09(14) O1 8c 0.2900(10) 0.1182(6) 0.0430(4) 1.53(6) O2 8c 0.4238(12) 0.2192(5) 0.1266(3) 1.53(6) O3 8c 0.5902(11) 0.1222(5) 0.0472(4) 1.53(6) O4 8c 0.7243(9) 0.2498(6) 0.1277(3) 1.53(6) O5 8c 0.8771(9) 0.1416(5) 0.0435(3) 1.53(6) O6 8c 0.5657(8) 0.2707(5) 0.2427(4) 1.53(6) O7 8c 0.5371(8) 0.3980(5) 0.1466(3) 1.53(6) O8 8c 0.4969(8) 0.4514(5) 0.2724(4) 1.53(6) O9 8c 0.5762(10) 0.3344(5) 0.3713(3) 1.53(6) O10 8c 0.4102(9) 0.5690(5) 0.1844(3) 1.53(6)
Having successfully solved the structure of Na3FeB5O10, we turned next to
Na3CoB5O10. The corresponding synchrotron XRD pattern immediately indicates that the
structure of the Co-based sample is different in symmetry from the iron analog. The Bragg peaks can be rather indexed in a monoclinic space group P 21/n with lattice parameters a=
6.65143(1) Å, b= 18.20986(1) Å, c= 7.80513(1) Å and β= 114.79220(1)° (unit cell volume V=858.240 Å3). A Rietveld refinement was carried out from the structural model of K3CdB5O1019, and by replacing K and Cd with Na and Co , respectively. The final Rietveld
refinement is shown in Figure 2b and Table 2 gathers the refined structural parameters. All atoms are in general position 4e of space group P 21/n with one crystallographic site for
cobalt, three for sodium, five for boron and ten for oxygen atoms. Figure 3b presents the structure of Na3CoB5O10. Similarly to the iron counterpart and despite a different space
group, the structure is also built upon CoO4 tetrahedra and [B5O10]5- units. The average Co-O
bond length in the tetrahedral is 1.98 Å, in agreement with values reported in the case of other compounds possessing Co2+ in tetrahedral environment.20 Overall, the CoO4
tetrahedra and [B5O10]5- arrangement ressembles the one of the Fe counterpart, with similar
2D layers stacked along the b-axis.
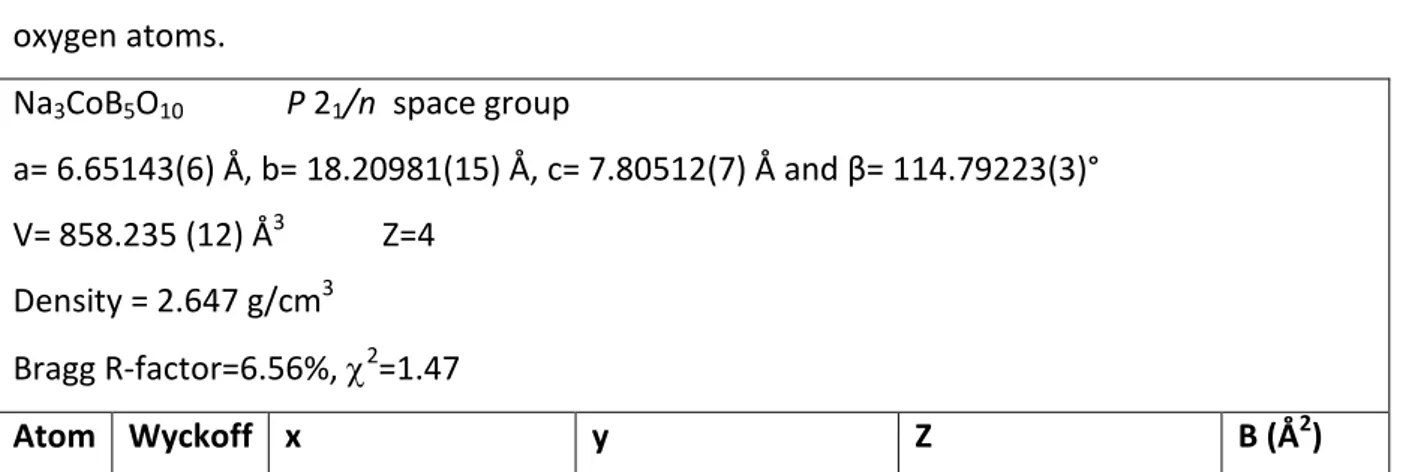
Table 2: Structural parameters of Na3CoB5O10 determined from Rietveld refinement of the
synchrotron XRD pattern. Isotropic temperature factors have been imposed equal for all oxygen atoms.
Na3CoB5O10 P 21/n space group
a= 6.65143(6) Å, b= 18.20981(15) Å, c= 7.80512(7) Å and β= 114.79223(3)° V=858.235 (12) Å3 Z=4
Density = 2.647 g/cm3
Bragg R-factor=6.56%, 2=1.47
site Co1 4e 0.4938(2) 0.09529(6) 0.12100(16) 0.97(3) Na1 4e 1.0215(5) 0.06927(15) 0.1537(4) 1.31(7) Na2 4e 0.5356(5) 0.07253(15) -0.2967(4) 2.25(9) Na3 4e 0.2007(5) 0.24423(14) -0.0962(4) 0.85(3) B1 4e 0.7050(15) 0.2127(5) -0.0092(14) 0.7(2) B2 4e 0.1192(16) 0.0766(4) -0.2204(12) 0.5(2) B3 4e 0.1200(19) 0.1643(6) -0.4532(14) 1.9(3) B4 4e 0.2734(16) 0.1881(6) 0.3233(13) 1.7(3) B5 4e 0.8089(15) 0.0738(5) 0.4833(12) 0.52(20) O1 4e 0.3823(8) 0.3659(3) -0.0583(6) 0.85(3) O2 4e 0.6864(9) 0.1334(2) 0.0034(6) 0.85(3) O3 4e 0.6234(8) 0.0399(2) 0.3567(6) 0.85(3) O4 4e 0.2150(8) 0.1274(3) -0.2604(7) 0.85(3) O5 4e 0.2347(8) 0.1406(2) -0.5576(7) 0.85(3) O6 4e 0.2214(8) 0.0375(2) -0.0479(6) 0.85(3) O7 4e 0.1189(7) 0.2431(3) -0.4250(6) 0.85(3) O8 4e 1.0892(9) -0.0428(2) 0.3357(7) 0.85(3) O9 4e 0.3217(8) 0.1712(2) 0.1747(6) 0.85(3) O10 4e -0.2188(8) 0.2304(2) -0.1428(7) 0.85(3)
This similarity does not come as a surprise since we noticed that both structure are actually structurally related. For instance, Na3FeB5O10 and Na3CoB5O10 lattice basis vectors
are related by the following matrix:
( 𝒂𝐹𝑒 𝒃𝐹𝑒 𝒄𝐹𝑒 ) = (−1 0 1 1 0 1 0 −1 0 ) ( 𝒂𝐶𝑜 𝒃𝐶𝑜 𝒄𝐶𝑜 )
The thermal stability of Na3FeB5O10 and Na3CoB5O10 was checked by the TGA-DSC
a heating rate of 5°C/min under air (Figure S1). Na3FeB5O10 and Na3CoB5O10 are stable until
600 and 750°C, respectively. Above 600°C, an exothermic peak is observed for Na3FeB5O10.
This peak is most likely associated with the dissociation of Na3FeB5O10 into iron oxide Fe2O3
and Na2B4O7, as confirmed by the corresponding XRD pattern taken after annealing a sample
for 12h at 650°C (Figure S2). A weight gain around 2% is visible above 600°C, furthermore suggesting oxygen uptake through the formation of Fe2O3. At higher temperatures we note
the presence of large endothermic peaks at 710 and 770°C attributed to the melting point of the decomposition products in the case of Na3FeB5O10 (Na2B4O7 and Fe2O3) and Na3CoB5O10
respectively.
c) Electrochemical characterization
As described in the crystallographic section, both Na3FeB5O10 and Na3CoB5O10
structures offer the possibility of 3D Na mobility, making it suitable as a possible cathode material for Na-ion batteries. Therefore we examined their electrochemical performance in half cells versus sodium in non-aqueous electrolyte using galvanostatic experiments.
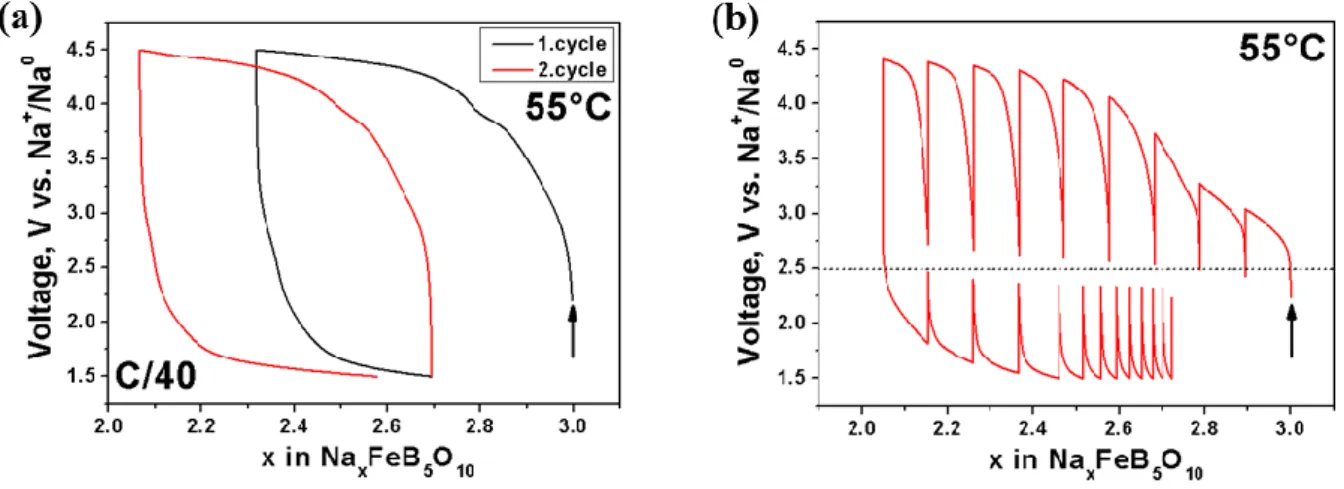
A typical voltage-composition curve for Na3FeB5O10 starting on oxidation with a C/40
rate at 55°C between 4.5 and 1.5 V is shown in Figure 5a. During the initial oxidation voltage increases rapidly and above 4.0 V a pseudo plateau is reached where it slopes slowly up to the cutoff potential of 4.5 V. Upon following reduction the potential drops steep down to 2.0 V reaching a sloping plateau down to the lower cutoff voltage of 1.5 V. Approximately ~0.6 Na+ can be removed during the first charge and 0.3 Na+ can be reinserted upon following discharge, leading to a reversible capacity of around 30 mAh/g (80 mAh/g theoretical capacity for the reversible removal of 1 Na+). Interestingly the amount of reversible Na+ reinserted during the second cycle is larger than for the initial one, pointing towards an irreversible Na+ loss during the first oxidation. As the galvanostatic curve shows a large voltage gap between charge and discharge, a precise determination of the Fe3+/Fe2+ redox potential was impossible. Consequently galvanostatic intermittent titration technique (GITT) with open circuit voltage (OCV) periode each 0.1 Na+ extracted/inserted was done, allowing the system to reach the true thermodynamic potentials. As shown in Figure 6b, after each positive or negative current pulse, strong alternative drops and increases in potential (from 0.5 to ~2 V) are observed, indicative of poor Na+/ electronic transport within this phase.
However at the end of each OCV period an equilibrium potential of ~2.5 V vs. Na+/Na0 is reached, implying a biphasic Na insertion/deinsertion process. The difference in the amount of Na extracted and reinserted during the GITT measurement compared to galvanostatic cycling can be most likely correlated a pronounced electrolyte decomposition for the former one, as it is much more time consuming hence the electrolyte is much longer exposed to elevated temperature and voltage.
Figure 5: (a) Voltage-composition and (b) GITT curve of Na3FeB5O10 versus sodium between
4.5 and 1.5 V at 55°C using a C/40 rate. In the case of (b) OCV periods of 12h alternate with 4h of current pulse.
To confirm the Fe3+/Fe2+ redox process, ex situ Mössbauer spectra for charged (4.5 V) and discharged (1.5 V) samples of Na3FeB5O10 were recorded (Figure 6). To recover the
active material, cells were disassembled inside the dry box, the powder was recovered and washed two times with DMC and dried under vacuum prior to examination. At the end of charge, the Fe2+ doublet is reduced to the benefit of an additional contribution arising from Fe3+ which is diminished upon following reduction, however the reduction of Fe3+ to Fe2+ is not fully reversible. The variations of the total amounts of Fe3+/Fe2+ are given in Table S1 and are in agreement with the amount of sodium extracted and reinserted as seen in the electrochemical charge/discharge curve.
Figure 6: Room temperature ex situ Mössbauer spectra recorded for Na3FeB5O10 at 4.5 V
(charged) and at 1.5 V (discharged).
Lastly, we tested the Co-based phase by assembling a Na/Na3CoB5O10 cell under a
similar protocol as for Na/Na3FeB5O10 and observed no electrochemical activity till 4.5 V. This
does not come as a total surprise since we know from DFT calculations that in a well-defined family of 3d polyanionic compounds, the M3+/M2+ redox potential increases from Fe to Mn, Co and Ni with differences that can be near 1.5 V between Fe3+/Fe2+ and Co3+/Co2+ in olivine-type LMPO4 compounds for instance. Thus, electrolyte with higher stability against oxidation
is sorely needed to further explore such high potential redox materials.21
At this stage, a legitimate question deals with the origin of the poor electrochemical performances of these phases which can be due to either the inactivity of the cationic redox couples over the explored potential or to some kinetic limitations associated to poor ionic and electronic transport.
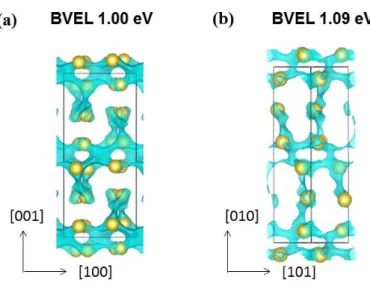
To first sense the aptitude of such compounds towards ionic conduction, bond valence energy landscapes (BVEL) were generated according to the method developed by S. Adams.22 Figure 7 shows the calculated BVEL maps representing the Na+ conduction pathways in Na3MB5O10 (M =Fe (a), Co (b)). These maps were calculated considering anionic
neighbours up to 8 Å for Na. For Na3FeB5O10,infinite 1D Na+ conduction paths, involving Na1
and Na3 sites and not Na2 one that is sterically hindered, appear along the a-axis at 1.00 eV above the minimum energy. When applying the same calculations to Na3CoB5O10, we note
pathways for Na migration. For both compounds both percolation energies are in the same order of magnitude, moreover the Na+ conduction pathways are lying in between the MO4/[B5O10] layers, obviously implying an anisotropic conduction.
Figure 7: Bond valence energy landscape (BVEL) of (a) Na3FeB5O10 and (b) Na3CoB5O10. The
percolation energies are given in the figure. Iso-energy blue domains indicate paths for Na (yellow spheres) conduction.
In order to validate these results we measured material’s conductivity by AC impedance spectroscopy. The Impedance spectra were recorded on sintered pellets between ionically blocking platinum electrodes for temperatures ranging from 250 to 400°C in argon flow. A depressed semicircle with a Warburg tail was measured for Na3FeB5O10 and
Na3CoB5O10 (Figure S3), suggesting the AC conductivity to be mostly ionic. Both spectra were
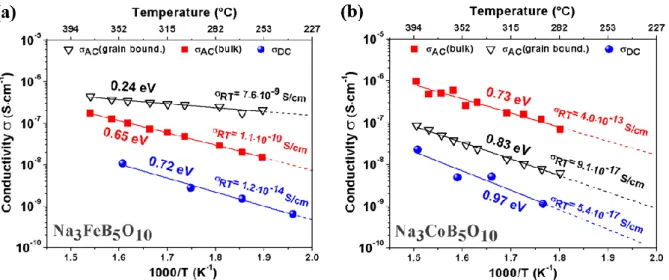
fitted with the equivalent circuit shown as inset in Figure S4 including bulk and grain boundary contributions. The corresponding Arrhenius plots are show in Figure 8 where for M = Fe, one can first note a linear increase of the bulk ionic conductivity from 1.5·10-8 to 1.7·10
-7
S/cm at 250°C and 380°C respectively, with an activation energy of 0.65 eV. The grain boundary contribution also increases linear from 1.9·10-7 to 4.7·10-7 S/cm for 250°C and 380°C respectively, exhibiting a smaller activation energy of 0.24 eV. Surprisingly, the grain boundary conductivity is higher than the bulk one. One possibility to account for this information is rooted in the existence of a minor Fe3BO5 impurity (4%) in our sample which is
located between the grains. Therefore, they can lead to enhanced grain boundary conductivities so that our experimental values may be overestimated.23
Turning to M = Co, the bulk ionic conductivity increases linearly from 6.9·10-8 to 9.8·10-7 S/cm between 280 and 390°C with an associated activation energy of 0.73 eV. The grain boundary ionic conductivity follows the same trend in a parallel way, however the absolute values are about one order of magnitude lower than the values obtained for the bulk conductivity (5.9·10-9 to 8.6·10-8 S/cm), corresponding to an activation energy of 0.83 eV. Note that the linear extrapolation of the experimental values leads to RT conductivities of 4.0·10-13 and 9.1·10-17 S/cm for the bulk and grain boundary contribution respectively.
To clearly separate the ionic- from the electronic contribution, additional DC polarization measurements were conducted. After applying a potential of 0.5 V across the sample, the current response was followed and a sharp increase followed by a slow decay to a steady state current value was observed. It represents the pure electronic conduction of the material as we used ionically blocking Pt electrodes (Figure S4). Note that for M=Fe, the decay is approximately 4 times faster compared to M=Co, indicating faster Na+ migration.
For M = Fe the electronic conductivity increases between 250 to 350°C from 6.3·10-10 to 1.0·10-8 S/cm and such an increase is correlated to an activation energy of 0.72 eV. For M = Co an increase between 290 to 390°C from 1.1·10-9 to 2.2·10-8 S/cm is observed with a corresponding activation energy of 0.97 eV. Lastly, a linear extrapolation of the experimental values leads to RT electronic conductivities of 1.2·10-14 and 5.4·10-17 S/cm for M = Fe and Co respectively.
For comparison, it should be recalled that the values for the RT bulk ionic conductivity of Na3FeB5O10 are one only order of magnitude lower than the one of LiFePO4
(≈2·10-9 S/cm) 24 and two order of magnitudes higher than Li2FeSiO4 (≈6∙10-14 S/cm) 25 , both
of which can reversibly insert one Li per unit formula. Having this in mind, the poor electrochemical performance of Na3FeB5O10 comes still somewhat as a surprise as it should
not be ionically limited. Pushing further this comparison, it is worth mentioning that the electronic conductivity of LiFePO4 is higher than that of Na3FeB5O10 and this could be a
reason for the poor electrochemical properties as we need both ionic an electronic conductivity to electrochemically trigger insertion/ deinsertion reactions. Such a limitation can also be of structural nature with the under-stoichiometric Na3-xFeB5O10 phase being
Li2FeSiO4 could not be extended below one, as confirmed by DFT calculations. Turning back
to (Figure 5b), one can note that the equilibrium potential reaches a plateau which is indicative of a two-phase Na insertion/ deinsertion reaction, hence one can assume the formation of an intermediate phase NaxFeB5O10 which is most likely the limiting factor for
electrochemical activity, similar to what was observed in the case of LiFeBO3.26,27
Distinguishing between electronic and structural limitations will require DFT calculations which have been planned in view of establishing the room temperature Na3-xFeB2O10 phase
diagram.
Figure 8: Arrhenius plot of the AC and DC conductivity of (a) Na3FeB5O10 and (b) Na3CoB5O10
derived in the temperature range from around 250 to 400°C during heating in argon flow.
Conclusion
We have reported the successful synthesis of two new sodium transition metal pentaborates Na3MB5O10 (M = Fe, Co) and solved their crystal structures from synchrotron
XRD. Related structures of both compounds show layers consisting of pentaborate B5O10
groups connected through M2+ in tetrahedral coordination. Complementary galvanostatic- and ex situ Mössbauer measurements have confirmed a Fe3+/Fe2+ redox activity centered around 2.5 V vs. Na+/Na0 for Na3FeB5O10. In contrast no electrochemical activity was
detected for Na3CoB5O10. Combined BVEL calculations and AC/DC conductivity
measurements reveal strong kinetic limitations for Na3CoB5O10, reflected in the low RT ionic/
electronic conductivities of 4.0·10-13 and 5.4·10-17 S/cm respectively. In contrast Na3FeB5O10
shows ionic conductivity of 1.1·10-10 S/cm comparable to LFP, however the RT electronic conductivity (1.2·10-14 S/cm) is much lower. Besides the poor electronic conductivity, the limited electrochemical performance could equally be due to the structural/thermodynamic instability of the intermediate phase NaxFeB5O10 formed during the two-phase (de)sodiation
reaction.
Although a reversible electrochemical activity could be demonstrated for Na3FeB5O10,
this material cannot be considered for practical applications. Attempts to combat the electronic limitation by coating the particles with a conducting carbon layer have failed in increasing its electrochemical activity. Obviously, these results call for further exploration of polyanionic borate based materials in terms of their ionic mobility, despite difficulties encountered during the design of new compounds out of this family.
Author information
Corresponding Author
* E-mail: jean-marie.tarascon@college-de-france.fr
Notes
The authors declare no competing financial interest.
Acknowledgement
F.S. acknowledges ALISTORE-ERI for his PhD grant. Use of the 11-BM mail service of the APS at Argonne National Laboratory was supported by the U.S. Department of Energy under Contract No. DE-AC02-06CH11357 and is greatly acknowledged.
References
(1) Tarascon, J.-M. Key Challenges in Future Li-Battery Research. Philos. Trans. R. Soc.
(2) Dunn, B.; Kamath, H.; Tarascon, J.-M. Electrical Energy Storage for the Grid: A Battery of Choices. Science 2011, 334 (6058), 928–935.
(3) Kubota, K.; Komaba, S. Review—Practical Issues and Future Perspective for Na-Ion Batteries. J. Electrochem. Soc. 2015, 162 (14), A2538–A2550.
(4) Komaba, S.; Takei, C.; Nakayama, T.; Ogata, A.; Yabuuchi, N. Electrochemical
Intercalation Activity of Layered NaCrO2 vs. LiCrO2. Electrochem. Commun. 2010, 12 (3), 355–358.
(5) Komaba, S.; Yabuuchi, N.; Nakayama, T.; Ogata, A.; Ishikawa, T.; Nakai, I. Study on the Reversible Electrode Reaction of Na1–xNi0.5Mn0.5O2 for a Rechargeable Sodium-Ion Battery. Inorg. Chem. 2012, 51 (11), 6211–6220.
(6) Park, Y.-U.; Seo, D.-H.; Kim, H.; Kim, J.; Lee, S.; Kim, B.; Kang, K. A Family of High-Performance Cathode Materials for Na-Ion Batteries, Na3(VO1−xPO4)2 F1+2x (0 ≤ X ≤ 1): Combined First-Principles and Experimental Study. Adv. Funct. Mater. 2014, 24 (29), 4603–4614.
(7) Barpanda, P.; Oyama, G.; Nishimura, S.; Chung, S.-C.; Yamada, A. A 3.8-V Earth-Abundant Sodium Battery Electrode. Nat. Commun. 2014, 5, 4358.
(8) Kundu, D.; Talaie, E.; Duffort, V.; Nazar, L. F. The Emerging Chemistry of Sodium Ion Batteries for Electrochemical Energy Storage. Angew. Chem. Int. Ed. 2015, 54 (11), 3431–3448.
(9) Becker, P. Borate Materials in Nonlinear Optics. Adv. Mater. 1998, 10 (13), 979–992. (10) Pilz, T.; Jansen, M. Li2B6O9F2, a New Acentric Fluorooxoborate. Z. Für Anorg. Allg.
Chem. 2011, 637 (14–15), 2148–2152.
(11) Rowsell, J. L. C.; Taylor, N. J.; Nazar, L. F. Structure and Ion Exchange Properties of a New Cobalt Borate with a Tunnel Structure “Templated” by Na +. J. Am. Chem. Soc.
2002, 124 (23), 6522–6523.
(12) Moore, P. B.; Araki, T. Wightmanite, Mg5(O)(OH)5[BO3]·nH2O, a Natural Drainpipe.
Nature 1972, 239 (89), 25–26.
(13) Chen, X.; Li, M.; Zuo, J.; Chang, X.; Zang, H.; Xiao, W. Syntheses and Crystal Structures of Two Pentaborates, Na3CaB5O10 and Na3MgB5O10. Solid State Sci. 2007, 9 (8), 678–685.
(14) Chen, X.; Li, M.; Chang, X.; Zang, H.; Xiao, W. Synthesis and Crystal Structure of a Novel Pentaborate, Na3ZnB5O10. J. Solid State Chem. 2007, 180 (5), 1658–1663.
(15) Rietveld, H. A Profile Refinement Method for Nuclear and Magnetic Structures. J. Appl.
Crystallogr. 1969, 2 (2), 65–71.
(16) Rodríguez-Carvajal, J. FullProf Suite.
(17) Sirisopanaporn, C.; Masquelier, C.; Bruce, P. G.; Armstrong, A. R.; Dominko, R.
Dependence of Li2FeSiO4 Electrochemistry on Structure. J. Am. Chem. Soc. 2011, 133 (5), 1263–1265.
(18) Shannon, R. t; Prewitt, C. T. Effective Ionic Radii in Oxides and Fluorides. Acta
Crystallogr. B 1969, 25 (5), 925–946.
(19) Yu, H.; Pan, S.; Wu, H.; Han, J.; Dong, X.; Zhou, Z. Synthesis, Structure Characterization and Optical Properties of a New Tripotassium Cadmium Pentaborate, K3CdB5O10. J.
Solid State Chem. 2011, 184 (7), 1644–1648.
(20) Yamaguchi, H.; Akatsuka, K.; Setoguchi, M.; Takaki, Y. Structure of Cobalt Dilithium Silicate βII-Li2CoSiO4. Acta Crystallogr. Sect. B 1979, 35 (11), 2680–2682.
(21) Arroyo-de Dompablo, M. E.; Armand, M.; Tarascon, J. M.; Amador, U. On-Demand Design of Polyoxianionic Cathode Materials Based on Electronegativity Correlations:
An Exploration of the Li2MSiO4 System (M = Fe, Mn, Co, Ni). Electrochem. Commun.
2006, 8 (8), 1292–1298.
(22) Adams, S. From Bond Valence Maps to Energy Landscapes for Mobile Ions in Ion-Conducting Solids. Solid State Ion. 2006, 177 (19–25), 1625–1630.
(23) Hui, S. (Rob); Roller, J.; Yick, S.; Zhang, X.; Decès-Petit, C.; Xie, Y.; Maric, R.; Ghosh, D. A Brief Review of the Ionic Conductivity Enhancement for Selected Oxide Electrolytes. J.
Power Sources 2007, 172 (2), 493–502.
(24) Recham, N.; Chotard, J.-N.; Dupont, L.; Delacourt, C.; Walker, W.; Armand, M.; Tarascon, J.-M. A 3.6 V Lithium-Based Fluorosulphate Insertion Positive Electrode for Lithium-Ion Batteries. Nat. Mater. 2010, 9 (1), 68–74.
(25) Dominko, R. Li2MSiO4 (M = Fe And/Or Mn) Cathode Materials. J. Power Sources 2008,
184 (2), 462–468.
(26) Bo, S.-H.; Nam, K.-W.; Borkiewicz, O. J.; Hu, Y.-Y.; Yang, X.-Q.; Chupas, P. J.; Chapman, K. W.; Wu, L.; Zhang, L.; Wang, F.; Grey, C. P.; Khalifah, P. G. Structures of Delithiated and Degraded LiFeBO 3 , and Their Distinct Changes upon Electrochemical Cycling.
Inorg. Chem. 2014, 53 (13), 6585–6595.
(27) Loftager, S.; García-Lastra, J. M.; Vegge, T. A Density Functional Theory Study of the Ionic and Electronic Transport Mechanisms in LiFeBO 3 Battery Electrodes. J. Phys.
Chem. C 2016.
TOC graphic
Representative Nyquist plot of the AC impedance of Na3MB5O10 containing M2+ in
tetrahedral coordination schematic view of two M2+O4 tetrahedra connected through one
![Figure 3: Structure of Na 3 FeB 5 O 10 (a) and Na 3 CoB 5 O 10 (b) viewed along different crystallographic directions, and illustration of the pentaborate unit [B 5 O 10 ] 5-](https://thumb-eu.123doks.com/thumbv2/123doknet/11551411.296503/9.892.141.750.110.584/figure-structure-viewed-different-crystallographic-directions-illustration-pentaborate.webp)