A Comparison of Voluntary
and Electrically Induced Contractions
by Interleaved
1
H- and
31
P-NMRS
in Humans
M. Vanderthommen
1, S. Duteil ², C. Wary ², J.S. Raynaud ²,
A. Leroy-Willig ², J.M. Crielaard
1and P.G. Carlier ²
1 Physical Medicine Department, University Hospital, 4000 Liège, Belgium;
² NMR Laboratory, AFM and CEA, Institute of Myology, Pitié-Salpêtrière University Hospital, 75651 Paris, France.
Abbreviated title: 1H- and 31P-NMRS in electrically stimulated muscle Address for mailing proofs: Marc Vanderthommen
ISEPK B21 Sart Tilman
4000 LIEGE
Belgium
Tel.: 32 (0) 4 366 38 78 Fax: 32 (0) 4 366 29 01
E-mail: mvanderthommen@ulg.ac.be
ABSTRACT
Skeletal muscle voluntary contractions (VC) and electrical stimulations (ES) were compared in eight healthy men. High-energy phosphates and myoglobin oxygenation were simultaneously monitored in the quadriceps by interleaved 1H- and 31P-NMRS. For the VC protocol, subjects performed 5 or 6 bouts of 5 min with a workload increment of 10% of maximal voluntary torque (MVT) at each step. The ES protocol consisted in a 13-min exercise with a load corresponding to 10% MVT. For both protocols, exercise consisted of 6-s isometric contractions/6-s rest cycles. For an identical mechanical level (10% MVT), ES induced larger changes than VC in Pi/PCr ratio [1.38 ± 1.14 (ES) vs. 0.13 ± 0.04 (VC)], pH [6.69 ± 0.11 (ES) vs. 7.04 ± 0.07 (VC)] and myoglobin desaturation [43 ± 15.9 (ES) vs. 6.1 ± 4.6% (VC)]. Electrical stimulations activated the muscle facing the NMR coil to a greater extent than did voluntary contractions when evaluated under identical technical conditions. This metabolic pattern can be interpreted in terms of specific temporal and spatial muscle cell recruitment. Furthermore, at identical levels of energy charge, the muscle was more acidotic and cytoplasm appeared more oxygenated during ES than during VC. These results are in accordance with a preferential recruitment of type II fibers and a relative muscle hyperperfusion during ES.
KEYWORDS: muscle metabolism, electrical stimulation, high-energy phosphates, myoglobin oxygenation, human.
INTRODUCTION
Neuromuscular electrical stimulations (ES) are frequently used to strengthen normal muscle (24). In pathology, several investigators have shown the merit of ES for the treatment of amyotrophy related to immobilization (12). The efficacy of ES of the quadriceps during rehabilitation following anterior cruciate ligament surgery has been well documented (8, 10). Percutaneous electrodes facing muscle motor points are used to stimulate muscle in stimulation/rest cycles. The stimulation frequency, typically 50 to 100 Hz, is chosen to induce tetanic contractions. Sensory discomfort related to current intensity varies considerably between subjects, but remains the major limitation to strength improvement (24). Eriksson & Häggmark (12) concluded that, in the context of rehabilitation, the addition of neuromuscular ES to voluntary exercise was superior to isometric voluntary contractions (VC) alone. To explain this advantage of combining ES with VC, it was hypothesized that electrically-induced contractions imposed a specific recruitment pattern depending on location of depolarized motor units within the muscle (23) and also increased the metabolic demand for ES compared to VC for a given force development (49).
Different techniques have been used to study the metabolism of electrically-contracted muscle in humans. In the 1980s, biopsy samples were taken from the electrostimulated quadriceps (43, 44), but this invasive technique does not allow dynamic investigations in the same tissue sample. Myoelectric signal detection (23) demonstrated a modification in the order of motor unit recruitment and the electromyogram root-mean square (34) technique showed a pronounced low-frequency fatigue during electrically elicited contractions.
An improved understanding of the mechanisms involved during neuromuscular ES could be gained from newly available interleaved NMR techniques (5, 41). These can acquire several biochemical and physiological parameters non-invasively during exercise. In vivo nuclear magnetic resonance spectroscopy (NMRS) of 31P can continuously monitor the phosphorylated metabolites involved as energy transducers (2, 21). First reported in 1981, with investigations of healthy (7) and diseased (40) human skeletal muscles, 31P NMR has become the most popular nucleus in exploring muscle
metabolism. In vivo H NMRS of deoxymyoglobin in exercising human muscle was pioneered by Wang et al. (51), and gives instant information on the oxygenation state of muscle cells. Simultaneous 31P and 1H NMRS of human skeletal muscle, first realized by Richardson et al. (39), can collect both
these parameters during the same physiological event, providing an invaluable tool for the in vivo study of tissue metabolism.
Compared to VC, NMR investigations of neuromuscular ES present additional technical difficulties but have nonetheless been carried out in healthy (1, 25, 28, 50) and paraplegic subjects (14). Here, we present the first exploration of muscle metabolism in man during tetanic intermittent ES by interleaved multinuclear NMRS. An electronic link was constructed to filter and synchronize tetanic intermittent ES of the quadriceps with NMR acquisitions in a large bore magnet and an NMR sequence was implemented to interleave 1H- and 31P-spectroscopy signals acquired with a double-tuned surface coil.
The purposes of the present work were 1) to monitor high-energy phosphate metabolism and cellular oxygenation in the electrostimulated quadriceps, simultaneously, with an adequate temporal resolution, 2) to compare these with the same parameters evaluated during a protocol of VC in the same subjects, 3) from the detailed analysis of these parameters to gain better understanding of the specific metabolic patterns involved during neuromuscular ES. The specific objectives were to determine a) whether the energy demand during ES was higher than during VC and if this difference persisted when taking into account the differences in mass of quadriceps involved in the two procedures; b) whether glycolytic fibers were preferentially recruited during ES, as compared to VC, as would be indicated by a faster decline of intracellular pH with increasing levels of ADP ; c) if the intracellular PO2 drop was a mechanism to increase O2 flux in response to the higher energy demand during ES; d) if the fall in intracellular PO2 during ES might be modulated by other factors than the high energy demand, in particular by the hyperperfusion that has been revealed by previous PET studies (48).
MATERIAL AND METHODS
Eight healthy male volunteers (age 22.5 ± 2.9 years) who had given informed written consent were studied. All subjects were involved in recreational physical activities. The protocol was authorized by the ethics committees of the University of Liège (Belgium) and the Kremlin Bicêtre University Hospital (France). Subjects first underwent an evaluation to determine the quadriceps maximum isometric voluntary torque (QMIVT) from the left lower limb. One week later, metabolism was investigated in the left quadriceps with NMRS during a VC session on one day and an ES session on the following day. After the stimulated exercise, the maximal myoglobin desaturation was measured during an ischemia (IS) of the thigh. To verify the absence of cumulative effects on metabolism of either VC or ES, two subjects performed a second VC session (VC2) after the ES and IS sessions.
1) Quadriceps maximum isometric voluntary torque measurement
The isometric torque of the quadriceps was measured on a dynamometer via a static strain-gauge transducer (DS Europe, FS100kg). The subject was placed in a knee extensor testing chair with 60° of knee flexion and 30° of hip flexion and was asked to exert three maximum isometric knee extensions for 4 s with 2-min recoveries between contractions. The highest torque measured was recorded as the QMIVT value (246 ± 49 Nm). The gravity torque of the left leg was also measured (13 ± 2 Nm) and was taken into account in the QMIVT measurement.
2) Voluntary
contraction
protocol
A) Subject position and material (figure 1)
For the VC protocol, the subject was positioned supine in the magnet. The left thigh was set on an adjustable inclined plane that imposed 30° hip and 60° knee flexion. The subject wore a therapy boot attached with a nylon rope via 2 pulleys to weights outside the magnet. This custom-built ergometer was adjusted so that the rope was perpendicular to the leg axis. The load was imposed as percentage of QMIVT, calculating the weights with respect to the QMIVT, the gravity torque of the leg and the
distance between the articular interline of the knee and the point where the rope was attached to the boot (0.42 ± 0.01 m).
B) Exercise characteristics
The subject performed a progressive exercise of the quadriceps composed of different steps. Bouts of 5-min exercise alternated with periods of 5-min rest. During exercise, the subject was instructed to raise his heel by 2 cm at an acoustic signal and to maintain it during 6 s until another signal. Resting and lifting alternated every 6 s for each 5-min bout. The workload was incremented by 10% of QMIVT at each step, starting at 10% of QMIVT (28 ± 8 N), and ending at exhaustion, which corresponded to 50% of QMIVT (259 ± 50 N) for 5 subjects, and to 60% of QMIVT (300 ± 43 N) for 3 others. An observer positioned near the distal aperture of the magnet monitored the exercise informing the volunteer of how high he lifted his heel during contraction periods.
3) Electrical
stimulation
protocol
A) Subject position and material (figure 1)
Subject position and materials used were the same as in the VC protocol.
B) Exercise and electrical stimulation characteristics
The subject performed one electrically elicited effort that lasted 13 min and was followed by a recovery of 7 min. The isometric contraction (6 s)/rest (6 s) cycles were applied with a workload corresponding to 10% of QMIVT. This protocol was chosen for its efficiency in improving quadriceps strength in able-bodied subjects (11) and because it avoids quadriceps atrophy during the rehabilitation period in patients with knee arthroscopy (47). The contraction period had a 0.75-s rise time, a 5-s plateau and a 0.25-s fall time. The stimulator provided bi-directional symmetric rectangular impulses directly to the skin through elastomer surface electrodes. Pulse frequency and width were 50 Hz and 0.25 ms respectively. One channel was used with one pole connected to a stimulating electrode (4.5 x 5 cm) and the other one to a dispersive electrode (9 x 5 cm). The stimulating electrode was placed on the
motor point of the left rectus femoris. The distance between the electrode’s distal side and the patellar base ranged from 13 to 18 cm. The dispersive electrode was placed transversally on the proximal part of the quadriceps, with its lower edge 5 cm above the upper edge of the stimulating electrode. During each evoked contraction of ES, the current intensity required to raise and maintain the subjects heel by 2 cm was adjusted by an operator at the console, according to instructions given by the observer in the NMR room. The current intensity increased linearly (R2 = 0.98) between the beginning (54 ± 12 mA) and the end (69 ± 15 mA) of stimulation.
4) Ischemia
protocol
For the IS protocol, the subject was positioned supine on the examination bed with legs extended and with an air cuff placed around the proximal part of the left thigh. The ischemic stress protocol consisted in 420-s leg ischemia induced by rapid inflation of the air cuff to 220 Torr. This provided a deoxymyoglobin reference signal corresponding to 100% desaturation (6).
5) NMR
measurements
A) Equipment
Experiments were carried out on a 4 Tesla superconducting magnet (Magnex 4/60) interfaced to Bruker’s Biospec NMR spectrometer and console. Magnet clear bore was 46 cm. A 5-cm diameter dual-tuned (1H and 31P) surface coil was taped on the leg facing the left rectus femoris. Identical positioning of the coil in the VC, ES and IS protocols was ensured by measuring the distance between the distal point of the coil and the patellar base (extreme values: 18 – 23 cm) and by tracing ink marks on the subjects' skin. The surface coil was placed exactly between both electrodes for the ES protocol and distally from the air cuff for the IS protocol.
Despite difficult experimental conditions regarding centering inside the magnet, Bo field homogeneity was efficiently adjusted by an automatic localized 1st and 2nd order shim procedure, FASTMAP, implemented by Bruker. The line-width at half height of the H2O peak was systematically less or equal to 40 Hz.
B) ES-NMR interfaces
ES pulses were filtered between the stimulator (outside the Faraday cage) and the electrodes (inside the magnet) so as to avoid picking up ES electronic noise by NMR. A 100-ms pulse was programmed into the NMR sequence to trigger both the ES via an electronic short circuit relay and the NMR acquisitions every 12 s.
C)31P measurement at rest
Before the VC and ES exercises, a 31P spectrum was acquired in 96 s (64 accumulations, TR=1.5 s) to obtain baseline values of the high-energy phosphates.
D) Interleaved sequence
Interleaved 1H- and 31P-NMRS acquisition modules were performed using the Bruker Multi Scan Control tool (35). Combined 1H /31P data sets were acquired every 2 s throughout the entire VC and ES protocols.
1H-module: The deoxymyoglobin resonance at 75 ppm downfield relative to water originiates from the
n-G proton of the proximal histidine F8 of myoglobin in the deoxygenated state. This resonance was selectively excited by a 0.4-ms Gaussian pulse at a TR of 18 ms with 64 accumulations (512 complex points, acquisition time 10 ms).
31P-module: High-energy phosphates were excited by a 0.25-ms single square pulse and acquired
over 1024 complex points (acquisition time 255 ms).
E) Data processing
Interleaved raw data were automatically stored as separate 1H and 31P spectroscopic components. Data were then processed using the standard manufacturer software (XWIN NMR) under which a
number of automations were written for batch processing of the spectra. To improve the S/N ratio, 6 x 64 FIDs from the 1H-module and 6 x 1 FID from the 31P-module, were summed to lead to a time resolution of 12 s, corresponding to one contraction/rest cycle.
1H-module: Manual phasing (order 0 and 1) and automatic 4th order polynomial baseline corrections
(+20/-20 ppm relative to the deoxymyoglobin peak) were applied after exponential multiplication (50 Hz) and Fourier transformation. Integration markers were manually selected for the deoxymyoglobin peak (~ ± 3 ppm). The percentage of myoglobin (Mb) desaturation was calculated by using the signal intensity after ischemia as the reference value of 100% desaturation. All deoxymyoglobin peak areas were normalized to this reference after taking the different number of accumulations into account (64 x 6 for VC or ES and 256 for IS). Conversion to PO2values was calculated from the O2–binding curve for Mb (PO2= {(1-x)/x}.P50), where x is the fraction of Mb that is not oxygenated and P50is the Mb half-saturation pressure. A Mb P50of 3.2 Torr was used (38).
31
P-module: The 31P-FIDs were exponentially multiplied (8 Hz) before Fourier transformation, manual phasing of the reference spectrum and automatic baseline correction. The Pi, PCr, J-, D- and ß-ATP peak limits were identified from frequencies referenced to the PCr peak. Peak picking and integration were automatically performed over the stack of spectra. The Pi chemical shift was taken as the center of gravity of the Pi resonance within 3.5 to 5.5 ppm limits. This procedure was applied to take into account possible deformation and asymmetry of the Pi peak during exercise. Intracellular pH changes were computed from the chemical shift (G) of the Pi peak relative to PCr according to the equation pH = 6.75 + log >(G - 3.27)/(5.69 -G)@ (45). The free cytosolic ADP concentration was calculated from the Pi/PCr ratio, using a reformulation of the creatine kinase reaction: [ADP] = 8.2.Pi/PCr.10(pH-6)/1.66. In this equation, [ATP] is taken as 8.2 mM, the creatine kinase equilibrium constant as 1.66. 109 M-1 and [Cr] is assumed to be equal to [Pi] (20).
For the VC and ES protocols, data of PCr recovery were fitted by a mono-exponential function to determine the PCr time constant of recovery (W PCr). During the recovery period, the mean pH was calculated over a time period equal to the W PCr measured. The pH was introduced into the formula that corrects for the dependence of PCr recovery on cytosolic pH (19).
The pH – [ADP] and the PO2 - [ADP] relationships were also studied during both exercises. For these two relationships, the experimental data were fitted with a mono-exponential model.
F) Ischemia sequence
Level of myoglobin desaturation: Only 1H spectroscopy was performed during this sequence composed of NR = 67 blocks of NS = 256 excitations of deoxymyoglobin by a 0.4-ms Gaussian pulse at a TR of 20 ms.
The sequence was started just after the inflation of the air cuff was achieved. 1H FIDs were processed identically to those from the 1H module of the interleaved sequence and the increase of deoxymyoglobin signal was fitted to a sigmoid model. The maximal point of this curve was taken to be the 100% desaturation reference value.
Myoglobin quantification: At the end of the ischemia, additional acquisitions (NR=4) were performed with a TR of 100ms to obtain a factor of correction for the quantification of Mb. TR was chosen to be largely superior to the longitudinal relaxation time (T1) of Mb at 4 Tesla (~10ms). Moreover, a fully relaxed spectrum of muscle water was acquired in order to quantify Mb concentration with reference to tissue water (6).
Myoglobin concentration [Mb] relative to water was calculated from the respective peak areas (A), receiver gains (RG), number of scans (NS), number of hydrogens per resonance (N) and molar concentration of water (MH2O):
O H Mb O H Mb O H Mb O H O H Mb
xM
N
N
x
NS
NS
x
RG
RG
x
A
A
Mb
2 2 2 2 2]
[
6) Statistical
analysis
Data are presented as means +/- SD, except when stated otherwise. The statistical analysis of the successive steps in the VC protocol (PCr depletion, W PCr, Pi/PCr, pH, Mb desaturation and PO2) was performed using repeated ANOVA measures. To correct for the very asymmetric distribution of the Pi/PCr ratios, a log transformation was applied prior to the ANOVA analysis. When a significant difference was detected, a subsequent comparison of means was made according to the Bonferroni test (NCSS software). For Pi/PCr, pH and Mb desaturation, we used the Bonferroni “with control” comparison test. The control value corresponded to measurements at rest.
Differences between ES and the different steps of the VC protocol in the evaluated parameters (PCr depletion, W PCr, Pi/PCr, pH, Mb desaturation and PO2) were assessed with repeated measures of ANOVA and the Bonferroni “with control” comparison test. The control value corresponded to the ES measurement.
A multiple factor ANOVA was used to assess differences between pH measured during the last min of each step and pH measured during the first min of the following recovery, differences between the steps and the interaction between these two parameters.
RESULTS
1) VC protocol
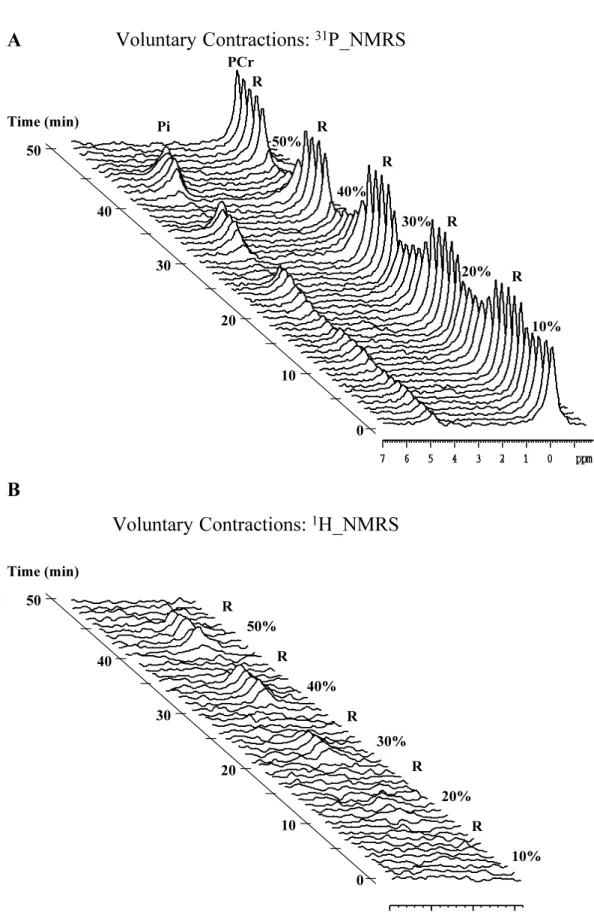
The Pi/PCr ratio and deoxymyoglobin increased and intracellular pH dropped proportionally to the workload during the exercise bouts. They all returned towards baseline values during the successive recovery phases. For each individual subject, the construction of stacked plots of 31P- and 1H-NMRS spectra gives a visual impression of the progression of the metabolic changes during the 10%, 20%, 30%, 40% and 50% of QMIVT steps and the interleaved recoveries. To improve clarity, only one spectrum out of 5 (one spectrum per minute) is shown in figure 2. For PCr, Pi/PCr, pH and deoxymyoglobin, the mean curves were reconstructed from the actual individual data sets (figure 3).
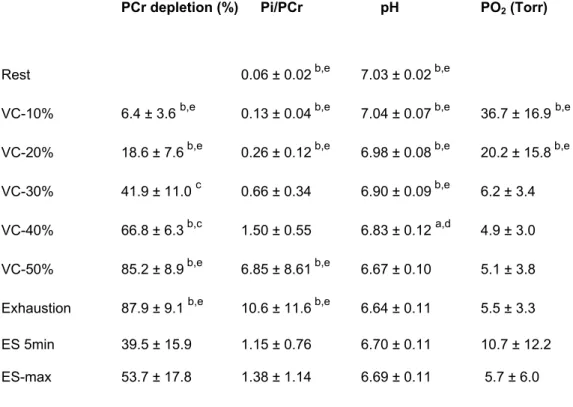
Table 1 summarizes the mean 31P and 1H NMRS results obtained at rest and at the end (last minute) of the different steps. PCr depletion increased statistically (p<0.0001 between all steps, except p<0.01 between 10% and 20%). The Pi/PCr ratio progressively increased from the resting value through the different steps. The differences were statistically significant between all steps (p ranging from <0.05 to <0.0001). In comparison with the resting value, the end-stage pH was more acidic for the 30% (p< 0.01), 40%, 50% and last QMIVT steps (p<0.001). Between rest, 10%, 20% and 30% QMIVT, Mb desaturation rose progressively, from –3.3%, 6.1%, 22.3% to 37.6%, and the differences were statistically significant between each step (p<0.05). Myoglobin desaturations ranged from 37.6% to 43.1% for steps 30% and onwards (p>0.05). For the PO2 level, as calculated from Mb desaturation, we measured a statistical difference between the 10% of QMIVT step and all other steps (p<0.01).
In the early phase of recovery following each step, intracellular pH continued to fall. When compared to the last minute of exercise, mean values of pH measured during the first minute of recovery were statistically lower and this difference increased with the workload (p<0.001).
For the last steps (from 30% of QMIVT to the last step), the recoveries of PCr could be closely fitted to a mono-exponential curve. The W PCr was prolonged with increasing force-level, and reached the mean values of 40.9 ± 8.2, 51.9 ± 11.4 and 62.7 ± 17.4 s for the recovery of the 30%, 40%, and 50%
of QMIVT steps, respectively. After correction for pH (19), the W PCr were not found to be statistically different: 32.6 ± 5.8, 37.5 ± 10.7 and 42.8 ± 18.5 s for the 30%, 40%, and 50% of QMIVT steps, respectively (p=0.66).
The two subjects who performed a second VC exercise (VC2) after the ES protocol did not show statistically different results during VC2 from those measured during the first VC protocol (VC1) for Pi/PCr, pH and Mb desaturation: 1.04 ± 0.28 vs. 1.16 ± 0.28, p=0.51; 6.95 ± 0.04 vs. 6.94 ± 0.04, p=0.54; 43.9 ± 2.87% vs. 41.2 ± 2.97%, p=0.28 respectively during the last step.
2) ES protocol
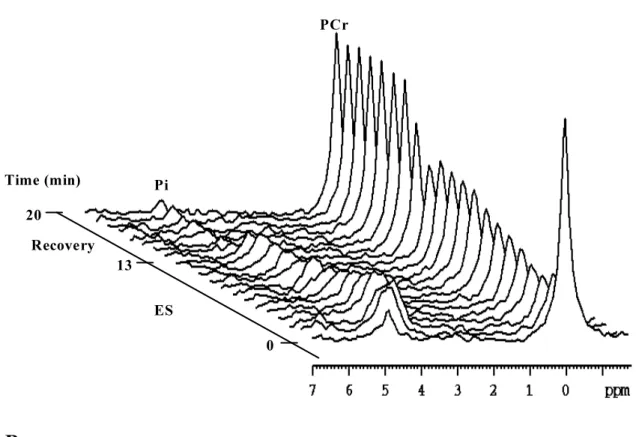
Typical stacked plots of 31P- and 1H-NMRS spectra, obtained in the same subject as in figure 2, but during ES and recovery, are provided in figure 4. As for figure 2, only one spectrum in 5 is shown.
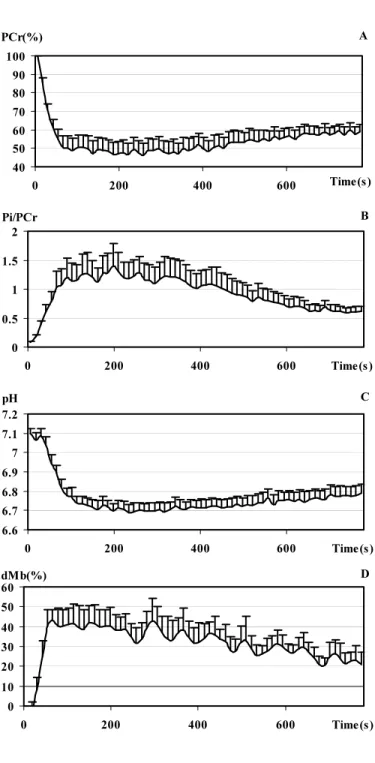
For PCr, Pi/PCr, pH and deoxymyoglobin, the mean curves were reconstructed from the actual individual data sets (figure 5). From the comparison of the four curves, it is patent that parameters showed marked variations during the two first min of ES and reached extreme values around the third min of ES. Maximal PCr depletion of 53.7 + 17.8 % was noted after 258 s ES, maximal mean Pi/PCr of 1.38 + 1.14 after 198 s ES, minimal mean pH value of 6.69 + 0.11 after 198 s ES and maximal mean value of Mb desaturation of 43.0 ± 15.9% after 66 s ES. From the 4th min up to the end of stimulation, they progressively and partially returned towards resting values.
In addition, the data were reorganized by summing the 3 FIDs collected during activation on the one side and the 3 FIDs obtained during the rest period on the other side. No statistically significant difference was detected for any parameter.
The recovery of PCr was well fitted with a mono-exponential function. The W PCr reached the mean value of 72.2 ± 25.0 s. This W PCr value was corrected for acidosis by normalizing to the actual cytosolic pH (19) and was then found to be 59.1 ± 19.0 s. This value was significantly longer than the W PCr measured during the VC protocol (p<0.05 with W PCr of 50% QMIVT, <0.01 with W PCr of 30% and 40% QMIVT).
3) Comparison between VC and ES
A) Metabolic stress
Table 1 also contains the 31P and 1H NMRS mean results obtained during ES. When comparing the metabolic stress induced by ES (ES 5min and ES-max) and VC for identical absolute workloads (10% of QMIVT), ES generated a higher metabolic demand than VC for all measured parameters (p<0.001). When comparing the metabolic stress obtained with approximately identical workloads per activated muscle group (10% of QMIVT for ES and 30% of QMIVT for VC), all parameters showed a higher metabolic solicitation under ES (ES-max), but only pH and PCr depletion differed significantly between contraction modes.
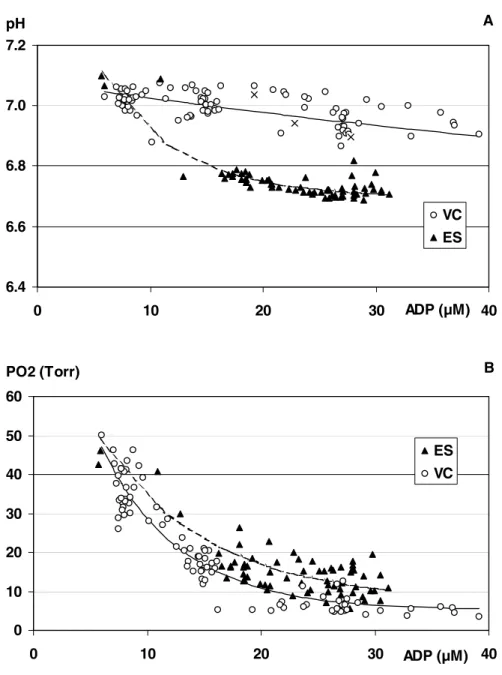
B) pH to [ADP] relationship
We studied the relationship between pH and [ADP] during both exercises for all subjects (figure 6A), taking into account all steps composed of 5-min exercise for the VC protocol, and the 13 min of stimulation for the ES protocol. These global relationships were closely fitted with a mono-exponential function (pH = a.e –b (ADP) + c), showing that the decrease of pH associated with the increase of [ADP] was markedly faster during ES than during VC. The equations fitted to the pooled data were pH = 0.52.e-0.011ADP+ 6.56 for VC and pH = 0.93.e-0.142ADP + 6.7 for ES.
C) PO2 to [ADP] relationship
All individual relationships between PO2 and [ADP] were plotted together for both types of exercise (figure 6B). The same time points as for the study of the pH-[ADP] relationship were taken into account and were fitted with the same mono-exponential function. This relationship (figure 6B) showed that the PO2rate constant appeared lower during ES than during VC. The equations fitted to the pooled data were PO2 (Torr) = 50.e-0.143(ADP-4.75) + 5.12 for VC and PO2 (Torr) = 50.e-0.103(ADP-4.1) + 7.37 for ES. This difference was further substantiated by the comparison of the PO2s measured under the
two conditions over the range of ADP activation obtained during ES (10-32 µM) and by taking ADP as covariate: 11.2 + 0.6 Torr during VC vs. 16.1 + 0.5 Torr under ES (p<10-6).
4) Myoglobin quantitation
DISCUSSION
Using a very similar approach to Richardson et al. (39), we investigated the interplay between the cell energy charge, pH and oxygenation in exercising skeletal muscle cells. Based on this analysis, we further characterized the fundamental differences in energy metabolism between voluntary and electrostimulated contractions. A main purpose of this study was to situate the metabolic stress induced by the ES program (13 min) on a scale of voluntary bouts realized against different mechanical loads. We therefore developed a progressive exercise composed of 5 or 6 steps. For this to be feasible within a single NMR exam, we decreased the bout duration from 13 to 5 min. In a preliminary study (data not shown), we demonstrated that, for a given mechanical load, results of evaluated parameters were identical after 5 min or after 13 min of VC.
In a previous study, our group used 31P NMRS to explore muscle energetics during intermittent tetanic electrical stimulation of human quadriceps (50). The present protocol is more advanced from a technical standpoint. The key element was the introduction of a new acquisition interface (Multi Scan Control -MSC- developed by A. Nauerth (Bruker, Ettlingen)), which allows extremely fast interleaving of1H and 31P NMR acquisitions. The switching was more than fast enough to be disregarded on the time scale at which the metabolic changes occur, and we can consider that muscle oxygenation, high-energy phosphates and pH were indeed simultaneously monitored. Compared to the previous work, a significant gain in signal to noise was achieved, due to the higher magnetic field (4T versus 1.5T formerly), but also to the considerably improved electronic connections between the electrostimulator and the NMR spectrometer, namely, the quality of the filtering through the Faraday cage. Part of the increase in signal to noise was traded for a better time resolution of the spectra, making it possible here to finely depict the progression of the metabolic changes during the bouts. Finally, the current study employed a simplified experimental setup in terms of number of stimulating electrodes, that facilitated data interpretation.
A concern was that the VC session, which was practiced on the day preceding ES, might have influenced the response to ES. Two subjects performed a second VC (VC2) protocol after ES. For all
steps and for all parameters, the results were comparable to those measured during the first VC protocol (p>0.05). If 30 hours after the first VC and 6 hours after ES, the results of the second VC are identical to those of the first VC, this indicates that neither VC nor ES had any prolonged cumulative effect. Alternatively, the first VC and ES might have had opposite long-lasting effects. The second hypothesis cannot be ruled out, but is unlikely and has no mechanistic support.
1) Voluntary contraction
The phosphorus metabolites involved in muscle energy production and utilization are related via the creatine kinase reaction. The changes in their relative distribution as can be detected by 31P NMR are commonly used as an indicator of the level of metabolic activation during exercise (2, 21). At the onset of exercise, there is an immediate breakdown of PCr, which provides the necessary fuel for the first seconds of contraction. The glycolytic pathway then takes over, first as a major ATP producer, then as a minor producer when the mitochondrial oxidative phosphorylations, in response to the rise in ADP, become the predominant source of ATP. Interestingly, the Pi/PCr ratio, easily monitored on the 31P spectra, evolves in direct proportion to the cytosolic ADP concentration, which is itself below direct detection limits of NMR. The Pi/PCr ratio is most useful to appreciate the mitochondrial respiratory control exerted by ADP (29). In this work, the tight coupling between force development and respiratory control by ADP was again verified by the progressive increase in the Pi/PCr ratio with the stepwise increase in mechanical load. During the last step, the mean PCr depletion and Pi/PCr ratio reached 87.9% and 10.6 respectively. This mean Pi/PCr value appeared very high in comparison with other reported exercise-induced maximal Pi/PCr ratios (3, 52), confirming that the subjects had indeed exercised until exhaustion. This should be tempered by the fact that Pi/PCr presented a large inter-individual variability and was abnormally high during the last step in some subjects because the PCr peak disappeared into the noise.
The decrease in the intracellular pH was also proportional to the increase in force level. It is still common to relate intracellular acidosis to anaerobic lactate production (46). Strictly speaking, this is untrue for two reasons. Firstly, lactate production through glycolysis does not produce protons. The net balance for H+ is nul (9). Secondly, lactate production in exercising muscles is far from being controlled by hypoxia only (37). The sympathetic tone is a major activator of the glycolytic pathway
and of lactate production, independently of the degree of cell oxygenation (18). In reality, intramyocytic acidosis develops when ATP consumption, which is the actual source of protons (15), is not balanced by mitochondrial ATP production, which drains these protons. Once the real origin of protons is made clear, it follows that proton production and ADP concentration are related during an aerobic exercise, both with each other and with the mechanical load. This is exactly what was observed in this protocol during voluntary contraction (see table 1). The minimal role of cell hypoxia was also exemplified as intracellular pH, which decreased from 6.90 to 6.67 between 30 and 50% MVC, appeared unrelated to intracellular PO2, which remained constant, 6.2 to 5.1 Torr, over this range of mechanical loads.
The decrease in pH during the early phase of recovery of each step results from the rapid resynthesis of PCr, which affects the pH status of the cell by generating protons (45).
A 420 s ischemia of the thigh was used to obtain the maximal Mb desaturation peak, providing a reference for cytoplasmic oxygenation determination. Indeed, it has been demonstrated that the desaturation of Mb in human muscle peaked after approximately 6 min of cuff occlusion (51), and this was verified in our lab with a stable Mb desaturation for a cuff pressure 80 Torr or more above systolic blood pressure. We found no significant difference between the mean desaturation values calculated at the 5th, 6th and 7th minute of ischemia (+3% and +2% for min 6 and min 7 vs min 5, p = 0.90). Our values of [Mb] are comparable to previous determinations in the human calf muscle (5) and in the quadriceps of subjects aged between 19-39 years (31).
During exercise, muscle oxygen consumption (V° O2) can increase by adaptations in oxygen supply (O2del) and by an increase in the capillary-to-cell PO2 gradient. Increasing perfusion is the natural way to augment O2del and at the same time to raise mean capillary PO2, directly or indirectly via capillary recruitment and associated adaptations of capillary transit time (42). The other possibility for augmenting the transcapillary PO2 gradient is to decrease intracellular PO2 in order to facilitate oxygen diffusion. This was observed here with a progressive fall in intracellular PO2 between 10 and 30% MVC. The appearance of deoxygenated myoglobin and thus the fall in intracellular PO2 even during relatively low work levels (such as 20% of MVT) might also have been facilitated by the experimental design (6s isometric contraction – 6s rest), with ischemia induced during contraction and incomplete recovery
during relaxation. Above 30% MVC, intracellular PO2 did not however decrease any further, but rather plateaued around 5 Torr. This agrees with results of Richardson et al. (37-39), who previously studied Mb desaturation during exercise of the quadriceps in trained human volunteers, and found that muscle PO2 deduced from Mb desaturation decreased significantly during exercise, but remained at a constant level of about 3 Torr between 30 to 80 % V° O
2 max. The matter is however debated since it was reported that the capillary-to-sarcoplasm PO2 gradient increased up to V° O2 max (30). A possible but improbable explanation is that exercise intensity was not high enough in that study – it can always be claimed that the plateau was in fact not reached. In our opinion, a more likely possibility is that different muscle territories may have different regulations of O2 supply and uptake. The data by Richardson et al. (37-39) and by our group, which are in close agreement and clearly demonstrate a relatively early plateau in Mb desaturation, were collected over the course of a progressive exercise of the quadriceps. The observations by Mole et al. were made on the triceps surae (30). It is important to note that all investigators have reported a maximum Mb desaturation of approximately 48-60% during exercise. One can then reformulate the discrepant observations by saying that maximum exercise corresponds to maximum Mb desaturation in the gastrocnemius, while exercise can still be intensified in the quadriceps after maximum Mb desaturation is reached.
2) Electrical stimulation
A main result of this study is that, for an identical mechanical level (10% of MVT), ES induced far greater metabolic changes than VC. This pattern is more likely to result in a specific muscle cell recruitment involving a non-steady state metabolism and early fatigue. The demonstration of this particular pattern of muscle activation is an argument in favor of the combination of ES with VC for the treatment of amyotrophy in the context of rehabilitation. The metabolic changes measured in the present study were more severe than those of our previous investigation (50) (1.38 vs. 0.46 for the Pi/PCr ratio and 6.69 vs. 6.76 for the pH). This can be explained by a difference in the surface coil position (rectus femoris vs. vastus medialis) and/or by a more important relative loading of the stimulated muscle. Indeed, we used 3 stimulating electrodes (vastus medialis, vastus lateralis and rectus femoris) to lift a 20% of QMIVT load in the previous study and one stimulating electrode to lift a load of 10% of QMIVT in the present study. This was confirmed by the higher current intensity required at the end of the ES program of the present study in comparison to the previous one (69 vs. 51 mA).
High-energy demand during ES
The first point to be addressed was whether the exaggerated metabolic stress observed under ES resulted from an uneven distribution of the mechanical load and, precisely, from a smaller muscle mass involved during ES in comparison with VC. The exact proportion of quadriceps involved during the ES protocol applied with only one stimulating electrode positioned on the rectus femoris muscle could not be determined under the present experimental conditions. However, a PET study has demonstrated that approximately one-third of the quadriceps was recruited to lift a load of 10% of QMIVT with one stimulating electrode positioned on the vastus lateralis (49). Consequently, adjusting for work load per unit volume of activated muscle, we focused our attention on the comparison of 10% of QMIVT for ES versus 30% of QMIVT for VC. That comparison clearly showed that a greater metabolic stress held, even when the mechanical load was approximately adjusted for the muscle mass respectively involved in the two modes.
As a consequence, additional mechanisms must contribute to the exacerbated solicitation in the ES mode and it is therefore important to consider the particularities in the temporal and spatial recruitment of fibers:
1) Temporal recruitment: a light-loaded voluntary exercise principally recruits oxidative type I fibers (16) which depolarize at a low frequency (~15 Hz) (25) in a desynchronized manner (11). In contrast, ES at the same frequency is mechanically less efficient because the synchronous contractions of the depolarized motor axons involve an incomplete temporal recruitment (16). Therefore, a higher stimulation frequency (~50 Hz) is required to improve the mechanical efficiency. However this increase in the stimulation frequency, which corresponds to a supramaximal temporal recruitment, is linked to a higher metabolic demand (28).
2) Spatial recruitment: ES preferentially recruits muscle zones near the electrode and this recruitment diminishes proportionally with increasing distance from the electrode (48). A decrease of the mechanical response linked to fatigue of the superficial motor units can only be compensated by an increase of stimulation intensity. This more intense stimulation depolarizes new motor units at a greater distance from the electrode, but continues to impose a sustained contractile activity to the superficial motor units, which then present a certain degree of exhaustion (49). During the ES
protocol, what the NMR coil interogates is a mixture of progressively fatiguing fibers and newly activated ones. The coil geometry makes it predominantly sensitive to muscle fibers contained in a co-centered hemi-sphere of coil diameter (5cm). Fibers located further away from the coil, and which are progressively recruited with increasing current intensities, contribute less to the NMR signal, to an extent that cannot be precisely assigned in this protocol.
We confirmed that under ES the metabolic demand measured via the high energetic phosphates status (Pi/PCr, pH) was widely out of proportion compared to the VC requiring the same force development. Our data agree with the findings of Ratkevicius et al. (33), who compared ES and VC with31P NMR in the gastrocnemius and soleus muscles and concluded that the energy costs of force development are higher during electrically induced exercise than during voluntary exercise when continuous contraction of submaximal intensity is performed. Voluntary and functional electrical stimulated exercises were also compared during dynamic knee-extensor contractions and glycogen depletion was much higher after ES than VC (22). In addition, we demonstrated that the greater energy charge, which automatically implies specific regulations of energy metabolism, was associated with more profound changes in the level of cytoplasmic oxygenation. However, the present study could not provide direct evidence for the proposed mechanisms.
Preferential recruitment of glycolytic fibers under ES
The construction of the plots of the pH to ADP relationship identified another important particularity of the ES mode: a shift in the typology of the fibers preferentially involved during ES. As mentioned above, VC results in a fiber recruitment modulated as a function of motor unit size beginning with the small type I fibers (17), whilst ES of the quadriceps recruits superficial muscle zones that present a predominance of type II fibers (27). This is supported by the study of the pH-ADP relationship. During the gradual VC protocol, we established a reference curve for the pH decrease associated with the increase in [ADP]. The same curve plotted during ES indicated that for a given solicitation in high energy phosphates, the electrically contracted muscle was more acidotic. This observation is compatible with a preferential recruitment of type II fibers. Indeed, during classic high-intensity exercise, fast glycolytic muscle fibers become more acidic and more rapidly so than slow oxidative twitches (32). In our experimental conditions, we excluded the hypothesis of a transient impairment of
perfusion (53), which might explain the different pH-ADP relationship observed under ES, for the following reasons: 1) the PET technique has already established that the electrically stimulated muscle presents a hyperperfusion in comparison with the voluntarily contracted muscle (48). 2) One subject performed two steps of the voluntary protocol (10% and 30% of QMIVT) under ischemic conditions (data not shown) and the pH-ADP relationship was the same as that during the normal graded exercise. This result confirmed that during VC the pH-ADP relationship was not perfusion dependent.
Muscle oxygenation during ES
Based on mechanical considerations only, muscle cytoplasmic oxygenation appeared altered during ES and might be directly related to a higher muscle V° O
2 in this modality. A previous study of the electrically stimulated quadriceps with the PET technique has already shown a proportionally high level in the rate of oxygen metabolism (48). The particular contractile activity discussed above remains the most likely explanation for this exaggerated oxygen consumption at a low mechanical load.
Muscle PO2-ADP relationship under ES
The combination of the simultaneously acquired 1H and 31P data has afforded a better understanding of the muscle cell oxygen status as a function of metabolic stress. The PO2 to ADP relationship shows a slower decline rate of muscle PO2during ES than during VC. Thus, for a given metabolic stress, cytoplasm O2 content appears higher during ES than during VC. These results are compatible with a change in the dynamic equilibrium between O2 supply (O2del) and O2 demand (V° O2) and suggest an upward shift of the O2del / V°°O2 relationship during ES. The observation could be explained by a relative muscle hyperperfusion in the electrically stimulated muscle. Certainly, muscle is perfused in excess during ES, as compared to VC, for a given imposed absolute workload. This was documented by H215O PET which established that the muscular blood flow measured during an ES program reached ~ 25 ml.min-1.100 g-1 in some regions of the quadriceps (49) and that this value was three times higher than the blood flow measured during a comparable VC of the quadriceps (48). But, this would not explain the modified relationship in fig 6B. What these curves suggest is that for a given metabolic stress, estimated from the ADP concentration, muscle is hyperperfused in ES compared to VC. High muscle perfusion relative to the metabolic demand results in a high level in oxygen availability and might therefore increase cytoplasmic oxygenation. Alternatively, it might be argued that
fibers closer to the coil fatigued by ES are essentially metabolically recovering, while muscle fibers are progressively being activated during VC. So, the ADP to PO2 would be scanned from left to right during VC and predominantly from right to left during the latter phase of ES. An hysteresis like effect might then account for the differences in figure 6B. However, when considering data acquired during the first 3 minutes of ES and comparing them with data acquired later into ES, it appears that all ES data belong to the same relationship (not shown).
3) Exercise recovery
The post-exercise creatine rephosphorylation time constant (W PCr) provides a most useful index (4). If the acidotic inhibition of creatine kinase is corrected for, the W PCr is independent of the mechanical work and truly reflects the maximal capacity of the mitochondrial oxidative phosphorylation (21). This was illustrated here with the comparison of the W PCrs determined during the recovery phases of the VC session. After correction for the degree of acidosis (19), the successive measurements appeared similar and fell within the normal range determined in our laboratory. By contrast, the post-ES W PCr was prolonged by about 40%, as compared to post VC W PCrs. This is another important argument in favor of a preferential recruitment of type II fibers, with lower oxidative capacities, during ES.
4) Conclusion and perspectives
Not only did this study confirm the important increase in energy demand associated with neuromuscular ES as compared to VC, but our results also shed light on specificities of electrically stimulated contractions, which had been poorly recognized or were yet unknown. The protocol was designed in a such a way that ES and VC data could be precisely compared, with adequate matching in time and mechanical load. The introduction of heteronuclear interleaved NMR acquisitions was decisive in depicting the particular relationships between intracellular O2 and energy metabolism during neuromuscular ES. In this context, the significant new contributions were:
- the demonstration of a greater involvement of glycolysis during ES, and with the construction of the pH to ADP relationship, its dissociation from the energy charge, the latter indicating a preferential recruitment of type II fibers;
- the observation with 1H spectroscopy of Mb, of an altered transcellular O
2 gradient, which must play a role in facilitating the exacerbated V°O2 response during ES (48);
- the identification of a specific pattern for the relationship between intramyocytic PO2 and ADP during ES. After the intracellular PO2 had been normalized to the actual load imposed on the energy metabolism, the O2 gradient appeared to be reduced during ES – and not increased, as one would have intuitively hypothesized.
The lead for further investigation is certainly to explore this hypothesis of hyperperfusion under ES with the same matching of measurements as was done here for the exploration of oxygenation and high energy phosphate metabolism. Muscle perfusion can indeed be monitored in a completely non-invasive mode with new NMR imaging sequences, using arterial water as a natural endogenous tracer, and known as "arterial spin-labeling" sequences (13, 26, 36). They provide perfusion maps with high temporal - in the second range - and spatial - millimetric- resolutions. We have already shown that these arterial spin-labeling sequences can be incorporated into interleaved acquisition schemes, together with 1H- and 31P NMR spectroscopy (5, 35). Such schemes will be applied to forthcoming research on neuromuscular ES specificities to be initiated in our laboratory.
ACKNOWLEDGEMENTS
The authors thank E. Giacomini for his contribution in the development of the ES-NMR interfaces (filtering and synchronizing links) and the home-built thigh ergometer and A. Nauerth (Bruker, Ettlingen) for his support during the installation of the interleaved NMR protocol.
REFERENCES
1. Adams GR, Harris RT, Woodard D, and Dudley GA. Mapping of electrical muscle stimulation using MRI. J Appl Physiol 74: 532-537, 1993.
2. Argov Z, Lofberg M, and Arnold DL. Insights into muscle diseases gained by phosphorus magnetic resonance spectroscopy. Muscle Nerve 23: 1316-1334, 2000.
3. Bertocci LA, Haller RG, Lewis SF, Fleckenstein JL, and Nunnally RL. Abnormal high-energy phosphate metabolism in human muscle phosphofructokinase deficiency. J Appl Physiol 70: 1201-1207, 1991.
4. Blei ML, Conley KE, and Kushmerick MJ. Separate measures of ATP utilization and recovery in human skeletal muscle. J Physiol 465: 203-222, 1993.
5. Brillault-Salvat C, Giacomini E, Wary C, Peynsaert J, Jouvensal L, Bloch G, and Carlier PG. An interleaved heteronuclear NMRI-NMRS approach to non-invasive investigation of exercising human skeletal muscle. Cell Mol Biol (Noisy-le-grand) 43: 751-762, 1997.
6. Carlier PG, Bloch G, Wary C, Giacomini E, Jehenson P, Leroy-Willig A, and Leclerc JHJ. Quantitation of myoglobin using tissue water reference implications for the determination of muscle intracellular oxygen pressure by in vivo 1H NMR spectroscopy, Proceedings ISMRM, 1994, p. 1251.
7. Chance B, Eleff S, Leigh JS, Jr., Sokolow D, and Sapega A. Mitochondrial regulation of phosphocreatine/inorganic phosphate ratios in exercising human muscle: a gated 31P NMR study.
Proc Natl Acad Sci U S A 78: 6714-6718, 1981.
8. Delitto A, Rose SJ, McKowen JM, Lehman RC, Thomas JA, and Shively RA. Electrical stimulation versus voluntary exercise in strengthening thigh musculature after anterior cruciate ligament surgery. Phys Ther 68: 660-663, 1988.
9. Dennis SC, Gevers W, and Opie LH. Protons in ischemia: where do they come from; where do they go to? J Mol Cell Cardiol 23: 1077-1086, 1991.
10. Draper V, and Ballard L. Electrical stimulation versus electromyographic biofeedback in the recovery of quadriceps femoris muscle function following anterior cruciate ligament surgery. Phys
Ther 71: 455-464, 1991.
11. Duchateau J, De Montigny L, and Hainaut K. Differential effects of training by electrostimulation and by voluntary contractions. Arch Intern Physiol Biochem 96: P11-P12, 1988.
12. Eriksson E, and Haggmark T. Comparison of isometric muscle training and electrical stimulation supplementing isometric muscle training in the recovery after major knee ligament surgery. A preliminary report. Am J Sports Med 7: 169-171, 1979.
13. Frank LR, Wong EC, Haseler LJ, and Buxton RB. Dynamic imaging of perfusion in human skeletal muscle during exercise with arterial spin labeling. Magn Reson Med 42: 258-267, 1999.
14. Giat Y, Mizrahi J, and Levy M. A model of fatigue and recovery in paraplegic's quadriceps muscle subjected to intermittent FES. J Biomech Eng 118: 357-366, 1996.
15. Gutierrez G, and Wulf ME. Lactic acidosis in sepsis: a commentary. Intensive Care Med 22: 6-16, 1996.
16. Hannerz J. Discharge properties of motor units in relation to recruitment order in voluntary contraction. Acta Physiol Scand 91: 374-385, 1974.
17. Henneman E, and Olson CB. Relations between structure and function in the design of skeletal muscle. J. Neurophysiol. 28: 581-598, 1965.
18. Hughson RL, Green HJ, and Sharratt MT. Gas exchange, blood lactate, and plasma catecholamines during incremental exercise in hypoxia and normoxia. J Appl Physiol 79: 1134-1141, 1995.
19. Iotti S, Lodi R, Frassineti C, Zaniol P, and Barbiroli B. In vivo assessment of mitochondrial functionality in human gastrocnemius muscle by 31P MRS. The role of pH in the evaluation of phosphocreatine and inorganic phosphate recoveries from exercise. NMR Biomed 6: 248-253, 1993.
20. Kemp GJ, and Radda GK. Quantitative interpretation of bioenergetic data from 31P and 1H magnetic resonance spectroscopic studies of skeletal muscle: an analytical review. Magn Reson
Quaterly 10: 43-63, 1994.
21. Kent-Braun JA, Miller RG, and Weiner MW. Magnetic resonance spectroscopy studies of human muscle. Radiol Clin North Am 32: 313-335, 1994.
22. Kim CK, Bangsbo J, Strange S, Karpakka J, and Saltin B. Metabolic response and muscle glycogen depletion pattern during prolonged electrically induced dynamic exercise in man. Scand J
Rehabil Med 27: 51-58, 1995.
23. Knaflitz M, Merletti R, and De Luca CJ. Inference of motor unit recruitment order in voluntary and electrically elicited contractions. J Appl Physiol 68: 1657-1667, 1990.
24. Kramer JF, and Mendryk SW. Electrical stimulation as a strenght improvement technique: a review.
J Orth Sports Phys Ther 4: 1657-1667, 1982.
25. Kukulka CG, and Clamann HP. Comparison of the recruitment and discharge properties of motor units in human brachial biceps and adductor pollicis during isometric contractions. Brain Res 219: 45-55, 1981.
26. Lebon V, Carlier PG, Brillault-Salvat C, and Leroy-Willig A. Simultaneous measurement of perfusion and oxygenation changes using a multiple gradient-echo sequence: application to human muscle study. Magn Reson Imaging 16: 721-729, 1998.
27. Lexell J, Henriksson-Larsen K, and Sjostrom M. Distribution of different fibre types in human skeletal muscles. 2. A study of cross-sections of whole m. vastus lateralis. Acta Physiol Scand 117: 115-122, 1983.
28. Matheson GO, McKenzie DC, Gheorghiu D, Ellinger DC, Quinney HA, and Allen PS. 31P NMR of electrically stimulated rectus femoris muscle: an in vivo graded exercise model. Magn Reson Med 26: 60-70, 1992.
29. McCully K, Vanderborne K, Posner JD, and Chance B. Magnetic Resonance spectroscopy of muscle bioenergetics. In: NMR in Physiology, edited by A. P. Inc., 1994, p. 405-412.
30. Mole PA, Chung Y, Tran TK, Sailasuta N, Hurd R, and Jue T. Myoglobin desaturation with exercise intensity in human gastrocnemius muscle. Am J Physiol 277: R173-180, 1999.
31. Moller P, and Sylven C. Myoglobin in human skeletal muscle. Scand J Clin Lab Invest 41: 479-482, 1981.
32. Park JH, Brown RL, Park CR, McCully K, Cohn M, Haselgrove J, and Chance B. Functional pools of oxidative and glycolytic fibers in human muscle observed by 31P magnetic resonance spectroscopy during exercise. Proc Natl Acad Sci U S A 84: 8976-8980, 1987.
33. Ratkevicius A, Mizuno M, Povilonis E, and Quistorff B. Energy metabolism of the gastrocnemius and soleus muscles during isometric voluntary and electrically induced contractions in man. J
Physiol 507: 593-602, 1998.
34. Ratkevicius A, Skurvydas A, Povilonis E, Quistorff B, and Lexell J. Effects of contraction duration on low-frequency fatigue in voluntary and electrically induced exercise of quadriceps muscle in humans. Eur J Appl Physiol Occup Physiol 77: 462-468, 1998.
35. Raynaud JS, Carlier PG, Wary C, Duteil S, Leroy-Willig A, Vaughan T, and Nauerth A. Improved methodology for dynamic studies of muscle oxygen metabolism using 1H/31P imaging/spectroscopy protocols. MAGMA 9, suppl.1: 150, 1999.
36. Raynaud JS, Duteil S, Vaughan JT, Hennel F, Wary C, Leroy-Willig A, and Carlier PG. Determination of skeletal muscle perfusion using arterial spin labeling NMRI: Validation by comparison with venous occlusion plethysmography. Magn Reson Med 46: 305-311, 2001.
37. Richardson RS. What governs skeletal muscle VO2max? New evidence. Med Sci Sports Exerc 32: 100-107, 2000.
38. Richardson RS, Newcomer SC, and Noyszewski EA. Skeletal muscle intracellular PO(2) assessed by myoglobin desaturation: response to graded exercise. J Appl Physiol 91: 2679-2685, 2001. 39. Richardson RS, Noyszewski EA, Kendrick KF, Leigh JS, and Wagner PD. Myoglobin O2
desaturation during exercise. Evidence of limited O2 transport. J Clin Invest 96: 1916-1926, 1995. 40. Ross BD, Radda GK, Gadian DG, Rocker G, Esiri M, and Falconer-Smith J. Examination of a case
of suspected McArdle's syndrome by 31P nuclear magnetic resonance. N Engl J Med 304: 1338-1342, 1981.
41. Schnall MD, Bolinger L, Renshaw PF, Haselgrove JC, Subramanian VH, Eleff SM, Barlow C, Leigh JS, Jr., and Chance B. Multinuclear MR imaging: a technique for combined anatomic and physiologic studies. Radiology 162: 863-866, 1987.
42. Shoemaker JK, and Hughson RL. Adaptation of blood flow during the rest to work transition in humans. Med Sci Sports Exerc 31: 1019-1026, 1999.
43. Sjoholm H, Sahlin K, Edstrom L, and Hultman E. Quantitative estimation of anaerobic and oxidative energy metabolism and contraction characteristics in intact human skeletal muscle in response to electrical stimulation. Clin Physiol 3: 227-239, 1983.
44. Spriet LL, Soderlund K, Bergstrom M, and Hultman E. Skeletal muscle glycogenolysis, glycolysis, and pH during electrical stimulation in men. J Appl Physiol 62: 616-621, 1987.
45. Taylor DJ, Bore PJ, Styles P, Gadian DG, and Radda GK. Bioenergetics of intact human muscle. A 31P nuclear magnetic resonance study. Mol Biol Med 1: 77-94, 1983.
46. Vandenborne K, McCully K, Kakihira H, Prammer M, Bolinger L, Detre JA, De Meirlier K, Walter G, Chance B, and Leigh JS. Metabolic heterogeneity in human calf muscle during maximal exercise.
Proc Natl Acad Sci U S A 88: 5714-5718, 1991.
47. Vanderthommen M, Constant T, and Crielaard JM. Rehabilitation of quadriceps: interest of low frequency electrical stimulation after knee arthroscopy. Kinesither Scient 308, 1992.
48. Vanderthommen M, Depresseux JC, Bauvir P, Degueldre C, Delfiore G, Peters JM, Sluse F, and Crielaard JM. A positron emission tomography study of voluntarily and electrically contracted human quadriceps. Muscle Nerve 20: 505-507, 1997.
49. Vanderthommen M, Depresseux JC, Dauchat L, Degueldre C, Croisier JL, and Crielaard JM. Spatial distribution of blood flow in electrically stimulated human muscle: a positron emission tomography study. Muscle Nerve 23: 482-489, 2000.
50. Vanderthommen M, Gilles R, Carlier P, Ciancabilla F, Zahlan O, Sluse F, and Crielaard JM. Human muscle energetics during voluntary and electrically induced isometric contractions as measured by 31P NMR spectroscopy. Int J Sports Med 20: 279-283, 1999.
51. Wang ZY, Noyszewski EA, and Leigh JS, Jr. In vivo MRS measurement of deoxymyoglobin in human forearms. Magn Reson Med 14: 562-567, 1990.
52. Weiner MW, Moussavi RS, Baker AJ, Boska MD, and Miller RG. Constant relationships between force, phosphate concentration, and pH in muscles with differential fatigability. Neurology 40: 1888-1893, 1990.
53. Wiener DH, Maris J, Chance B, and Wilson JR. Detection of skeletal muscle hypoperfusion during exercise using phosphorus-31 nuclear magnetic resonance spectroscopy. J Am Coll Cardiol 7: 793-799, 1986.
FIGURE LEGENDS
Figure 1: Graphical scheme of experimental conditions during electrical stimulations (ES) and voluntary contractions (VC) in the 46-cm bore magnet. Surface coil (a) and electrodes (b) are positioned on the rectus femoris. ES or VC induce intermittent isometric contractions against a workload (c) positioned outside the magnet via a rope (d) and pulleys (e).
Figure 2: 31P- (panel A) and 1H- (panel B) NMR spectra in rectus femoris muscle of subject 1 during the different steps [10%, 20%, 30%, 40% and 50% of quadriceps maximal isometric voluntary torque (QMIVT)] (5 min) and the following recoveries (5 min) of the voluntary contractions (VC) session. 31P spectra are plotted between 7 and –2 ppm relative to phosphocreatine and peak assignments are indicated for inorganic phosphate (Pi) and phosphocreatine (PCr).
Figure 3: Mean curve (+ SEM) obtained from the individual data during the different steps [10%, 20%, 30%, 40% and 50% of quadriceps maximal isometric voluntary torque (QMIVT)] and the following recoveries (R) of the voluntary contractions session for PCr (panel A), Pi/PCr (panel B), pH (panel C) and deoxymyoglobin (panel D), respectively.
Figure 4: 31P- (panel A) and 1H- (panel B) NMR spectra in rectus femoris muscle of subject 1 during intermittent electrical stimulations (ES) (13 min) and recovery (7 min). Spectra are plotted between 7 and –2 ppm and peak assignments are indicated for inorganic phosphate (Pi) and phosphocreatine (PCr).
Figure 5: Mean (+ SEM) curve obtained during intermittent electrical stimulation (0-780 s) from the individual data for PCr (panel A), Pi/PCr (panel B), pH (panel C) and deoxymyoglobin (panel D), respectively.
Figure 6: Fitted curves obtained with pooled individual data for the pH-[ADP] relationship (panel A) and the PO2-[ADP] relationship (panel B) during voluntary contractions (VC) and electrical stimulations
(ES). In panel A, the x symbols correspond to 3 successive data points collected early into ES, when PCr is rapidly being depleted (phase 1 of exercise) and consequently is buffering pH.
Table 1:
31P/
1H NMR interleaved acquisitions
PCr depletion (%) Pi/PCr pH PO2 (Torr)
Rest 0.06 ± 0.02 b,e 7.03 ± 0.02 b,e
VC-10% 6.4 ± 3.6 b,e 0.13 ± 0.04 b ,e 7.04 ± 0.07 b,e 36.7 ± 16.9 b,e VC-20% 18.6 ± 7.6 b,e 0.26 ± 0.12 b,e 6.98 ± 0.08 b,e 20.2 ± 15.8 b,e VC-30% 41.9 ± 11.0 c 0.66 ± 0.34 6.90 ± 0.09 b,e 6.2 ± 3.4 VC-40% 66.8 ± 6.3 b,c 1.50 ± 0.55 6.83 ± 0.12 a,d 4.9 ± 3.0 VC-50% 85.2 ± 8.9 b,e 6.85 ± 8.61 b,e 6.67 ± 0.10 5.1 ± 3.8 Exhaustion 87.9 ± 9.1 b,e 10.6 ± 11.6 b,e 6.64 ± 0.11 5.5 ± 3.3 ES 5min 39.5 ± 15.9 1.15 ± 0.76 6.70 ± 0.11 10.7 ± 12.2 ES-max 53.7 ± 17.8 1.38 ± 1.14 6.69 ± 0.11 5.7 ± 6.0
Table 1: PCr depletion (in %), Pi/PCr, pH and cellular oxygenation (PO2 in Torr) measured in the rectus femoris at rest, during the voluntary contractions (VC) session and during the electrical stimulations (ES) session. For the VC session, data represent the last min of each step performed against gradual workloads corresponding to different percentages (10%, 20%, 30%, 40% and 50%) of the quadriceps maximal isometric voluntary torque (QMIVT). Exhaustion is defined as the maximum load lifted by the volunteers and was 50% of QMIVT for 5 subjects and 60% of QMIVT for the 3 other subjects. During the ES session, the workload was 10% of QMIVT. The mean values measured during the fifth minute of ES are listed (ES 5min) as well as the greatest changes observed during the ES period (ES-max). Results are given as means ± standard deviation; n = 8; symbols a and b : p<0.01 and < 0.001 vs ES 5min; c, d and e : p< 0.05, <0.01 and <0.001 vs ES-max.
Figure 2.
PCrVoluntary Contractions:
31P_NMRS
Pi Time (min) R R R R R 0 10 20 30 40 50 10% 20% 30% 40% 50%A
Voluntary Contractions:
1H_NMRS
Time (min) R R R R R 0 10 20 30 40 50 10% 20% 30% 40% 50%B
0 20 40 60 80 100 120 0 300 600 900 1200 1500 1800 2100 2400 2700 3000 Time(s) PCr(%)10% R 20% R 30% R 40% R 50% R A 0 2 4 6 8 10 0 300 600 900 1200 1500 1800 2100 2400 2700 3000 Time(s) Pi/PCr 10% R 20% R 30% R 40% R 50% R B 6.5 6.6 6.7 6.8 6.9 7 7.1 7.2 0 300 600 900 1200 1500 1800 2100 2400 2700 3000 Time(s) pH 10% R 20% R 30% R 40% R 50% R C -20 0 20 40 60 80 100 0 300 600 900 1200 1500 1800 2100 2400 2700 3000 Time(s) dMb(%) D 10% R 20% R 30% R 40% R 50% R