HAL Id: halshs-00911364
https://halshs.archives-ouvertes.fr/halshs-00911364
Preprint submitted on 29 Nov 2013
HAL is a multi-disciplinary open access archive for the deposit and dissemination of sci-entific research documents, whether they are pub-lished or not. The documents may come from teaching and research institutions in France or abroad, or from public or private research centers.
L’archive ouverte pluridisciplinaire HAL, est destinée au dépôt et à la diffusion de documents scientifiques de niveau recherche, publiés ou non, émanant des établissements d’enseignement et de recherche français ou étrangers, des laboratoires publics ou privés.
Malaria prevalence, indoor residual spraying, and
insecticide-treated net usage in Sub-Saharan Africa
Gabriel Picone, Robyn Kibler, Bénédicte H. Apouey
To cite this version:
Gabriel Picone, Robyn Kibler, Bénédicte H. Apouey. Malaria prevalence, indoor residual spraying, and insecticide-treated net usage in Sub-Saharan Africa. 2013. �halshs-00911364�
WORKING PAPER N° 2013 –40
Malaria prevalence, indoor residual spraying, and
insecticide-treated net usage in Sub-Saharan Africa
Gabriel Picone Robyn Kibler Bénédicte Apouey
JEL Codes: I12, I15, I18, H4
Keywords: Malaria prevalence elasticity, Indoor residual spraying, Insecticide-treated nets
P
ARIS-
JOURDANS
CIENCESE
CONOMIQUES48, BD JOURDAN – E.N.S. – 75014 PARIS TÉL. : 33(0) 1 43 13 63 00 – FAX : 33 (0) 1 43 13 63 10
www.pse.ens.fr
CENTRE NATIONAL DE LA RECHERCHE SCIENTIFIQUE – ECOLE DES HAUTES ETUDES EN SCIENCES SOCIALES
1
Malaria prevalence, indoor residual spraying, and insecticide-treated net usage
in Sub-Saharan Africa
1Gabriel Picone Department of Economics University of South Florida
Robyn Kibler Department of Economics University of South Florida
Bénédicte Apouey Paris School of Economics -
CNRS
November 2013
Abstract
This paper analyzes the effect of malaria prevalence and indoor residual spraying on the probability of sleeping under an insecticide-treated bed net in nine Sub-Saharan countries. Specifically, it examines whether bed net usage is elastic with respect to malaria prevalence and whether indoor residual spraying, which is a public intervention, crowds out bed net usage, which is a private behavior. Using data on individual bed net usage and household indoor
residual spraying combined with local malaria prevalence, we show that malaria prevalence has a positive effect on bed net usage, but that bed net usage is inelastic with respect to malaria
prevalence, with elasticity ranging from 0.42 for adult women to 0.59 for older children, in our preferred model. We also find that indoor residual spraying does not crowd out bed net usage. Instead, individuals who live in houses that were recently sprayed are more likely to use a bed net.
JEL Classification: I12, I15, I18, H4
Key Words: Malaria prevalence elasticity, Indoor residual spraying, Insecticide-treated nets.
1
Corresponding author: Gabriel Picone, Department of Economics, University of S. Florida, 4202 E. Fowler Ave., CMC207C, Tampa, FL 33620, 813-974-6537, gpicone@usf.edu. We thank Joshua Wilde and participants to the 9th IHEA World Congress for helpful comments. The authors also thank the support of Grant Number R03TW009108 from Fogarty International Center. The content is solely the responsibility of the authors and does not necessarily represent the official views of the Fogarty International Center or the National Institute of Health.
2
1. Introduction
Malaria is a life-threatening disease that is transmitted to people through the bites of infected mosquitoes. Despite the existence of proven strategies to prevent infection, malaria remains one of the major causes of mortality in Sub-Saharan Africa (WHO, 2011). Roll Back Malaria’s Global Malaria Action Plan (GMAP) is the first global plan on how to control and eliminate malaria, containing strategies, costs, goals, and timelines. The primary intervention
recommended by GMAP for Sub-Saharan Africa is that every person at risk sleeps under an insecticide-treated mosquito net (ITN). Sleeping under an ITN is considered the most effective intervention to prevent malaria because the mosquito dies immediately when it comes into contact with the ITN (Lengeler, 2004). This does not only prevent individuals’ infection but also reduces the mosquito population. The second most important malaria control intervention
recommended by GMAP for Sub-Saharan Africa is indoor residual spraying (IRS), which entails spraying the interior of dwellings with an insecticide to kill the mosquitoes that spread the disease. In most cases, GMAP recommends that these two interventions be used together (RBM, 2012).
One of the main contributions of economics to epidemiology is the recognition that individuals adapt their health behaviors rationally in response to changes in the prevalence of an infectious disease like malaria. The “rational epidemics” theory recognizes the interdependence between the infection rate and preventive behaviors which in turn affect the probability of becoming infected (Geoffard and Philipson, 1996; Gersovitz and Hammer, 2003, 2005; Kremer, 1996; Philipson, 2000). A central measure in this theory is the “prevalence elasticity” of the individual demand for prevention, which quantifies the change in individuals’ preventive behaviors caused by a change in the prevalence of the disease. We expect this elasticity to be positive. Malaria will follow different paths, depending on whether ITN usage is elastic or
3
inelastic. If ITN usage is elastic (i.e. the elasticity is greater than one), a decline in malaria prevalence will lead to a greater decrease in ITN usage. Consequently, it will become
progressively more expensive to achieve further decreases in malaria prevalence and the disease may never be eradicated. Alternatively, an inelastic ITN usage (i.e. the elasticity is between zero and one), implies that as malaria risks decline, individuals will reduce their preventive behaviors less than proportionally, allowing for the possibility that ITNs may lead to the eradication of malaria.
In addition to responding to malaria prevalence, individuals may also adapt their ITN usage in response to government interventions. Sleeping under an ITN is an individual behavior that requires active participation of individuals: they must hang and sleep under the net. IRS programs, on the other hand, are public preventive interventions that do not require any active participation of individuals. They are provided free of charge by the national malaria control programs. However, individuals may respond to IRS by reducing their use of ITNs, and this “crowding out” effect may reduce the overall effectiveness of controlling malaria with IRS.
In this study, we empirically estimate the malaria prevalence elasticity of sleeping under an ITN and test whether IRS crowds out ITN usage. Existing literature finds that the there is a positive relationship between malaria prevalence and preventive behaviors (Pattanayak et al., 2006; Berthélemy et al., 2013; Seban et al., 2013), but the evidence is mixed regarding the magnitude of the elasticity.2 There is no agreement on the substitutability between IRS and ITN
2
Pattanayak et al. (2006), using data from the Global Health Atlas, find elasticities between 0.159 (net usage) and
0.520 (net sold). Berthélemy et al. (2013) make a village-level analysis using data for Uganda in 2009. They find that malaria prevalence is positively correlated with the usage of ever treated nets in Ugandan villages. Finally, Seban et al. (2013) use household-level data from the Haut Katanga district in the Democratic Republic of Congo in 2009, merged with malaria prevalence information from the Malaria Atlas Project. They show that bednet ownership is elastic with respect to malaria prevalence.
4
(Chase et al., 2009; Carneiro et al., 2012).3 However, the existing microeconomic evidence on the effects of malaria prevalence and IRS on preventive behaviors is based on relatively small samples with limited variation in malaria prevalence.
We construct a unique dataset by merging data from four sources: (i) recent Demographic and Health Surveys that contain individual-level information on sleeping under an ITN and IRS for nine Sub-Saharan African countries; (ii) malaria prevalence data from the Malaria Atlas Project (MAP); (iii) precipitation and temperature data from the Climatic Research Unit (CRU); and (iv) the Kiszewski et al.’s (2004) index of malaria ecology. Our empirical models address the three sources of potential endogeneity of malaria prevalence and IRS: (i) the omission of important third common hidden factors, such as free bednet distribution campaigns, which are correlated with malaria prevalence and IRS, (ii) reverse causality running from ITN usage to malaria prevalence in the area, and (iii) measurement error in malaria prevalence. We perform our analysis separately for four population groups which may have different responses: children under 5, older children, adult women, and adult men.
Our results show that malaria prevalence has a positive effect on the probability of sleeping under an ITN for all four population groups. However, our study indicates that ITN usage is inelastic with respect to malaria prevalence, with elasticity ranging from 0.42 for adult women to 0.59 for older children in our preferred specification. In addition, we find that IRS does not crowd out ITN usage for any population group. So IRS is not a substitute but a
complement to ITN usage. Thus the parameter estimates of our study imply that malaria can be eradicated or, at least, can be controlled.
3
Chase et al. (2009), using data from a district in Mozambique, find that individuals who received IRS are less
willing to pay for ITNs. Using experimental data from a region in Eritrea, Carneiro et al. (2012) show that receiving IRS increases ITN ownership and usage.
5
The rest of the paper is organized as follows. Section 2 presents a background on malaria. Section 3 outlines the empirical strategy. Section 4 describes the data construction. Section 5 presents the empirical specification. Section 6 discusses the results. Finally, Section 7 contains some concluding remarks.
2. Background on malaria in Africa
Malaria is an infectious disease that is caused by the parasite Plasmodium. It is transmitted when infected blood is passed from one person to the next by the bite of infected mosquitoes belonging to the Anopheles genus.
There are four species of the Plasmodium parasite that cause malaria in humans, but the
Plasmodium falciparum specie is the most common (it is responsible for 98% of malaria
infections) and the most deadly (RBM, 2012). For this reason, in this study, we refer to “malaria episodes” and “malaria prevalence” as those caused by the Plasmodium falciparum parasite.
More than 60 species of Anopheles can transmit malaria. In Sub-Saharan Africa, the
Anopheles gambiae species contain the most important mosquito vectors of malaria and they
play a predominant role in the transmission of Plasmodium falciparum.
People residing in malaria endemic regions slowly acquire immunity to malaria over their childhood years. Children under 3 lack immunity, and they are thus very vulnerable to the
disease. When they are bitten by an infected mosquito, they are almost certain to develop severe malaria episodes which can lead to death in the absence of prompt treatment. By age 10, most infected children suffer at worst mild complications (febrile episodes); and by 15, most
individuals have asymptomatic infections, and the risk of developing even mild complications is very low. Note that women who become pregnant temporarily lose their immunity, which makes them a very vulnerable group together with young children.
6
In areas where malaria is seasonal and exposure to the parasite is infrequent, individuals do not develop clinical immunity, and the risk of severe malaria episodes also pertains to older children and adults (Langhorne et al., 2008; Doolan et al., 2009).
Malaria infections can be controlled using several preventive interventions: sleeping under an ITN, IRS, intermittent preventive treatment during pregnancy, use of mosquito repellants, cleaning drains, and treatment of standing water with larvicidal chemicals. These interventions work by reducing the number of mosquitoes and/or by preventing bites. Anopheles mosquitoes tend to rest in walls and curtains inside a house and they are inclined to bite at night. This makes sleeping under an ITN and IRS highly effective to prevent malaria transmission (RBM, 2012). Thus it is not surprising that the GMAP set a target of universal coverage with ITN and/or IRS for all endemic areas. Universal coverage with ITN is defined as each household owning one ITN per two members and 80% utilization, while universal coverage with IRS implies that all interior walls for every house are periodically sprayed with insecticide (RBM, 2012). Bednets are distributed in Africa through different channels including vouchers, social marketing, free distribution to vulnerable groups in health care facilities or schools, and free mass distribution campaigns (RBM, 2012). IRS, on the other hand, is provided free of charge to selected areas within a country by the national malaria control program.
3. Empirical and identification strategy
Our goal is to identify the effects of malaria prevalence and IRS on the probability of sleeping under an ITN for four different population groups: children under 5, older children, adult
7
respond differently to malaria prevalence and IRS. We assume that the probability of sleeping under an ITN for individual i who lives in cluster c (i.e. neighborhood or village) is given by:
(1) where MalPrc denotes the malaria prevalence in the cluster, IRSic represents whether the house was sprayed with insecticide, and Xic represents a vector of observed exogenous controls that affect ITN usage. These exogenous controls include individual- and cluster-level characteristics. Finally, vic represents unobservable (to us) characteristics at the individual- and cluster-level that also affect ITN usage. We estimate linear probability models and we interpret the coefficients as the average partial effects.4 We expect malaria prevalence to have a positive effect on the probability of sleeping under an ITN. In contrast, the effect of IRS on ITN usage could be positive or negative, depending on whether individuals treat ITN usage and indoor residual spraying as complements or substitutes.
There are three challenges that we need to address in order to identify the effect of malaria prevalence and IRS on the probability of sleeping under an ITN. The first challenge is omitted variable bias caused by malaria campaigns that distribute nets for free. Cohen and Dupas (2010) shows that free net campaigns are the most important determinant of ITN usage. These free net campaigns may be correlated with our main explanatory variables (malaria prevalence and IRS). The second challenge is reverse causation that goes from ITN usage to malaria prevalence, since malaria prevalence in a particular cluster is affected by the ITN usage of the individuals who live in that cluster. The third empirical challenge is measurement error in malaria prevalence. Indeed, our malaria prevalence is not measured with perfect accuracy and is not always equal to the true level of malaria prevalence in the cluster. In our analysis, we use six specifications to address these concerns.
4
8
(1) First, in our baseline specification, we estimate our model controlling for socio-demographic characteristics, precipitation and temperature variables, and survey fixed effects. The socio-demographic variables include gender, age, education (either maternal or individual), household wealth, household size, a dummy for whether the child is the child of the household head, and a dummy for living in an urban cluster. The precipitation and temperature variables are the monthly precipitation and temperature deviations from the mean in the cluster; these
variables indicate whether the precipitation and temperature in the cluster during the month of the interview are above or below normal. While this baseline specification can account for some of the observable differences across individuals and clusters, there still may be unobservable differences in free net campaigns that bias the relationship between malaria prevalence and IRS on the one hand and ITN usage on the other hand.
(2)-(3) In our second and third specifications, we add to the baseline model a control for whether the cluster where the individual lives had a “free net campaign” and a control for the number of nets per children under 5 or per person in the household. These specifications address the potential omitted variable bias caused by malaria campaigns.
(4) In our fourth specification, we include past ITN usage as a control. This lagged ITN usage is aimed at minimizing reverse causality. However, this approach may not be sufficient and in our last two specifications we use instrumental variables to control for reverse causality and measurement error in malaria prevalence.
(5) In our fifth specification, we use two instruments for malaria prevalence. Our first instrument is the malaria ecology index developed by Kiszewski et al. (2004). It has been widely used as an instrument for malaria prevalence (see Pattanayak et al., 2006; Bleakley, 2010; Lucas,
9
2010; among others). This index is calculated from the biological characteristics of the dominant
Anopheles vectors as well as climate.
Our second instrument is a predicted malaria prevalence variable which captures the component of malaria prevalence that does not depend on human malaria preventive behavior. This predicted cluster malaria prevalence is based on a regression of malaria prevalence on cluster altitude, precipitation, and temperature data, using a very flexible functional form. Precipitation, temperature, and altitude have already been used as instruments for malaria prevalence in several studies, including Berthélemy et al. (2013), Bleakley (2010), and Seban et al. (2013), although not as a generated instrument. A concern about using instruments based on precipitation and temperature is that they may have a direct impact on the probability of sleeping under an ITN, e.g. the person does not sleep under a net because it is too hot. To address this concern, we always include a control for the precipitation and temperature in the cluster at the time of the interview in our specifications (more precisely, we control for the month of the interview precipitation and temperature deviations from the annual mean). Our instrument (the predicted cluster malaria prevalence) depends on the cluster altitude, average monthly maximum precipitation and temperature, and average monthly minimum precipitation and temperature. We believe that once we control for the precipitation and temperature deviations from the annual means, the cluster altitude, average monthly maximum and minimum precipitation and
temperature will affect the decision of sleeping under an ITN during the month of the interview only through their impact on malaria prevalence.
(6) Finally, in our last specification, we estimate our model using only Kiszewski et al. (2004)’s malaria ecology index as an instrument for malaria prevalence. In our opinion this index is the best available instrument for malaria prevalence, because individuals’ malaria preventive
10
behaviors will not affect which Anopheles vector is dominant in the area and will also have no effect on the climate. Furthermore, one of the reasons the authors created this index was for use as an instrument for malaria endemicity when studying the effects of malaria on poverty, where some of the endogeneity concerns are similar to our study.5 If our identification assumptions are valid, the results of specifications (5) and (6) should be similar.
4. Data construction
Our data come from four different sources. First, we use individual- and household-level
information from the MEASURE Demographic and Health Surveys project. Second, we collect information on malaria prevalence from the Malaria Atlas Project. Third, we use precipitation and temperature data from the Climatic Research Unit at the University of East Anglia. Finally, we use the Kiszewski et al.’s (2004) index of malaria ecology.
4.1. The MEASURE Demographic and Health Surveys project
All the individual- and household-level information on ITN usage, net ownership, IRS, and socio-demographic characteristics come from the project of the Monitoring and Evaluation to Assess and Use Results Demographic and Health Surveys (MEASURE DHS). Within this project, we use data from the Standard Demographic Health Surveys (DHS), the Malaria Indicator Surveys (MIS), and the AIDS Indicator Surveys (AIS). The standard DHS contain detailed information on health and preventive health behaviors for children, women, and men.
5A related measure to Kiszewski’s malaria ecology index that is well known in the epidemiological literature is the PfR0, which is the basic reproductive number for malaria for a naïve population (Gething et al. 2011). PfR0 would be
an ideal instrument for malaria prevalence; unfortunately, estimates of PfR0 are not available. We have information
on PfRc, which is the basic reproductive number for malaria under control. PfRc is calculated as a nonlinear transformation of our measure of malaria prevalence, and therefore would suffer the same endogeneity issues.
11
MIS and AIS use the same basic questionnaire as the standard DHS, but have more detailed questions about malaria or AIDS and do not include all the modules of the standard DHS. Another notable difference between DHS and MIS is that the MIS is conducted during the months of the year when the risk of malaria is the highest. For certain surveys, DHS/MIS/AIS have additional information on public malaria control interventions such as whether the house was sprayed with insecticide and whether the household received a free mosquito net.
DHS/MIS/AIS samples are nationally representative of the population, but they are drawn from geographical clusters. Clusters vary in size and population but typically contain around 500 individuals. In rural areas a cluster is usually a village, and in urban areas it is approximately a city block.
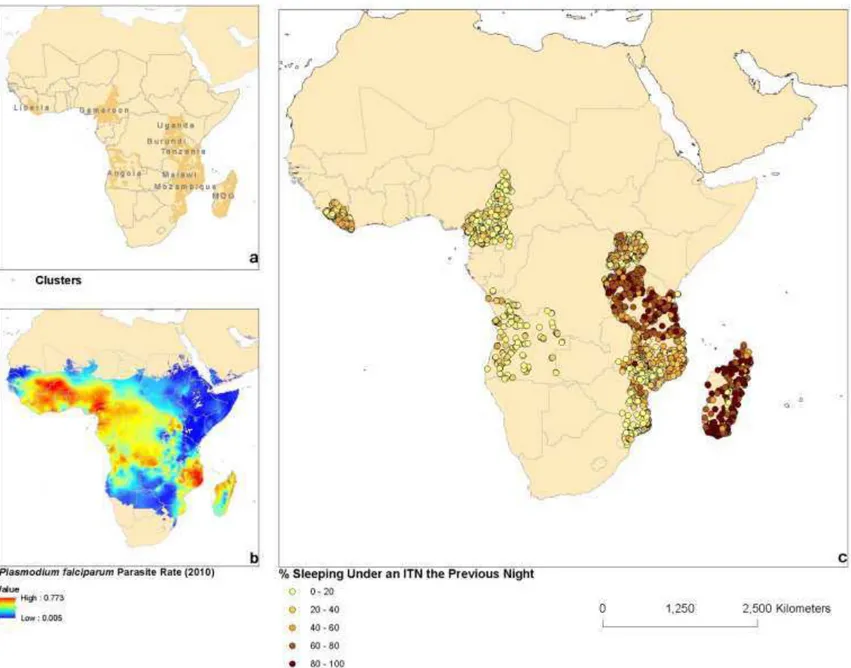
We restrict our analysis sample to DHS/MIS/AIS surveys for Sub-Saharan Africa that were conducted in 2011 and 2012, that contain information on indoor residual spraying, and for which the latitude, longitude, and altitude of the centroid of the clusters is available. Our final sample includes Angola (MIS 2011), Burundi (MIS 2012), Cameroon (DHS 2011), Liberia (MIS 2011), Madagascar (MIS 2011), Malawi (MIS 2012), Mozambique (DHS 2011), Tanzania (AIS 2011-12), and Uganda (DHS 2011). The locations of the countries and clusters of interest are shown in Figure 1a.
[Insert Figure 1 here]
4.1. Malaria prevalence and the Malaria Atlas Project
Our measure of malaria prevalence is the percentage of individuals infected with the
12
Information on PfPR for each cluster was obtained from the Malaria Atlas Project (MAP) available at www.map.ox.ac.uk.
MAP contains a number of maps and geographical data related to the spatial distribution of malaria. The best malaria prevalence data currently available at MAP is PfPR2-10 for 2010.
PfPR2-10 captures the percentage of children between the ages of 2 to 10 that have detectable
levels of the Plasmodium falciparum parasite using peripheral blood.6 PfPR2-10 is constructed
from parasite surveys that are periodically carried out in areas known to have malaria. Then, using Bayesian geostatistical algorithms with adjustments for climatic and environmental factors, MAP made projections in time and space to create a continuous display of PfPR, called the Malaria Endemicity map, for all of Africa in 2010. Hay et al. (2009) and Gething et al. (2011) provide details on the construction of PfPR2-10.
We incorporate information on PfPR2-10 with our DHS/MIS/AIS data, using the latitude
and longitude of the clusters. Note that we restrict our DHS/MIS/AIS data to the surveys conducted in 2011 and 2012, i.e. after the measurement of malaria prevalence in 2010, to mitigate reverse causation running from ITN usage to malaria prevalence.
Figure 1b shows that malaria is highly endemic in Africa, but that there is a wide variation in the malaria prevalence rate, which ranges from less than 5% to over 75%. Areas where PfPR is less than 5% must be treated with caution since malaria transmission is likely to be seasonal in these areas and universal coverage using ITNs may not be cost effective (Hay et al., 2009). For these reasons, we also restrict our analysis to areas where malaria is endemic and
13
PfPR is greater than 5%. Overall, these restrictions leave us with 261,907 individuals, 2,854 clusters, and nine countries.7
Figure 1c shows that there is great amount of variation in ITN usage within and among countries. Also it appears to suggest that ITN usage may not be positively correlated with malaria prevalence. Indeed, ITN usage and malaria prevalence are negatively correlated and only after we control for country fixed effects we see a positive correlation with malaria prevalence.
4.3. The Climatic research unit data
Using the latitude and longitude of the centroid of each cluster, we also merge the DHS/MIS/AIS clusters with the precipitation and temperature data from 2000 to 2010 based on weather station observations and interpolations from the Climatic Research Unit (CRU), available at
www.cru.uea.ac.uk.
4.4. Kiszewski et al. (2004) malaria ecology index
Finally, we merge the DHS/MIS/AIS data with the Kiszewski et al. (2004) malaria ecology index. Recognizing that the risk of malaria transmission is a function of not only climatic
variables but also the biological characteristics of the dominant mosquito vector, Kiszewski et al. (2004) constructed an index of malarial ecology (transmission stability) for 2004. This index is
7 In previous versions of this study we used samples with a larger number of countries and our results were
consistent with those reported in this version. However, because the surveys were conducted prior to 2011 or they did not have information on IRS or ITN ownership, these countries were dropped from our sample.
14
calculated using data about the human blood index for each dominant Anopheles vector and their daily survival rate as well as data on climate. This index is based on the characteristics of the
Anopheles mosquito that is dominant, regardless if it carries a malaria parasite or not, and it is
available at http://www.earth.columbia.edu.
5. Empirical specification
We estimate equation (1) for four different groups separately: children under 5, older children (ages 5-14), adult women (ages 15-49), and adult men (ages 15-49).
Dependent variable: A binary indicating whether the individual slept under an ITN the previous night. We use this dependent variable in all specifications. We do not distinguish between long-lasting insecticidal nets (LLINs), a relatively new technology, and regular ITNs that need to be re-impregnated every 6 months (RBM, 2012), since for some surveys we cannot distinguish between these two types of nets.
Explanatory variables: Our main explanatory variables are the PfPR for 2010 in the cluster where the individual lives (malaria prevalence) and a dummy for whether the inside walls of the house where the individual lives were sprayed with insecticide during the past 12 months (IRS).
Our socio-demographic controls include age, age of the mother (for children under 5 and older children), a dummy for being male (for children under 5 and older children), household size, dummies for being a child of the household head (for children under 5 and older children), for an urban area, for whether the mother completed primary education (for children under 5 and
15
older children), for whether the individual completed primary education (for adults), and for whether the individual lives in a household with the lowest wealth level. The latter variable is a dummy for whether the household has none of these items: an improved water source, improved sanitation facilities, and electricity.8
Our specifications also include controls for country fixed effects, precipitation and temperature. The precipitation (respectively temperature) variable captures the difference between the month of the interview precipitation (respectively temperature) and the average precipitation (respectively temperature), in the cluster. These differences were calculated as follows: we begin by taking the average precipitation (respectively temperature) for each cluster in each month from 2000-2010. We then take the average over all months to get the average precipitation (respectively temperature) for a cluster. The difference is just the month of the interview average precipitation (respectively temperature) minus the average precipitation (respectively temperature) for each cluster.
In some specifications we include a binary to indicate whether there was a “free net campaign” in the area. We approximate this variable by creating a dummy which equals one if over 80% of households in the cluster received a free ITN in the past two years. The data do not contain direct information on ITNs distribution campaigns, but we know whether the household received an ITN for free. If a large share of the households in a cluster received a free ITN during the last two years, it is likely that there was some form of mass campaign in that area.
In specification (3), we include the number of nets per children under 5 in the household (for children under 5) and the number of nets per person in the household (for older children,
8 Following the World Bank, we define an improved water source as any of the following sources: piped water into
dwelling, piped water to yard/plot, public tap or standpipe, tubewell or borehole, protected dug well, protected spring, and bottled water. Improved sanitation facilities are defined as a flush toilet, a piped sewer system, septic tank, a flush/pour flush pit latrine, a ventilated improved pit latrine (VIP), a pit latrine with slab, or a composting toilet.
16
adult women, adult men) to control availability of nets in the household. Finally, specification (4) includes past ITN usage in the region as one of our explanatory variables.9
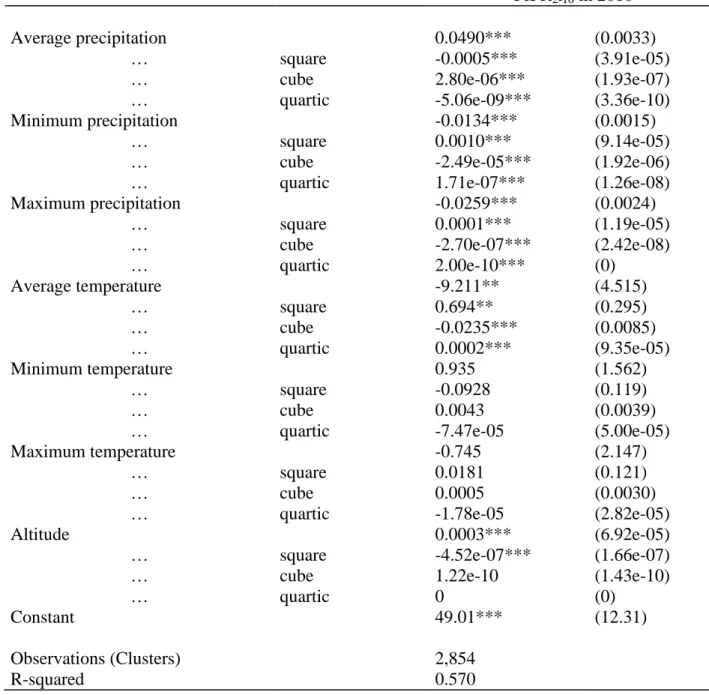
Instrumental variables: Our instruments are first the Kiszewski et al.’s malaria ecology index and second an exogenous predicted PfPR index.10 We calculate the latter index using the average temperature for a cluster described above. We then find the average max temperature -- we find the month with the highest average temperature in the cluster for each year and then average over all the years. Using the same procedure, we find the average minimum temperature. We then repeat the exact same process to find the average, minimum, and maximum levels of
precipitation for each cluster. We then take the squares, cubes, and quartics of each of the six climate variables as well as of cluster altitude, leaving us with 28 climate-altitude variables to use to explain malaria prevalence at the cluster level in a very rich, highly non-linear fashion.
We then regress malaria prevalence (PfPR in 2010) on our 28 climate-altitude variables. The fit of the resulting prediction, with an R² of 0.57, is very high (See Appendix A). Our instrument is the prediction of prevalence from this regression. It captures the variation in malaria prevalence explained by climatic factors and altitude.
6. Results
Table 1 presents the summary statistics for the four population groups: children under 5, older children, adult men, and adult women.
9
Ideally we would like to measure previous ITN usage for the same cluster. Unfortunately, DHS does not survey the same cluster over time.
10 MAP also provides data on two other potential instruments for malaria prevalence, HbS and G6PD. These are
both blood disorders that provide protection against malaria. We also estimate our model using HbS (the percentage of neonates affected by sickle haemoglobin) as an additional instrument. The estimates are similar to our preferred specification, but we do not pass the overidentification test. Because HbS is correlated with malaria immunity, it is plausible that HbS affects the probability of sleeping under an ITN directly. These results are available upon request.
17
[Insert Table 1 here]
Children under 5, who are the most vulnerable group, are the most likely to sleep under an ITN. Indeed, 44.7% of young children slept under an ITN the previous night, versus 44.5% of women, 33.9% of older children, and 33.2% of men.
Mean malaria prevalence (PfPR in 2010) ranges from 33.81 to 35.46. Approximately 17% of the individuals had their dwellings sprayed with an insecticide (IRS) in the year
preceding the interview, while around 39% of them live in a household that received a free ITN in the two years preceding the interview. Accordingly, there is nearly one (0.859) net available per child under 5 in each household. For older children and adults, on average, there is
approximately 0.261 net per person.
Table 2 summarizes the results for our six specifications for children under 5 and older children, while Table 3 outlines the results for adults.
[Insert Table 2 and 3 here]
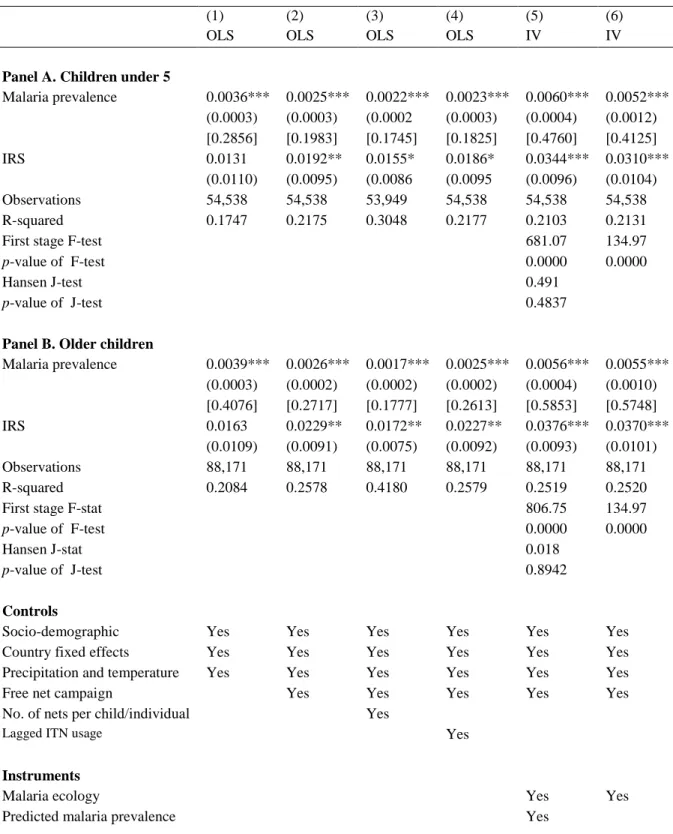
The effect of malaria prevalence on the probability of sleeping under an ITN is
consistently positive and significant for all population groups and for all of the specifications. For children under 5, a percentage-point increase in the local malaria prevalence is associated with an increase in the probability of sleeping under an ITN of 0.0036 when the basic controls are included (column 1). When we add the control for free net campaigns, the effect decreases, as expected, to 0.0025, but remains positive and significant (column 2). Even if we hold the number of nets owned by the household constant, higher malaria prevalence increases the probability of sleeping under an ITN by 0.0022 (column 3). Controlling for lagged ITN usage in the region does not appear to affect the effect that malaria prevalence has on the probability of
18
sleeping under an ITN (column 4). Finally, once we use instrumental variables to address reverse causality and measurement error in column (5), the effect of a percentage increase in malaria prevalence increases to 0.0060 with an associated malaria prevalence elasticity of 0.4760. In column (6) we only use the Kiszewski malaria ecology index as an instrument and the results are very similar (0.0052 for the average partial effect and 0.4125 for the malaria prevalence
elasticity) but the standard errors are higher than in column (5). We find a similar pattern for older children, adult women, and adult men. The malaria prevalence elasticities are always well below unity with a highest value of 0.5853 for older children.11
Like any study that uses instrumental variables, the strength of our results in Tables 2 and 3, columns (5) and (6), crucially depends on the quality of our instruments. Tables 2 and 3 report the first stage F-tests for weak instruments, for columns (5) and (6), and the Hansen J-test of overidentification restrictions, for column (5). The instruments perform very well using these two tests for all four population groups. First, the instruments are not weak, since the first stage F-stats reported in columns (5) and (6) are large and always exceed 10. Second, we cannot reject the hypothesis that one of the instruments is exogenous, using the Hansen-J test in column (5).
The effect of IRS on the probability of sleeping under an ITN is always positive and significant. This indicates that IRS does not crowd out sleeping under an ITN. So IRS and ITN usage are not substitutes but complements. The average partial effects of IRS in our preferred specification in column (5) range from 0.0252 (for adult women) to 0.0376 (for older children).
Finally, in Table 4 we report the full results for each of the six specifications for children under 5 for illustrative purposes (results for older children and adults are available upon request).
11
Malaria prevalence elasticities are calculated using the average partial effect of malaria prevalence, the average ITN usage, and the average malaria prevalence. They should be interpreted as the average elasticities.
19
[Insert Table 4 here]
For most explanatory variables, the estimated effects are plausible. For example, free net campaigns (+) are an important determinant of the probability of sleeping under an ITN.
Children who live in households with more nets are more likely to use an ITN. Precipitations above normal levels have a positive effect on ITN usage, while temperatures above normal levels have a negative effect on ITN usage. Most socio-demographic characteristics have also expected signs: age (-), child of household head (+), mother’s completed primary education (+), lowest wealth level (-), household size (-), and urban (+).
7. Conclusion
Consistent with the rational epidemic theory, individuals in Sub-Saharan Africa who live in areas (clusters) with higher rates of malaria prevalence are more likely to sleep under an ITN
compared to individuals who live in areas with lower infection rates. These results hold for our four population groups (for children under 5, older children, adult women, and adult men) and they are robust to several model specifications that address the potential endogeneity of malaria prevalence. However, we find that the malaria prevalence elasticity is always less than one, ranging from 0.4179 for adult women to 0.5853 for older children. In addition, we do not find that IRS “crowds out” sleeping under an ITN for any of the population groups. In contrast, our results suggest that households consider IRS and ITN usage to be complements.
One of the limitations of our study is that we estimate a static model using cross-sectional data, whereas a dynamic model with longitudinal data would more accurately estimate the actual changes in malaria prevalence and ITN usage over time. Unfortunately, there is no available longitudinal data on malaria prevalence for the number of countries we study.
20
Overall, the parameters estimated in this study help to fill the vacuum in the models of the economic epidemiological literature where researchers are forced to make assumptions about key parameters without any solid empirical evidence (Gersovitz and Hammer, 2003, 2005). Our findings on the positive but inelastic malaria prevalence of ITN usage and on the
complementarity between ITN usage and IRS should increase our confidence that malaria can be controlled following the current recommendations of GMAP.
21
References
Angrist, J & Pischke, JS. (2009). Mostly harmless econometrics: an empiriricist’s companion. Princeton University Press.
Berthélemy, J.C., Thuilliez, J., Doumbo, O., & Gaudant, J. (2013). Malaria and protective behaviors: is there a malaria trap? Malaria Journal, 12, 200.
Bleakley H. (2010). Malaria eradication in the Americas: a retrospective analysis of childhood exposure. American Economic Journal: Applied Economics, 2, 1-45.
Carneiro P., Ghebremeskel T., Keating J., & Locatelli A. (2012). Do Public Health Interventions Crowd Out Private Health Investments? Malaria Control Policies in Eritrea. Cemmap working paper CWP12/12.
Chase, C., Sicuri E., Sacoor C., Nhalungo D., Nhacolo A., Alonso P.L., & Menéndez C. (2009). Determinants of household demand for bed nets in a rural area of Southern Mozambique.
Malaria Journal, 8, 132.
Cohen, J., & Dupas, P. (2010). Free distribution or cost-sharing? Evidence from a randomized malaria prevention experiment. Quarterly Journal of Economics, 125, 1-45.
Doolan, D. L., Dobano, C., & Baird, J. K. (2009). Acquired immunity to malaria. Clinical
Microbiology Reviews, 22, 13-36.
Geoffard, P.-Y., & Philipson, T. (1996). Rational epidemics and their public control.
International Economic Review, 37, 603–624.
Gersovitz, M., & Hammer, J. S. (2003). Infectious diseases, public policy, and the marriage of economics and epidemiology. World Bank Research Observer, 18, 129-157.
Gersovitz, M., & Hammer, J. S. (2005). Tax/subsidy policies toward vector-borne infectious diseases. Journal of Public Economics, 89, 647-674.
Gething, P. W., Patil, A., Smith, D., Guerra, C., Elyazar, I., Johnston, G., Tatem, A., & Hay, S. (2011). A new world malaria map: Plasmodium falciparum endemicity in 2010. Malaria
Journal, 10, 378.
Hay, S., Guerra, C., Gething, P., Patil, A., Tatem, A., Noor, A., Kabaria, C., Manh, B., Elyazar, I., Brooker, S., Smith, D., Moyeed, R., & Snow, R. (2009). A world malaria map: Plasmodium falciparum endemicity in 2007. PLoS Medicine, 6, 286-302.
Kremer, M. (1996). Integrating behavioral choice into epidemiological models of AIDS.
22
Kiszewski, A., Mellinger, A., Spielman, A., Malaney, P., Sachs, S., &Sachs, J. (2004). A global index representing the stability of malaria transmission. American Journal of Tropical Medicine
and Hygiene, 70, 486-498.
Langhorne, J., Ndungu, F. M., Sponaas, A. M., & Marsh, K. (2008). Immunity to malaria: more questions than answers. Nature Immunology, 9, 725-732.
Lengeler, C. (2004). Insecticide-treated bed nets and curtains for preventing malaria. Cochrane
Database of Systematic Reviews, 2, 1-55.
Lucas A. (2010). Malaria eradication and educational attainment: evidence from Paraguay and Sri Lanka. American Economic Journal: Applied Economics, 2, 46-71.
Pattanayak, S., Poulos, C., Jones, K., Yang, J., & Van Houtven, G. (2006). Economics of
Environmental Epidemiology. RTI Working Paper 06_04.
Philipson, T. (2000). Economic epidemiology and infectious diseases. In: A. J. Culyer, & J. P. Newhouse (Eds.), Handbook of Health Economics (pp. 1761-1799). Elsevier.
Roll Back Malaria (2012). The Global Malaria Action Plan. Available at: www.rollbackmalaria.org/gmap. Accessed November 8, 2013.
Seban, J., Thuilliez, J., & Herbreteau, V. (forthcoming). Possession of bed nets in Haut-Katanga (DRC): prevalence elastic behavior or performance of health care system delivery? Health &
Place.
World Health Organization (2011). World malaria report 2011. Geneva: World Health Organization. Available at:
http://www.who.int/malaria/world_malaria_report_2011/9789241564403_eng.pdf. Accessed November 8, 2013.
23
Table 1. Descriptive statistics
Children under 5 Older children Adult women Adult men Dependent variable
Sleeping under an ITN 0.447 0.339 0.445 0.332
the previous night (0.497) (0.473) (0.497) (0.471)
Explanatory variables
Malaria prevalence 35.46 35.43 33.81 35.34
(Cluster) (15.26) (15.49) (15.63) (15.45)
IRS 0.168 0.179 0.169 0.166
(Household) (0.374) (0.383) (0.375) (0.372)
Free net campaign 0.388 0.398 0.439 0.340
(Cluster) (0.487) (0.489) (0.496) (0.474)
No. of nets per child under 5 0.859 - - -
(Household) (0.932)
No. of nets per individual - 0.240 0.290 0.253
(Household) (0.232) (0.284) (0.280)
Lagged ITN usage 22.47 22.61 23.83 19.78
(Region) (18.58) (18.53) (19.48) (17.41)
Precipitation and temperature (monthly deviations)
Precipitation 8.55 6.48 10.74 2.752 (Cluster) (66.17) (66.81) (68.22) (67.81) Temperature -0.042 -0.111 -0.039 -0.082 (Cluster) (1.643) (1.685) (1.647) (1.682) Socio-demographic characteristics Male 0.498 0.498 - - (0.500) (0.500) Age 2.003 9.237 28.02 28.24 (1.421) (2.827) (9.396) (9.633)
Child of the household head 0.747 0.726 - -
(0.434) (0.446)
Woman completed primary education - - 0.777 -
(0.416)
Mother’s age 25.25 - - -
(11.29)
Mother completed primary education 0.610 - - -
(0.487)
Lowest wealth level 0.343 0.321 0.288 0.265
(Household) (0.475) (0.467) (0.452) (0.441)
Household size 6.753 7.198 6.405 6.034
24 Urban 0.271 0.288 0.353 0.398 (0.444) (0.453) (0.478) (0.489) Instruments Malaria ecology 7.892 7.923 7.867 7.832 (Cluster) (6.131) (6.242) (6.317) (6.437)
Predicted malaria prevalence 35.22 34.99 34.41 35.66
(Cluster) (11.80) (11.93) (12.16) (12.09)
Clusters 2,854 2,854 2,854 2,827
Observations 54,538 88,171 69,929 55,069
Note: ITN is insecticide-treated net. Malaria prevalence is PfPR2-10 for 2010, IRS (indoor residual spraying) is a binary indicating whether the house was sprayed for mosquitos during the last 12 month, free-net-campaign is a binary indicating whether over 80% of the households received a free ITN during the past two years, precipitation (temperature) difference is the month of the interview precipitation (temperature) minus the average, malaria ecology is the Kiszewski et al.’s malaria ecology index, and predicted malaria prevalence is the predicted PfPR2-10 for 2010 based on Appendix A.
25
Table 2. Effects on sleeping under an ITN the previous night, for children
(1) (2) (3) (4) (5) (6)
OLS OLS OLS OLS IV IV
Panel A. Children under 5
Malaria prevalence 0.0036*** 0.0025*** 0.0022*** 0.0023*** 0.0060*** 0.0052*** (0.0003) (0.0003) (0.0002 (0.0003) (0.0004) (0.0012) [0.2856] [0.1983] [0.1745] [0.1825] [0.4760] [0.4125] IRS 0.0131 0.0192** 0.0155* 0.0186* 0.0344*** 0.0310*** (0.0110) (0.0095) (0.0086 (0.0095 (0.0096) (0.0104) Observations 54,538 54,538 53,949 54,538 54,538 54,538 R-squared 0.1747 0.2175 0.3048 0.2177 0.2103 0.2131
First stage F-test 681.07 134.97
p-value of F-test 0.0000 0.0000
Hansen J-test 0.491
p-value of J-test 0.4837
Panel B. Older children
Malaria prevalence 0.0039*** 0.0026*** 0.0017*** 0.0025*** 0.0056*** 0.0055*** (0.0003) (0.0002) (0.0002) (0.0002) (0.0004) (0.0010) [0.4076] [0.2717] [0.1777] [0.2613] [0.5853] [0.5748] IRS 0.0163 0.0229** 0.0172** 0.0227** 0.0376*** 0.0370*** (0.0109) (0.0091) (0.0075) (0.0092) (0.0093) (0.0101) Observations 88,171 88,171 88,171 88,171 88,171 88,171 R-squared 0.2084 0.2578 0.4180 0.2579 0.2519 0.2520
First stage F-stat 806.75 134.97
p-value of F-test 0.0000 0.0000
Hansen J-stat 0.018
p-value of J-test 0.8942
Controls
Socio-demographic Yes Yes Yes Yes Yes Yes
Country fixed effects Yes Yes Yes Yes Yes Yes
Precipitation and temperature Yes Yes Yes Yes Yes Yes
Free net campaign Yes Yes Yes Yes Yes
No. of nets per child/individual Yes
Lagged ITN usage Yes
Instruments
Malaria ecology Yes Yes
Predicted malaria prevalence Yes
For the IV models, the reported R-squared is the centered R-squared.
Robust standard errors in parentheses clustered at the geographical cluster. Average malaria prevalence elasticities in brackets. *** p<0.01, ** p<0.05, * p<0.1
26
Table 3. Effects on sleeping under an ITN the previous night, for adults
(1) (2) (3) (4) (5) (6)
OLS OLS OLS OLS IV IV
Panel A. Adult women
Malaria prevalence 0.0038*** 0.0026*** 0.0020*** 0.0025*** 0.0055*** 0.0043*** (0.0001) (0.0001) (0.0002) (0.0001) (0.0004) (0.0010) [0.2887] [0.1975] [0.1520] [0.1899] [0.4179] [0.3267] IRS 0.0080 0.0126*** 0.0114* 0.0121** 0.0252*** 0.0198*** (0.0049) (0.0048) (0.0069) (0.0048) (0.0081) (0.0089) Observations 69,929 69,929 69,929 69,929 69,929 69,929 2,858 2,858 2,858 2,858 2,858 2,858 R-squared 0.1664 0.2087 0.3274 0.2089 0.2036 0.2071
First stage F-stat 769.07 100.57
p-value of the F-test 0.0000 0.0000
Hansen J-stat 1.683
p-value of the J-test 0.1945
Panel B. Adult men
Malaria prevalence 0.0039*** 0.0024*** 0.0017*** 0.0022*** 0.0054*** 0.0044*** (0.0001) (0.0001) (0.0002) (0.0001) (0.0004) (0.0009) [0.4151] [0.2555] [0.1810] [0.2342] [0.5748] [0.4684] IRS 0.0096* 0.0164*** 0.0070 0.0182*** 0.0338*** 0.0278*** (0.0055) (0.0054) (0.0073) (0.0054) (0.0088) (0.0096) Observations 55,069 55,069 55,069 55,069 55,069 55,069 R-squared 0.1256 0.1715 0.3309 0.1721 0.1660 0.1692
First stage F-stat 796.13 179.40
p-value of the F-test 0.0000 0.0000
Hansen J-stat 1.586
p-value of the J-test 0.2078
Controls
Socio-demographic Yes Yes Yes Yes Yes Yes
Country fixed effects Yes Yes Yes Yes Yes Yes
Precipitation and temperature Yes Yes Yes Yes Yes Yes
Free net campaign Yes Yes Yes Yes Yes
No. of nets per child/individual Yes
Lagged ITN usage Yes
Instruments
Malaria ecology Yes Yes
Predicted prevalence Yes
Robust standard errors in parentheses clustered at the geographical cluster. Average malaria prevalence elasticities in brackets. *** p<0.01, ** p<0.05, * p<0.1
27
Table 4. Effects on sleeping under an ITN the previous night for children under 5 (all effects)
(1) (2) (3) (4) (5) (6)
OLS OLS OLS OLS IV IV
Malaria prevalence 0.0036*** 0.0025*** 0.0022*** 0.0023*** 0.0060*** 0.0052***
(0.0003) (0.0003) (0.0002) (0.0003) (0.0004) (0.0012)
IRS 0.0132 0.0193** 0.0156* 0.0187* 0.0345*** 0.0311***
(0.0111) (0.0095) (0.0086) (0.0095) (0.0096) (0.0105)
Free net campaign 0.282*** 0.166*** 0.281*** 0.268*** 0.271***
(0.0118) (0.0111) (0.0116) (0.0117) (0.0123)
Number of nets per child under 5 0.182***
(0.0043)
Lagged ITN usage 0.0008**
(0.0004) Precipitation and temperature deviations
(monthldeviations)
Precipitation 0.0001** 0.0001* 3.80e-05 0.0001** 0.0002*** 0.0001***
(7.23e-05) (6.42e-05) (5.75e-05) (6.45e-05) (6.57e-05) (7.04e-05)
Temperature -0.0018 -0.0033 -0.0055** -0.0028 -0.0038 -0.0037 (0.0031) (0.0026) (0.0025) (0.0026) (0.0026) (0.0026) Socio-demographic characteristics Male 0.0022 0.0020 0.0007 0.00193 0.0013 0.0014 (0.0038) (0.0037) (0.0035) (0.0037) (0.0037) (0.0037) Age -0.0229*** -0.0227*** -0.0223*** -0.0227*** -0.0225*** -0.0225*** (0.0013) (0.0013) (0.0012) (0.0013) (0.0013) (0.0013)
Child of household head 0.0728*** 0.0654*** 0.0983*** 0.0654*** 0.0654*** 0.0654***
(0.0069) (0.0066) (0.0064) (0.0065) (0.0066) (0.0066)
Mother’s age -0.0002 -2.49e-05
-0.0025***
3.06e-06 -0.0001 -0.0001 (0.0004) (0.0003) (0.0003) (0.0003) (0.0003) (0.0003) Mother completed primary education 0.0452*** 0.0463*** 0.0226*** 0.0471*** 0.0427*** 0.0435***
(0.0072) (0.0066) (0.0061) (0.00667) (0.0068) (0.0069)
Lowest wealth level -0.0128 -0.0104 0.0063 -0.0111 -0.0197** -0.0176**
(0.0082) (0.0074) (0.0068) (0.0074) (0.0077) (0.0082) Household size -0.0102*** -0.0110*** -0.0075*** -0.0111*** -0.0106*** -0.0107*** (0.0008) (0.0008) (0.0008) (0.0008) (0.0008) (0.0008) Urban 0.0724*** 0.0482*** 0.0109 0.0476*** 0.0772*** 0.0707*** (0.0103) (0.00859) (0.0079) (0.0085) (0.0094) (0.0133)
Country fixed effects Yes Yes Yes Yes Yes Yes
Instruments
Malaria ecology Yes Yes
Predicted prevalence Yes
Observations 54,538 54,538 53,949 54,538 54,538 54,538 R-squared 0.175 0.217 0.305 0.218 0.210 0.213 First-stage F-stat 681.07 134.97 p-value of F-test 0.0000 0.0000 Hansen J-test 0.491 p-value of J-test 0.4837
Notes. For the IV models, the reported R-squared is the centered R-squared.
28
Appendix A
Table A.1. First-stage regression
PfPR2-10 in 2010
Average precipitation 0.0490*** (0.0033) … square -0.0005*** (3.91e-05)
… cube 2.80e-06*** (1.93e-07)
… quartic -5.06e-09*** (3.36e-10) Minimum precipitation -0.0134*** (0.0015)
… square 0.0010*** (9.14e-05)
… cube -2.49e-05*** (1.92e-06) … quartic 1.71e-07*** (1.26e-08) Maximum precipitation -0.0259*** (0.0024)
… square 0.0001*** (1.19e-05)
… cube -2.70e-07*** (2.42e-08)
… quartic 2.00e-10*** (0) Average temperature -9.211** (4.515) … square 0.694** (0.295) … cube -0.0235*** (0.0085) … quartic 0.0002*** (9.35e-05) Minimum temperature 0.935 (1.562) … square -0.0928 (0.119) … cube 0.0043 (0.0039)
… quartic -7.47e-05 (5.00e-05)
Maximum temperature -0.745 (2.147)
… square 0.0181 (0.121)
… cube 0.0005 (0.0030)
… quartic -1.78e-05 (2.82e-05)
Altitude 0.0003*** (6.92e-05)
… square -4.52e-07*** (1.66e-07)
… cube 1.22e-10 (1.43e-10)
… quartic 0 (0)
Constant 49.01*** (12.31)
Observations (Clusters) 2,854
R-squared 0.570
Notes. For the precipitation variables, we begin by taking the average temperature for each cluster in each month between 2001 and 2010.
“Average precipitation” represents the average over all months and years.
We then find the month with the smallest average precipitation in the cluster for each year. “Minimum precipitation” represents
the average of these values over all the years.
We finally find the month with the highest average precipitation in the cluster for each year. “Maximum precipitation” represents the average of these values over all the years.
We use the exact same methods to get the temperature variables. Robust standard errors in parentheses. *** p<0.01, ** p<0.05, * p<0.1
29