© 2015 E. Schweizerbart’sche Verlagsbuchhandlung, Stuttgart, Germany www.schweizerbart.de
Recent decline of roach Rutilus rutilus stock in a
large river ecosystem in relation with its population
dynamics
William Otjacques
1,*, Adrien Latli
1, Benoît Bernard
1, Michaël Ovidio
2,
Eric Depiereux
1and Patrick Kestemont
1,*
With 3 figures and 6 tables
Abstract: Studies dealing with quantitative decline of freshwater fish species with long-time series data are rather scarce and primarily limited to migratory species. We present an original work integrating over two decades investi-gations on roach (Rutilus rutilus L.) stock, one of the dominant cyprinid fish species in the River Meuse (Belgium). This study aimed to quantify changes in the stock of roach after recent indicators (captures from sport fishermen) suggested a sharp decline. Three methods were used: capture-mark-recapture (CMR) estimation, catch per unit of effort by gillnetting (CPUE) and long-term monitoring of fish-passes. Population dynamics of roach was also in-vestigated. CMR method demonstrated a decrease of 91 % of the roach stock compared to earlier data (1993 – 2003), with current densities close to 300 roach ha–1. This was also confirmed by a decrease of 95 % in CPUEs and a
decrease between 93 and 98 % in two fish-passes during the same period. On the other hand, growth and mortality did not indicate radical changes before and after the decline was found. As roach stock decline is generalizable to the whole Belgian’s Meuse following estimations in two other sites, further investigations are needed to explain the reasons underlying this decline in order to take conservation measures. First, the uptake of primary production (i.e. phytoplankton) by invasive clams is supposed. And secondly, an increase in predation pressure by the Great Cormorant is effective as this avian predator was found in high densities from 2000 until 2006.
Key words: catch per unit of effort; fish pass; gillnet, large river; mark-recapture model; roach decline.
Introduction
Understanding changes affecting community structure
and ecosystem functioning is one of the main
chal-lenges of modern ecology (Poff et al. 1997).
Compila-tion of large datasets, involving time series
observa-tions, is extremely useful to relate observed changes to
disturbances of an ecosystem (Daufresne et al. 2003).
Estimates of fish stocks dynamics are frequently
used to evaluate ecological interactions in aquatic
communities. These estimates are also important
in fisheries management to control exploitation of a
stock to avoid its collapse in a near future (Peltonen
et al. 1999). Results of fish stock assessment should
be of sufficient quality. In fisheries management,
se-rious errors have been made following inaccuracy in
stock assessment. The exactness of an estimate with
a particular method is rarely known (Bailey 1984).
Although contradictory estimates can be made by
dif-ferent assessment methods (Schnute & Hilborn 1993),
conclusions are more secure if different methods give
coherent estimates (Foote & Stefansson 1993). To
highlight abundance and structure of a particular
spe-cies population is a real challenge, mainly in large
riv-Authors’ addresses:
1 Research Unit in Environmental and Evolutionary Biology, University of Namur, 61 Rue de Bruxelles, 5000 Namur, Belgium 2 Laboratory of Fish Demography and Hydroecology, University of Liège, 22 Quai E. Van Beneden, 4020 Liège, Belgium
* Corresponding authors; [email protected]; [email protected]
ers. All sampling techniques are biased to some degree
when estimates of abundance, richness or distribution
are needed (Olin et al. 2009). Stock evaluations rely
on active capture of fish such as electrofishing or
pas-sive capture of fish such as gillnetting (Murphy &
Wil-lis 1996; Goffaux et al. 2005), but these methods have
their own limits. Gillnetting is size selective (Hamley
1975), tends to underestimate young individuals of a
given species or species being more sedentary
(Ru-lifson 1991). Size selectivity can be reduced by
us-ing gillnets with different mesh sizes (Goffaux et al.
2005). Electrofishing is widely considered as efficient
for describing population structure but is not
appropri-ate for large and deep rivers (Pusey et al. 1998).
More-over electrofishing efficiency is influenced by
physi-cal and chemiphysi-cal parameters, swimming capacities of
fish (Casselman et al. 1990) and response to electric
field may vary between species and size class (Pusey
et al. 1998). In large rivers, combination of these two
techniques allows both sampling of the main channel
and of the banks (Goffaux et al. 2005).
Mark-recapture method first developed by
Pe-tersen (1896) is an alternative to the removal method
(Thompson et al. 1998) and the most used technique
for stock estimates in inland water (Gatz & Loar 1988;
Donkers et al. 2011). The assumptions of this model
are a closed population, random distribution and same
catch probability between mark and unmarked
indi-viduals of the same species (White et al. 1982) and
no mark loss. The mark-recapture model is generally
used for abundance estimates in small (Gresswell et al.
1997) to large lakes (Donkers et al. 2011; Dahm et al.
1992). This model is more appropriate for low capture
efficiency or low stock (Laurent & Lamarque 1975).
Since the pioneer work of Petersen, several models
based on mark-recapture have been developed (Begon
1979).
Catches per unit of effort (CPUE), instead of
giv-ing estimate densities, offer a view on proportional
changes which occurred in an exploited fish
popula-tion. Comparison of CPUE information and stock
den-sity assessment is more useful if changes occur in fish
population can be detected by both methods (Peltonen
et al. 1999).
In addition, monitoring of fish passes enables data
collection on population dynamics taking into
ac-count the migratory part of the fish populations. The
most common monitoring method is to catch fish in
a trap disposed within or at the outflows of the pass
(Larinier 1998). When performed during consecutive
years, monitoring of fish pass is an efficient tool to
quantify changes in fish population in a river such as
a decline of a particular species (Mallen-Cooper &
Brand 2007).
Roach Rutilus rutilus (L., 1758) is one of the most
commonly and widely distributed fish in European
rivers (Kottelat & Freyhof 2007) but is also
consid-ered as a potential pest where it has been introduced
and became the dominant species. In these
environ-ments, its high abundance creates concern for the
other species present (Giannetto et al. 2014). Native
in Belgium, roach stock in the River Meuse has been
investigated by mark-recapture using the Jackson
method in 1993, in order to evaluate the need of a fish
restocking programme to support a roach population
subject to capture by sport fishermen. Its density was
estimated at 3695 roach ha
–1(Didier & Micha 1996).
Based on this stock assessment, it was decided to stop
the roach restocking programme in different reaches
of the River Meuse. The study was repeated 7 years
later from 2000 to 2002 and the density was estimated
between 3035 and 3145 roach ha
–1indicating a
sta-ble roach population in the River Meuse despite the
absence of restocking (Evrard & Micha 2003). The
restocking programme was definitively abandoned.
However, since these studies, according to indirect
in-dicators (captures from sport fishermen), roach stock
was decreasing.
This study aimed to quantify roach stock using
three different methods (estimation by
mark-recap-ture, catch per unit effort and fish pass monitoring)
over the last decade in the River Meuse (Belgium).
Results between different sites and years are presented
and compared with previous investigations in the same
area. The assessment methods were also confronted to
secure conclusion about the importance of the decline.
Growth and mortality parameters were also
inves-tigated to check if changes in population abundance
have impacted vital population parameters.
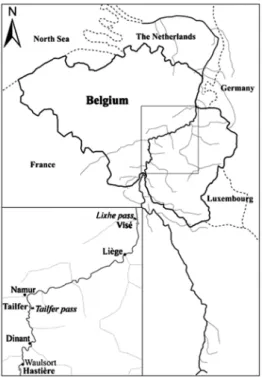
Study area
The River Meuse is 905 km long and its total catchment area is 34584 km² (Descy et al. 2009). The river rises in Eastern France and flows throughout Belgium and The Netherlands be-fore meeting the Lower Rhine and forming the Dutch delta. It debouches in the North Sea (Fig. 1) (Descy 1987). The average slope of the River Meuse is 0.23 ‰ (Micha & Pilette 1988). The River Meuse is a regulated river but management has been conducted with few considerations for aquatic fauna. As a re-sult, plant and animal biodiversity has decreased (Descy et al. 2009). In Belgium, the river looks like a bream zone (deep wa-ter and slow current) according to Huet zonation (Huet 1949) as a consequence of heavily canalisation during the last 150 years. Naturally, the river in Belgium is a barbel zone characterised by a greater current and a lower depth (Micha & Pilette 1988).
Fif-teen dams have been built on its course in Belgium which allow shipping of 1350 tons upstream Namur (Tans 2000) and 9000 tons downstream Namur but disturb flow rate, migration of fish species and natural zonation patterns (Micha & Pilette 1988). Natural banks are relatively rare as a result of canalisation. Over the past three decades, water temperature has increased by 0.16 – 0.89 °C and discharge tends to increase. Eutrophication is widespread with organic pollution high in some parts of the river (Descy et al. 2009). In addition, invasive species, mostly macroinvertebrates, are present and widespread (Descy et al. 2009). During the study period at Tailfer (Belgium, 518 km from source), chlorophyll-a and zooplankton have decreased drastically, presumably in response to invasive molluscs spread (Corbicula, Dreissena polymorpha, Dreissena rostriformis) (Pigneur et al. 2014). Extinction coefficient, inversely related to phytoplankton biomass, has increased. Soluble reactive phosphate presents a slight decrease. Nitrate and ammonium, temperature and discharge remain in the same range (Table 1) (Pigneur et al. 2014). In the Belgian’s section of the River Meuse, 29 fish species were found during sampling by gillnet-ting and electrofishing from 1996 to 2012 (Table 2) with roach being the most abundant (Goffaux et al. 2005).
The present study was carried on three reaches in Belgium: Hastière, Tailfer and Visé located 488, 518 and 611 km respec-tively from the source (Fig. 1). The reach of Tailfer was previ-ously studied by Didier & Micha (1996) and Evrard & Micha (2003).
Material and methods
Fish sampling
Estimates of roach stocks in the three sites have been based on the protocol (see below) described in Didier & Micha (1996) and applied in the study of Evrard & Micha (2003). Before es-Fig. 1. Location of the River Meuse basin with the three
sam-pling sites (bold names) and the two fish passes monitored.
Table 1.Annual means of debit, temperature, suspended matter, nitrates and orthophosphates at Tailfer during the studied period.
Years 1993 2000 2001 2002 2010 2011 Debit (m3 s–1) 171 239 224 143 167 146 Temperature (°C) 11 12.8 12.9 14.5 13.1 13.8 Suspended matter (mg l–1) 18 25 20 27.2 12.2 12.8 Nitrates (mg l–1) 2.6 2.7 2.6 2.5 2.7 2.9 Orthophosphates (mg l–1) 0.06 0.05 0.04 0.03 0.05 0.05
Table 2.Species list found in the River Meuse during sampling
Species English name
Abramis brama Bream
Alburnus alburnus Bleak
Alburnus bipunctatus Stream bleak
Anguilla anguilla Eel
Aspius aspius Asp
Barbatula barbatula Stone loach
Barbus barbus Barbel
Blicca bjoerkna Silver bream
Carassius carassius Crucian carp
Chondrostoma nasus Nase
Cottus gobio Bullhead
Cyprinus carpio Carp
Esox lucius Pike
Gasterosteus aculeatus Three-spined stickleback
Gobio gobio Gudgeon
Gymnocephalus cernuus Ruffe
Lepomis gibbosus Pumpkinseed
Leuciscus idus Ide
Leuciscus leuciscus Dace
Perca fluviatilis Perch
Phoxinus phoxinus Minnow
Rhodeux sericeus Bitterling
Rutilus rutilus Roach
Salmo trutta fario Trout
Sander lucioperca Pikeperch
Scardinius erythrophtalmus Rudd
Silurus glanis European catfish
Squalus cephalus Chub
timations, roach grown in captivity (Total length: 101–190 mm) in a fish farm were marked by clipping off the half right pelvic fin and restocked homogeneously immediately after marking.
The option to mark roach grown in fish farm for the mark-recapture operations is due to several reasons: i) there were no other possibilities to catch and mark a large number of fish in a short period of time (one day); ii) the most efficient technique of roach capture in large rivers is gillnet, but this method is invasive and largely affects the survival rate of captured fish (Didier & Micha 1996).
For restocking, marked roach stock were divided in several small tanks (500 –1000 roach) placed at 200 – 300 m intervals along the banks. In the reach of Tailfer, 10,100 marked roach were stocked in 2010 and 10,000 in 2011. In the reaches of Hastière and Visé, 7,500 and 8,500 marked roach were stocked in 2012. In the reach of Tailfer, restocking was done at the end of March and sampling was conducted between April and Mai. In 2012, restocking and sampling were done in November.
To meet general assumptions of mark-recapture models, marking and recapture periods must be short (Krebs 1999 in Donkers et al. 2011). In the present study, samplings were com-pleted within 4 days on each reach, less than a week after re-stocking of marked roach. This short period of time reduces the risk of method violations due to emigration and immigration. It’s assumed that neither growth nor recruitment occurred dur-ing the sampldur-ing period (Ricker 1975). The closed population assumption appears to be met by dams delimiting each reach. Further, estimates have been conducted out of the reproductive period in order to avoid upstream migration of roach through fish passes. The assumptions of zero mark loss were addressed by fin clipping and correct reporting of mark by the use of three observers. Fin clipping was chosen for its facility and rapidity of marking and because of non-regeneration possible during the short period of sampling. Short period of time between marking and sampling should have reduced the probability of unequal mortality among unmarked and marked roach (Gresswell et al. 1997). Survival after marking was verified by maintaining in a tank placed in the River Meuse 30 marked and 30 unmarked roach for one month in 1993. No difference in survival rate was observed suggesting that marking didn’t affect roach survival (Didier & Micha 1996). We assumed an equal capture probabil-ity between marked and unmarked fish of the same size.
In 2010, 11 samples by gillnetting and 10 samples by elec-trofishing were done in the reach of Tailfer. In 2011, 12 samples by gillnetting and 8 by electrofishing were taken. In the reach of Hastière, 13 samples (5 by gillnetting and 5 by boat electrofish-ing) were collected in 2012. In the reach of Visé, 7 samples by gillnetting and only 3 by electrofishing were done because of low availability of bank less than 2 m deep.
Gillnetting was performed with a set of 3 to 6 gillnets (length: 50 m; height: 2 m) with different mesh sizes (20, 30 and 40 mm knot to knot). Gillnet 20 mm was preferred to other gill-nets because its ability to catch fish of the size class restocked. Two to four gillnets were used per set. Gillnet 30 mm was used as an intermediate gillnet with one to two gillnets in the set. Gillnet 40 mm was used to a lesser extent (one gillnet per set). Samples were taken at different locations along reaches. Loca-tion selecLoca-tion was done randomly. Gillnets were exposed in the main channel for 2 to 6 h during daytime. This large difference is due to the high abundance of fish caught in gillnets. During the first 2 h of capture by gillnet, an electrofishing was carried out along shallow banks (< 2 m) by boat (Zodiac®, 4.2 m long) in an upstream direction over a distance of 200 – 800 m. All type
of habitat found in the reaches were investigated proportionally to their abundance. The generator consists in a 3 KW alterna-tor delivering a continuous current (300 V at 4 A, DEKA 7000). The cathode was floating on the rear side of the boat. Three per-sons were used, one boat driver, one dip netter and one hand-held anode. After sampling, fishes were identified. Roach were measured to the nearest mm (Total Length, TL) and weighted to the nearest g individually. Identification as marked or un-marked roach was done by three persons for a correct reporting of marks.
Stocks estimates
Estimates have been investigated with the Jackson’s positive method (1) (Jackson 1939). With this method, marking occurs on one occasion followed by multiple recaptures events (Begon 1979):
(1) where
N0 = total population estimated on day 0
q0 = marked proportion of a hypothetical random sample taken
on day 0
r0 = number of individuals marked and released on day 0
Methods for estimating q0 and confidence intervals of N0
are from Begon (1979).
Estimations of N0 were done with number of roach
un-marked with size comprised between minimum and maximum size of roach marked. The total population was estimated by adding to N0 a proportional estimate of roach outside of
mini-mum and maximini-mum size class defined by marked roach. Estimate of total biomass B (kg) is calculated by the for-mula (2) using N0 (1) and its confidence limits determined
fol-lowing method of Begon (1979):
(2)
where = Average weight (kg)
Estimates of density (roach ha–1) and biomass (kg ha–1) per
hectare are calculated by dividing estimates of total population and its total biomass by the surface of each reach.
Capture per unit of effort by gillnet
In addition to stock estimates, stocks dynamics was also inves-tigated with gillnet catches per unit of effort (CPUE) performed during stock evaluation. Even if CPUE is not an absolute es-timate of density, it can show proportional changes in stocks (Peltonen et al. 1999). Data from gillnets with mesh size 20 and 30 mm were used following sufficient data. CPUEs are reported in number of fish caught per net per 30 min of fishing effort.
Because of unequal size samples and variance heteroge-neity, we used Welch’s Test F ratio (Welch 1951) to compare CPUEs. Multiple Welch paired-tests were performed to test significant differences between years in CPUEs with the same mesh size. Analysis of year samples will reinforce our confi-dence in changes revealed by mark-recapture estimates. Cor-rections for multiple paired-tests following the sequentially rejective multiple test procedure developed by Holm (1979). Comparisons with the same conclusion were grouped for facil-ity and the F value, degrees of freedom and probabilities given referred to the highest statically (p < 0.05) significant difference observed. 0 0 0 r N =q B N P= ∗ P
Fish pass analysis
In order to use different methods to reveal and quantify roach stock, two fish passes were monitored, at Tailfer dam on the Middle Meuse and at Lixhe dam on the Lower Meuse. At Tail-fer pass, fish were captured by trap at the following years: 1989 to 1994, 2006 and 2009 to 2011. This fish pass was monitored from March until December in 1989 to 1994 and from March until September in 2006 and 2009 – 2011. Fourteen pools com-posed the fish pass (1.95 × 1.50 × 0.75 m) each dropping in el-evation by 0.13 – 0.15 m. Discharge at the outlet is closed to 0.24 m3 s–1 and water velocity over the traverse is about 0.9 m
s–1 (Prignon et al. 1998). The only trap was placed in the upper
pool of the pass and had a cone at the entrance and a steel grid (1 cm wide between bars) at the exit. All fish were counted ex-cept young of the year and common bleak (Alburnus alburnus L.) because of high abundance during the nineties. During mi-gration peaks (April–June), fish were collected daily. Outside migration period, the trap was checked twice a week.
Lixhe dam has two fish passes. The first was put into opera-tion in 1980 and the second in 1998. Monitoring was done from January until June. The older is a pool and weir pass of 48 m length composed of 56 pools (1.5 × 0.9 × 0.4 m) with 2 cones trap at the upper pool. The new one is a pool and vertical slot pass of 305 m length composed of 26 pools (1.4 × 1.1 × 1.5 m) with a cage at the upper pool. The mean discharges were 0.135 and 1.0 m3 s–1 respectively. The older fish pass was monitored
from 1992 to 2012, except years 1994 and 1996 and the new one from 1998 to 2012. Both old and new fish passes were moni-tored at least twice a week and all fish were counted except young of the year.
Roach abundance was expressed as catch in number per month. For each year, we divided fish abundance by the period of sampling (in month). At Tailfer pass, we compared the two periods of monitoring ranging from 1989 to 1994 (6 years) and from 2006 and 2009 to 2011 (4 years). As no great gap existed in the monitoring of the Lixhe pass, periods were determined to correspond closer to the periods of the Tailfer pass. More, data were ordered to check if chronology and decreasing were concordant. Periods compared were one before year 2000 (7 years), a second period from 2001– 2006 (6 years) and a third period from 2007– 2012 (6 years). Following high variance het-erogeneity and unequal samples size, we used Welch’s Test F ratio to compare CPUEs. Corrections for multiple paired-tests following the sequentially rejective multiple test procedure de-veloped by Holm (1979).
Dynamics of roach populations
Age and growth rate were read from scales (Mann 1973). Be-tween 3 and 10 scales were collected from 56 specimens caught in each reach. Scales were taken above the lateral line up the dorsal fin. After removing mucus, scales were placed between 2 microscope slides (®VWR). Annual radii were determined as the point where circuli became closely spaced followed by areas of widely spaced circuli. Annual radii were recorded only when structures could be viewed around the circumference of the scale (Cragg-Hine & Jones 1969). Age reading was car-ried out independently by two persons. After age accordance, measures of radii (to the nearest mm) were carried out on the posterior field using a binocular. Total length at different ages was back-calculated using the Lee (1920) formula based on measures of radii.
(3)
where
Lt = back-calculated fish body length at age t
a = intercept from the regression of body length on mean scale
length
Ln = fish body length at capture
Rt = mean scale length at annulus t
Rn = mean scale total length at capture
Growth was described by the Von Bertalanffy growth curve (VBGC) model (Von Bertalanffy 1938) described by the equa-tion (4):
(4) where
Lt = Total length at age t
L∞ = Asymptotic length or Maximal size
K = Growth coefficient
t0 = Hypothetical age when length equal 0
The method of Ford-Walford was used to determine as-ymptotic length L∞ which correspond to the intercept of the
right x = y and the regression of body length at time t +1 and body length at time t. Growth coefficient K and theoretical age
t0 were determined using the Von Bertalanffy method (Sparre &
Venema 1996). We used Excel software to construct the VBGC model.
The index Ø’ of growth performance (Pauly & Munro 1984, Sparre & Venema 1996, Naddafi et al. 2005) calculated by for-mula (5) was employed in order to compare growth between years and sites:
(5) The instantaneous rate of total mortality Z was estimated using length-converted age catch curve using the equation of Von Bertalanffy and by reporting age on the X-axis and natu-ral logarithm of number of individuals by cohort on the Y-axis. Cohorts under-estimated following a low sampling effort due to gears used were rejected for this analysis. The regression is equal to (6):
(6)
Total mortality Z is equal to -b (Ricker 1975; Pauly 1997). Instantaneous rate of natural mortality M was estimated us-ing the empirical equation of Pauly (Pauly 1980) (7):
(7) where L∞ and K are from the VBGC (5)
T = Mean annual water temperature (°C)
Instantaneous rate of fishing mortality F was calculated as the difference between instantaneous rates of total and natural mortality (8) (Sparre & Venema 1996):
(8) The ratio of instantaneous rate of fishing and total mortality was calculated to estimate exploitation E (9) (Sparre & Venema 1996): (9) ( ) t t n n R L a L a R = + − ∗ 0 ( ) (1 K t t ) t L L e− ∗ − ∞ = ∗ − ’ ln( ) 2 ln( ) Ø = K + ∗ L∞ ln( )Nt = + ∗a b t log (M) = −0,006 − 0,279 * log(L∞) + 0,6543 * log(K) + 0,4634 * log(T) F Z M= − E F M=
Results
Density estimates
In the reach of Tailfer, 761 unmarked roach were
caught by electrofishing and gillnet in 2010 and 303 in
2011. In 2010, 222 marked roach were caught
(Recap-ture rate of 2.2 %) and 104 in 2011 (Recap(Recap-ture rate of
1.04 %). Gillnet catches represented for this site 49 %
of the captures. A total of 462 unmarked roach were
caught in the reach of Visé in 2012. Gillnet catches
represented 99.8 % of the captures. On 8500 marked
roach, 71 have been recaptured during the sampling
period. Recapture rate was 0.84 %. On the reach of
Hastière, a total of 241 unmarked roach were caught,
mostly by gillnet sampling (97 %). Recapture rate was
3.75 % with a total of 281 marked roach caught. Most
of the recaptures in this site were due to electrofishing
(62 %) along the banks. Lengths of roach caught by
electrofishing were relatively constant between 1993
and 2002. For years 2010 – 2012, size class length was
reduced following low capture. Lengths of fish caught
by gillnetting were constant along the two decades
re-flecting the selectivity of this method (Table 3).
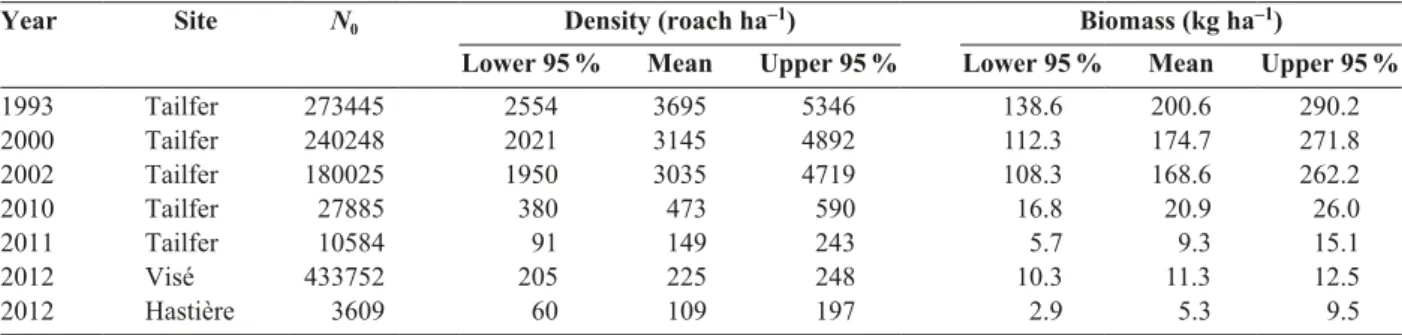
Between 1993 and 2002, estimates by Jackson
method reveal a steady stock of roach. According to
this method, roach stock was estimated between 3695
[2554 – 5346] and 3035 [1950 – 4719] roach ha
–1(Ta-ble 4). Moreover, CPUEs obtained between 1993 and
2002 from gillnets with mesh size of 20 and 30 mm did
not show any significant differences during that period
(Fig. 2). In 2010 and 2011, roach stock has undergone
a strong decrease in less than 10 years with estimated
densities around 300 roach ha
–1. Even if no
histori-cal data exists for the reaches of Hastière and Visé,
roach stocks appeared close to the results obtained in
the reach of Tailfer between 2010 and 2011. Density is
estimated at 225 [205 – 248] roach ha
–1in Visé and 109
[60 –197] roach ha
–1in Hastière.
Gillnet surveys
Total lengths of roach caught by 20 mm mesh size
gillnets ranged between 101 and 250 mm. For gillnet
30 mm, total lengths of roach ranged between 121 and
340 mm (Table 2). Values and confidence intervals
(95 %) of CPUEs are shown in Figure 2. CPUEs for
2010 were not used because fishing time was not
re-ported. CPUEs obtained in 2011 and 2012 on both sites
were not significantly different (F
Welch(1,19) = 2.28;
p > 0.147 for gillnet of 20 mm and F
Welch(1,21) = 63.47;
p > 0.625 for gillnet 30 mm). On the other hand CPUEs
Table 3.Date, site, area, recapture rate and minimum and maximum total length of roach restocked, caught by sampling methods and for stock estimations.
Year Site Area (ha) Recapture
rate (%) Restocking Electrofishing Gillnet20 mm Gillnet30 mm estimationsStock
1993 Tailfer 76.4 1.73 111– 260 51– 270 131– 230 171– 310 51– 310 2000 Tailfer 76.4 2.16 81– 190 81– 300 141– 250 171– 320 81– 370 2001 Tailfer 76.4 0.65 101– 220 71– 360 121– 250 121– 310 71– 340 2002 Tailfer 76.4 1.31 91– 250 71– 360 121– 250 121– 310 71– 370 2010 Tailfer 76.4 2.20 81– 190 151– 160 101– 240 121– 340 81– 340 2011 Tailfer 76.4 1.04 111– 240 71– 180 101– 240 151– 300 71– 320 2012 Visé 230.0 0.84 81– 180 141– 150 111– 240 191– 300 81– 330 2012 Hastière 45.8 3.75 81– 180 61– 160 131– 220 201– 280 61– 340
Table 4.Jackson estimates and resulted density and biomass obtained. Data from 1993 and 2000 – 2002 are reworked from Didier & Micha (1996) and Evrard & Micha (2003). N0, roach stock estimation (roach comprised between minimum and maximum length
of marked roach). Density and biomass include also estimation of roach outside length class defined by marked roach.
Year Site N0 Density (roach ha–1) Biomass (kg ha–1)
Lower 95 % Mean Upper 95 % Lower 95 % Mean Upper 95 %
1993 Tailfer 273445 2554 3695 5346 138.6 200.6 290.2 2000 Tailfer 240248 2021 3145 4892 112.3 174.7 271.8 2002 Tailfer 180025 1950 3035 4719 108.3 168.6 262.2 2010 Tailfer 27885 380 473 590 16.8 20.9 26.0 2011 Tailfer 10584 91 149 243 5.7 9.3 15.1 2012 Visé 433752 205 225 248 10.3 11.3 12.5 2012 Hastière 3609 60 109 197 2.9 5.3 9.5
in 2011 and 2012 for gillnets with mesh size of 20 mm
significantly lower from those calculated for 2000
and 2002 (F
Welch(1,23) = 16.56; p < 0.008) but were not
significantly lower for CPUEs from 1993 and 2001
(F
Welch(1,6) = 17.72; p > 0.084) after correction with
se-quentially rejective Bonferroni test and following the
high variability for these years. CPUEs in 2011 and
2012 for gillnets of 30 mm were highly different from
2000, 2001 and 2002 (F
Welch(1,15) = 17,61; p < 0.0008)
but not significantly from 1993 (F
Welch(1,6) = 5,44;
p > 0.06). CPUEs values for gillnets of 20 mm did not
significantly differ between years 1993, 2000, 2001
and 2002 (F
Welch(1,19) = 0.48; p > 0.494). Captures with
gillnets of 30 mm were similar when comparing the
years 1993, 2000, 2001 and 2002 (F
Welch(1,18) = 4.27;
p > 0.05) (Fig. 2).
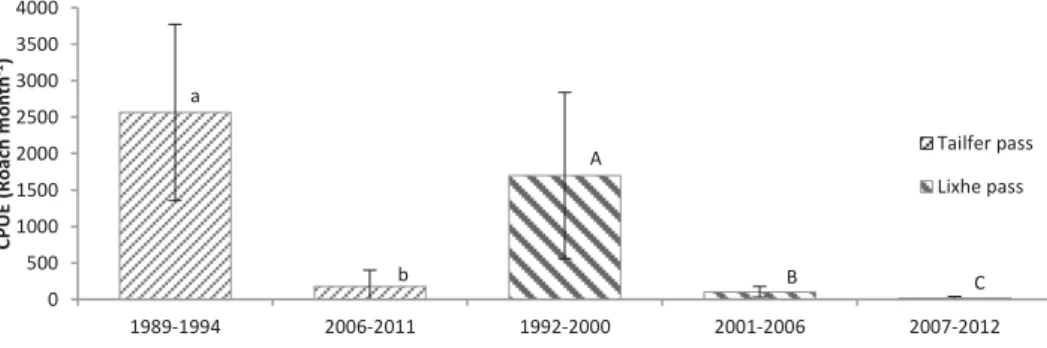
Fish pass analysis
From 1989 to 1994, a mean of 2565 roach per month
were captured at Tailfer pass. During last years (2006,
2009 – 2011), we noticed on average 179 roach per
month (Fig. 3). Comparison of the two periods
indi-cates a highly significant decrease in the number of
roach passing through the pass (F
Welch(1,5) = 25.20;
p = 0.004). Between these periods, we noticed a
de-crease of 93 % in roach passages. At Lixhe pass,
dur-ing the first period (1992 – 2000), on average 1699
roach were counted per month, 103 during the second
period (2001– 2006) and only 19 during the third one
(2007– 2012) (Fig. 3). Comparison of the three
peri-ods reveals a significant decrease (F
Welch(1,6) = 11.70;
p < 0.014) of 94 % between the first two periods, 81 %
0 5 10 15 20 25 30 35 40 45
TAI 1993 TAI 2000 TAI 2001 TAI 2002 TAI 2011 HAS 2012 VIS 2012
CP U E Gi lln et (N um be r o f r oa ch/ ne t/ 30 m in) Gillnet 20 mm Gillnet 30 mm AB ab B a AB a B a A b A b A b
Fig. 2. CPUE for gillnet 20 and 30 mm obtained in the reaches of Tailfer (TAI), Hastière (HAS) and Visé (VIS), errors bars: 95 % interval of confidence around estimated mean values based on specified number of observation per group represented by each bar. Items with the same letter (uppercase for gillnet with mesh size of 20 mm, lowercase for 30 mm) are not significantly different. Data from 1993 and 2000 – 2002 are reworked from Didier & Micha (1996) and Evrard & Micha (2003).
0 500 1000 1500 2000 2500 3000 3500 4000 1989-1994 2006-2011 1992-2000 2001-2006 2007-2012 CP U E (R oa ch m on th -1) Tailfer pass Lixhe pass A B a b C
Fig. 3. Evolution of the catch per unit effort (Roach month–1) at the Tailfer and Lixhe passes, errors bars: 95 % interval of
confi-dence around estimated mean values based on specified number of observations (year) per group represented by each bar. Items with the same letter (lowercase for Tailfer, uppercase for Lixhe) are not significantly different
between the last two periods and 98 % between the
first and last periods.
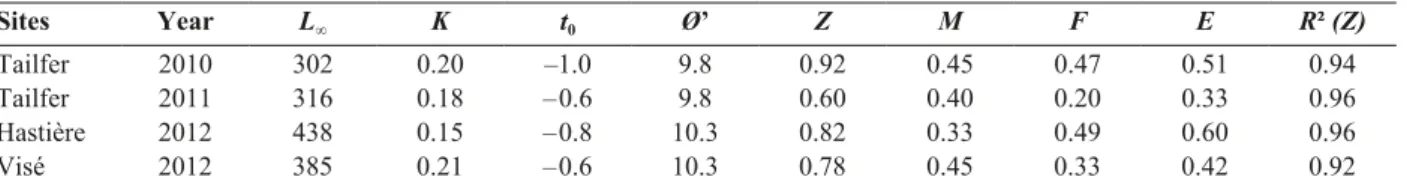
Dynamics of roach populations
Following low capture of young roach due to the gears
(gillnet more precisely) used, dynamic analysis was
performed with roach older than 1+ until 8+. Scales
were taken on 56 fish taken during sampling taking
ac-count of length frequency. It appears that roach
popu-lations in the reaches of Hastière, Tailfer and Visé have
a growth K comprised between 0.15 and 0.21 year
–1.
Asymptotic lengths L
∞estimated in 2012 are higher
to those estimated at Tailfer in 2010 and 2011 (Table
5). For the reach of Tailfer, asymptotic length tends to
decrease between estimates of 2010/11 and 1993/2002
while growth remains stable (Tables 5 & 6). Growth
performance index Ø’ reveals a low variability
be-tween estimates. The highest values are found in the
reaches of Visé and Hastière (Table 5).
Exploitation, which reflects all types of
mortali-ties, was high in the reach of Hastière. In the reach of
Visé, exploitation was lower and comprised between
estimates for the reach of Tailfer (Table 5).
Discussion
A strong decline in roach stock has been observed in
the River Meuse in the past decade according to direct
indicators such as stock estimates by mark-recapture,
catch per unit effort with gillnet and roach passages at
two fish passes. According to mark-recapture model,
roach stock declined by 91 % in the reach of Tailfer
reaching densities of 300 fish ha
–1. Size class
inves-tigated are of the same order. At the same time, a
de-crease of 95 % in CPUE by gillnetting was observed.
The study of Tailfer pass provided the same conclusion
with a decrease of 93 % in roach passages. Other stock
estimates conducted in the reaches of Hastière and
Visé showed that the decline observed at Tailfer can
be extrapolated to the whole Belgian Meuse as stocks
at Hastière and Visé reaches were low too. In
addi-tion, study of the Lixhe pass (adjacent to the reach of
Visé) has shown a similar decrease, higher than 96 %
of roach passages. Growth and mortality presented no
radical changes suggesting that the decrease in density
did not influence vital population parameters.
Estimates of roach density
Choice of mark-recapture method instead of removal
method was due to high complexity for applying
re-moval method in the River Meuse, which is a large
(> 100 m) and deep (> 2 m) river. As Kelso and Shuter
(1989) doubt on the efficiency of removal method for
lake populations, same conclusions can be drawn for
great rivers. For such environments, the
mark-recap-ture is the most used method (Donkers et al. 2011;
Gresswell et al. 1997). The principle of the Jackson
method is that marking occurs on one occasion only
and followed by several recaptures (Begon 1979). As
mentioned before, all roach were marked on a single
day. This single mass-marking was followed by
multi-ple recapture events by a trained team. These two
as-pects make the use of the Jackson’s positive method
efficient and extremely useful. This method is an
ex-tension of the Petersen method which allows loss but
no gain (Begon 1979).
The choice we made of fish grown in fish farm can
have some biases due to the behaviour of these fish
when released in the wild. For example, in the reach
of Hastière, a lot of marked roach stayed hidden in
aquatic vegetation more present in this reach (personal
observation) which can lead to underestimate the
natu-ral population by increasing marked fish capture.
Re-capture rate in this reach was the highest in this study.
Moreover, these fish can suffer higher mortality rate
than wild fish of the same age (Brown & Laland 2001;
Phillipart 1995).
Although the analysis of fish pass data is an
in-direct and selective fish inventory method, inherently
unique, it is an important tool in river management to
control fish populations (Roscoe & Hinch 2010).
Fur-thermore, in great rivers, there are no methods which
can offer a perfect sample fully representative of fish
fauna. Electrofishing and gillnetting have also their
Table 5.Growth parameters of VBGC, performance index (Ø’), mortalities and exploitation of roach. L∞, asymptotic total length;K, growth rate; t0, hypothetical age when length equals 0; Z, total mortality; M, natural mortality; F, fishing mortality; E,
exploita-tion. R² is the coefficient of determination of the regression of natural logarithm of number of individuals by cohorts on age.
Sites Year L∞ K t0 Ø’ Z M F E R² (Z)
Tailfer 2010 302 0.20 –1.0 9.8 0.92 0.45 0.47 0.51 0.94
Tailfer 2011 316 0.18 – 0.6 9.8 0.60 0.40 0.20 0.33 0.96
Hastière 2012 438 0.15 – 0.8 10.3 0.82 0.33 0.49 0.60 0.96
own limits (Pusey et al. 1998; Casselman et al. 1990),
as demonstrated by Goffaux et al. (2005).
Our results indicate that abundance of roach
es-timated by mark-recapture in the River Meuse in
2010 – 2012 was very low compared with earlier data
(1993 – 2003) obtained with the same protocol. In the
three monitoring sites, recent estimates were below
500 roach ha
–1(61– 340 mm). The lowest density was
found in the reach of Hastière with 109 roach ha
–1(61– 340 mm). According to previous estimates based
on the Jackson method, a density relatively stable
com-prised between 3000 and 3700 roach ha
–1(51– 370 mm)
was found.
In the River Thames (England), roach stock has
been investigated by mark-recapture by Williams
(1965) and its density was estimated at 10000 roach
ha
–1for fish over 10 cm fork length. In Lake
Tjeuke-meer (The Netherlands), roach density was estimated
at 585 roach ha
–1. This low density was attributed to
scarcity of zoobenthos and competition from other
species (Goldspink 1979). In Lake Årungen, a
eu-trophic lake in Norway, biomass of roach was
esti-mated at 550 kg ha
–1in the 1980s (Eie & Borgstørm
1981). Eutrophication can have profound effects on
fish communities, with cyprinid fishes such as roach
dominating communities in these environments
(Wil-lemsen 1980, Winfield 1992). The River Meuse is a
eutrophic river that corroborates well with the high
density of roach found in the 1990s and beginning of
2000s. Recent studies reported that nutrient
concentra-tions, which could explain such decline in fish stocks,
didn’t show any sharp decrease during the study
pe-riod (Pigneur et al. 2014), suggesting that other causes
such as bivalves or a high pressure predation should
be responsible of such drastic decline in roach density.
Gillnet CPUE has been widely used as an
impor-tant parameter in monitoring abundance changes or
like an index of fish abundance (Olin et al. 2002; Olin
et al. 2009; Mehner et al. 2005). Statistical
compari-sons of CPUEs corroborate the conclusion about the
decrease in estimated densities. CPUEs obtained in
2011 and 2012 by gillnets are significantly lower than
those obtained in previous studies except in 1993
(gill-nets of 20 and 30 mm) and 2001 (gill(gill-nets of 20 mm).
As roach stocks are low, CPUEs are low too.
We can assert that the use of fish pass data confirms
what other methods revealed. Time-series study of fish
pass indicated a decrease of 93 % in roach passages,
in accordance with the decrease of 95 % revealed by
CPUE with gillnet and with the decrease of 91 % in
roach stock estimates at Tailfer reach. Based on these
observations and considering also the marked decline
in roach passages in the Lixhe pass (reach of Visé), it
appears that roach population in the Belgian section of
the River Meuse decreased by almost 90 % since the
beginning of the 2000s.
Growth and mortality of roach
Growth of roach can be considered as normal in the
monitoring sites. The parameter K is comprised
be-tween 0.15 and 0.21 year
–1, in line with past estimates in
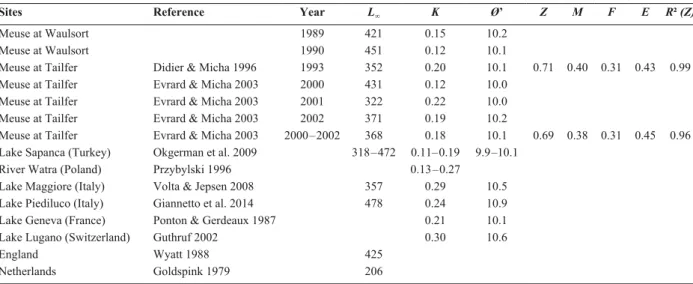
Table 6.Values reported in literature of growth parameters of VBGC, performance index (Ø’), mortalities and exploitation of roach. L∞, asymptotic total length; K, growth rate; t0, hypothetical age when length equals 0; Z, total mortality; M, natural
mortal-ity; F, fishing mortalmortal-ity; E, exploitation. R² is the coefficient of determination of the regression of natural logarithm of number of individuals by cohorts on age.
Sites Reference Year L∞ K Ø’ Z M F E R² (Z)
Meuse at Waulsort 1989 421 0.15 10.2
Meuse at Waulsort 1990 451 0.12 10.1
Meuse at Tailfer Didier & Micha 1996 1993 352 0.20 10.1 0.71 0.40 0.31 0.43 0.99 Meuse at Tailfer Evrard & Micha 2003 2000 431 0.12 10.0
Meuse at Tailfer Evrard & Micha 2003 2001 322 0.22 10.0 Meuse at Tailfer Evrard & Micha 2003 2002 371 0.19 10.2
Meuse at Tailfer Evrard & Micha 2003 2000 – 2002 368 0.18 10.1 0.69 0.38 0.31 0.45 0.96 Lake Sapanca (Turkey) Okgerman et al. 2009 318 – 472 0.11– 0.19 9.9 –10.1
River Watra (Poland) Przybylski 1996 0.13 – 0.27 Lake Maggiore (Italy) Volta & Jepsen 2008 357 0.29 10.5 Lake Piediluco (Italy) Giannetto et al. 2014 478 0.24 10.9 Lake Geneva (France) Ponton & Gerdeaux 1987 0.21 10.1 Lake Lugano (Switzerland) Guthruf 2002 0.30 10.6
England Wyatt 1988 425
the reaches of Tailfer and Waulsort (Table 6). In other
countries, growth rates range from 0.11 (Okgerman et
al. 2009) to 0.30 (Guthruf 2002). Regarding
asymp-totic length, populations examined in the present study
display maximal lengths of 438 and 385 mm which are
close to the values previously reported in Tailfer and
Waulsort. These values are greater than those reported
in the literature (see Table 6). The Ø’ values are 10.3 at
Hastière and Visé, slightly greater than values reported
in previous estimates in Tailfer and Waulsort. Current
values at Tailfer are lower than the past ones. Values
reported in literature are between 9.9 (Okgerman et al.
2009) and 10.9 (Giannetto et al. 2014). The obtained
Ø’ values of roach were very close to reported values
from other countries. Regarding values reported in
lit-erature for roach growth rate, maximal length and the
index of growth performance, values reported in this
study are in line with the biology of this species. More,
decline of roach population in the River Meuse had no
detectable impact on vital parameter of this species.
Current estimates of total mortality (0.78 to 0.92
year
–1) are higher than past values (0.69 to 0.71
year
–1) except for the year 2011 (0.60 year
–1). In terms
of survival, current estimates are between 0.40 and
0.55 and past values are between 0.49 and 0.50.
Vøll-estad & L’Abée-Lund (1987) found that survival of
mature male and female was 0.30 and 0.52 and did
not vary with age. An et al. (2009) found for mature
female and male values of survival of 0.53 and 0.50,
respectively.
Assumptions of the method used for estimating
total mortality Z are a constant mortality for all ages
considered in the evaluation and a large sample
cover-ing a maximum number of cohorts. Each cohort must
be recruited in equal quantities and, up to a critical
length, vulnerability of each group to capture is
sup-posed constant (Pauly 1997). First and second
assump-tions can be considered as respected. Populaassump-tions
of roach in the reaches studied exhibited relatively
constant total mortality over the entire range of ages
sampled which is reflected by a high coefficient of
de-termination (Table 5). For the evaluation of Z, 7 to 8
cohorts were used. Third and fourth assumptions have
been respected by rejecting from the analysis cohorts
that were under-estimated following a low sampling
effort due to gears used.
In an exploited stock, natural mortality is the most
difficult parameter to estimate but is important for
models of stock management. A priori, this mortality
must be estimated in unexploited stocks (Pauly 1997).
Due to the stock exploitation in the River Meuse and
insufficient catch curve, we used the equation
devel-oped by Pauly (1980) to estimate natural mortality.
In the present study natural mortality was very close
to previous estimates in the reach of Tailfer. Fishing
mortality was high in roach stock of Hastière, leading
to an over exploitation (60 %). In the reach of Visé,
exploitation was similar to past estimates at Tailfer. In
the reach of Tailfer, exploitation remained constant
be-tween 1993 and 2002. A slight increase is observed for
the year 2010. In 2011, exploitation was low (33 %).
The use of parameters in Pauly’s equation has been
revisited by Griffiths and Harrod (2007). The use of K,
L
∞and T for determining natural mortality is a good
agreement but habitat and taxon are also important
factors which have to be taken into account (Griffiths
& Harrod 2007). Estimating natural mortality can also
be based on capture-recapture analyses of tagged
in-dividuals (Quinn & Deriso 1999; Donkers et al. 2011)
but this method is time consuming due to tagging of
fish and recapture.
Potential causes of decline
Different reasons can be proposed to explain the
ob-served drastic change of the most common fish in the
River Meuse. Alteration of habitat heterogeneity for
navigation has conducted to a decrease of
biodiver-sity in the River Meuse (Descy et al. 2009). However,
channelization, deepening of the river bed and
stabili-sation of banks were done in the last century (Micha
& Borlée 1989) and thus cannot be considered as the
main causes of the recent decline observed for roach.
But these perturbations can facilitate the establishment
of invasive species potentially harmful for freshwater
fauna.
Since several years, water quality of the River
Meuse tended to improve following the construction
of many sewage treatment plants (Descy et al. 2009).
But nutrient levels (C, P and N) still remained rather
stable during the last decade (Latli et al. unpublished).
However, from the mid-2000s, an unexpected drastic
decline in phytoplankton biomass has been reported
while nutrients are still sufficient for plankton growth.
As phytoplankton growth conditions have improved
rather than degraded, Pigneur et al. (2014)
hypoth-esized an increase of losses linked to the spectacular
invasion of Asian clams, Corbicula sp. The decline in
plankton biomass can lead to a “bottom-up” effect on
fish populations following the 70 % loss of primary
production (Pigneur et al. 2014) which cannot be
re-placed by macrophytes because of river
channeliza-tion. For example, in the San Francisco Bay, the
inva-sion by the Asiatic clam Pomatocorbicula amurensis
resulted in the decline of plankton (Alpine & Cloern
1992; Kimmerer et al. 1994) and, consequently, of
plankton-feeding fish (Moyle et al. 1992). On the other
hand, spread of invasive molluscs can increase the
bio-mass of benthophagous fish, as shown by Karatayev et
al. (1997) in Eastern Europe.
Population of Great Cormorant (Phalacrocorax
carbo) has established a wintering population in the
River Meuse valley since 1991 (Clotuche & Schaeken
1991) and colonized reach of Tailfer in 1994. More
generally, after a constant period of growth (16 % per
year) until 2001, the Great Cormorant population along
the Meuse River stood high until 2004. Since 2004,
the wintering population declined progressively by
67 % per year until 2009 while birds started colonizing
more intensively small tributaries (Paquet 2007, 2011).
Since 2010, the population along the River Meuse
re-mained very low and stable. This observation can
sug-gest a “top-down” effect of Great Cormorant on fish
stock during its period of outbreak as roach is one of
its favourite preys. In 2002, it was found that roach
represent 33 % of prey found in the diet of Great
Cor-morant in the reach of Tailfer (Evrard & Tarbe 2002).
Evrard et al. (2005) estimated a consumption of roach
by cormorant between 21.9 and 24 kg ha
–1year
–1.
These changes in predation pressure and primary
production can be highlighted as potential causes of
roach population decline and more investigations are
needed in order to determine which ones are the most
impacting on fish population and communities in the
River Meuse to make conservation measures efficient.
Acknowledgments
We thank the field crew, especially André Evrard and Julien Lorquet, for their great expertise and support in fish samplings. We also thank the staff of the Fishery Service (General Directo-rate O3, Public Service of Wallonia) for its contribution to fish marking. Special thanks to Victor Paquay for the monitoring of the Tailfer pass and to Arnaud Dierckx and Gilles Rimbaud for the monitoring of the Lixhe pass. Special tanks to Jean-Yves Paquet for data of Great Cormorant. This work was supported by the Public Service of Wallonia and the European Fisheries Fund (contract FEP 32-1109-004).
References
Alpine, A .E. & Cloern, J. E., 1992: Trophic interactions and direct physical effects control phytoplankton biomass and production in an estuary. – Limnology and Oceanography 37: 946 – 955.
An, W., Hu, J., Giesy, J. P. & Yang, M., 2009: Extinction risk of exploited wild roach (Rutilus rutilus) populations due to chemical feminization. – Environmental Science & Technol-ogy 43: 7895 –7901.
Bailey, R. S., 1984: Comparison with other methods. – In: Craig, R. E. (ed.): Fisheries acoustics. – Rapp. P.-v. Réunion Cons. Int. Explor. Mer, vol 184, pp. 119 –122.
Begon, M., 1979: Investigating animal abundance: capture-recapture for biologist. – Edward Arnold, United Kingdom, pp. 1– 97.
Brown, C. & Laland, K., 2001: Social learning and life skills training for hatchery reared fish. – Journal of Fish Biology
59: 471– 493.
Casselman, J. M., Penczak, T., Carl, L., Mann, R. H. K., Holcik, J. & Woitowich, W. A., 1990: An evaluation of fish sampling methodologies for large river systems. – Polish Archives of Hydrobiology 37: 521– 551.
Clotuche, E. & Schaeken, P., 1991: Evolution récente du statut du Grand cormoran (Phalacrocorax carbo) en Meuse liégeoise. – AVES 28: 223 – 225.
Cragg-Hine, D. & Jones, J. W., 1969: Growth of dace Leuciscus
leusciscus (L), roach Rutilus rutilus (L) and chub Squalius cephalus (L) in Willow Brook, Northamptonshire. – Journal
of Fish Biology 1: 59 – 82.
Dahm, E., Hartmann, J., Loeffler, H. & Voelzke, V., 1992: Re-view of the European Inland Fisheries Advisory Commission (EIFAC) experiments on stock assessment in lakes. – Journal of Applied Ichthyology 8: 1– 9.
Daufresne, M., Roger, M. C., Capra, H. & Lamouroux, N., 2003: Long-term changes within the invertebrate and fish communities of the Upper Rhône River: effects of climatic factors. – Global Change Biology 10: 124 –140.
Descy, J.-P., 1987: Phytoplankton composition and dynamics in the River Meuse (Belgium). – Archiv für Hydrobiologie Supplement 78: 225 – 245.
Descy, J.-P., Kestemont, P., Everbecq, E., Verniers, G., Usseg-lio-Poletera, P., Gérard, P., et al., 2009: The Meuse River Ba-sin. – In: Tockner, K., Uehlinger, U. & Robinson, C. T. (eds): Rivers of Europe. – Elsevier, London, pp. 154 –165.
Didier, J. & Micha, J.-C., 1996: Dynamique de population du gardon en Meuse et stratégie de gestion. – Presses Universi-taires de Namur, Namur, pp. 1–106.
Donkers, P., Patil, J. G., Wisniewski, C. & Diggle, J. E., 2011: Validation of mark-recapture population estimates for inva-sive common carp, Cyprinus carpio, in Lake Crescent, Tas-mania. – Journal of Applied Ecology 28: 7–14.
Eie, J. A. & Borgstørm, R., 1981: Distribution and food of roach (Rutilus rutilus L.) and perch (Perca fluviatilis L.) in the eut-rophic Lake Årungen, Norway. – Verhandlungen der Interna-tionalen Vereinigung der Limnologie 21: 1257–1263. Evrard, G. & Micha, J.-C., 2003: Dynamique de population du
gardon en Meuse namuroise après arrêt des repeuplements. – Presses Universitaires de Namur, Namur, p. 1– 34.
Evrard, G. & Tarbe, A.-L., 2002: Etude du régime et de la sélectivité alimentaire du Grand Cormoran (Phalacrocorax
carbo sinensis) hivernant en Haute-Meuse belge. – Aves 39:
159 –178.
Evrard, G., Dermien, F., De Gottal, P., Monmart, A., Pourign-aux, F., Vanmeerbeeck, P. & Paquet, J.-Y., 2005: Estimation de la pression de pêche du Grand Cormoran (Phalacrocorax
carbo) en Meuse belge par le suivi de la dispersion matinale
des individus. – Aves 42: 121–133.
Foote, K. G. & Stefansson, G., 1993: Definition of the problem of estimating fish abundance over an area from acoustic line-transect measurement of density. – ICES Journal of Marine Science 50: 369 – 381.
Gatz, A. J. & Loar, J. M., 1988: Petersen and removal popula-tion size estimates: combining methods to adjust and inter-pret results when assumptions are violated. – Environmental Biology of Fishes 21: 293 – 407.
Giannetto, D., Carosi, A., Ghetti, L., Viali, P. & Lorenzoni, M., 2014: Size selectivity of gill-nets and growth of roach Rutilus
rutilus (Linnaeus, 1758: Piediluco lake (Italy). – Knowledge
and Management of Aquatic Ecosystems 413: 1–13. Goffaux, D., Grenouillet, G. & Kestemont, P., 2005:
Electro-fishing versus gillnet sampling for the assessment of fish as-semblages in large rivers. – Archiv für Hydrobiologie 162: 73 – 90.
Goldspink, C. R., 1979: The population density, growth rate and reproduction of roach Rutilus rutilus (L.) in Tjeukemeer, The Netherlands. – Journal of Fish Biology 15: 473 – 498. Gresswell, R. E., Liss, W. J., Lomnicky, G. A., Deimling, E. K.,
Hoffman, R. L. & Tyler, T., 1997: Using mark-recapture methods to estimate fish abundance in small mountain lakes. – Northwest Science 71: 39 – 44.
Griffiths, D. & Harrod, C., 2007: Natural mortality, growth pa-rameters, and environmental temperature in fishes revisited. – Canadian Journal of Fisheries and Aquatic Sciences 64: 249 – 255.
Guthruf, J., 2002: Die Biologie des Routages im Luganersee (Kanton TI). – Buwal, Mitteilungen zur Fischerei 74: 90. Hamley, J. M., 1975: Review of gillnet selectivity. – Journal of
the Fisheries Research Board of Canada 32: 1943 –1969. Holm, S., 1979: A simple sequentially rejective multiple test
procedure. – Scandinavian Journal of Statistics 6: 65 –70. Huet, M., 1949: Aperçu des relations de la pente et des
popula-tions piscicoles des eaux courantes. – Schweizerische Zeit-schrift für Hydrobiologie 11: 332 – 351.
Jackson, C. H. N., 1939: The analysis of an animal population. – Journal of Animal Ecology 8: 238 – 246.
Karatayev, A. Y., Burlakova, L. E. & Padilla, D. K., 1997: The effects of Dreissena polymorpha (Pallas) invasion on aquatic communities in Eastern Europe. – Journal of Shellfish Re-search 16: 187– 203.
Kelso, J. R. M. & Shuter, B. J., 1989: Validity of the removal method for fish population estimation in a small lake. – North American Journal of Fisheries Management 9: 471– 476. Kimmerer, W. J., Gartside, E. & Orsi, J. J., 1994: Predation by
an introduced clam as the likely cause of substantial declines in zooplankton of the San Francisco Bay. – Marine Ecology Progress Series 113: 81– 93.
Kottelat, M. & Freyhof, J., 2007: Handbook of European fresh-water fishes. – Publications Kottelat, Cornol and Freyhof, Berlin, pp. 1– 646.
Larinier, M., 1998: Upstream and downstream fish passage experience in France. – In: Jungwirth, M., Schmultz, S. & Weiss, S. (eds): Fish Migration and Fish Bypasses. – Fishing News Books, Vienna, pp. 127–145.
Laurent, M. & Lamarque, P., 1975: Utilisation de la méthode des captures successives (De LURY) pour l’évaluation des peuplements piscicoles. – Bulletin Français de Pêche et de Pisciculture 259: 66 –77.
Lee, R. M., 1920: A review of the methods of age and growth determination in fishes by means of scales. – Fisheries Inves-tigations Series II, Marine Fisheries Great Britain Ministry of Agriculture Fisheries and Food 4: 1– 32.
Mallen-Cooper, M. & Brand, D. A., 2007: Non-salmonids in a salmonid fishway: what do 50 years of data tell us about past and future fish passage? – Fisheries Management and Ecol-ogy 14: 319 – 332.
Mann, R. H. K., 1973: Observations on the age, growth, repro-duction and food of the roach, Rutilus rutilus (L.) in two riv-ers in southern England. – Journal of Fish Biology 5: 707–736.
Micha, J. C. & Borlée, M. C., 1989: Recent historical changes on the Belgian Meuse. – In: Petts, G. E. & Möller, H. (eds): Historical Changes of Large Alluvial Rivers: Western Eu-rope. – John Wiley & Sons, Chichester, pp. 269 – 295. Micha, J. C. & Pilette, S., 1988: L’impact de l’homme sur
l’écosystème Meuse. – In: Actes du colloque tenu à Namur (Belgique) les 3 et 4 novembre 1988, Namur, 3 – 4 Novembre 1988. – Presses Universitaires de Namur, Namur, pp. 1–140. Mehner, T., Diekmann, M., Brämick, U. & Lemcke, R., 2005:
Composition of fish communities in German lakes as related to lake morphology, trophic state, shore structure and human-use intensity. – Freshwater Biology 50: 70 – 85.
Moyle, P. B., Herbold, B., Stevens, D. E. & Miller, L. W., 1992: Life history and status of delta smelt in the Sacramento-San-Joaquin Estuary, California. – Transactions of the American Fisheries Society 121: 67–77.
Murphy, B. R. & Willis, D. W. (eds), 1996: Fisheries techniques, 2nd ed. – American Fisheries Society, Bethesda, Maryland, pp. 1–732.
Naddafi, R., Abdoli, A., Kiabi, B. H., Amiri, B. M. & Karami, M., 2005: Age, growth and reproduction of the Caspian roach (Rutilus rutilus caspicus) in the Anzali and Gomishan wet-lands, North Iran. – Journal of Applied Ecology 21: 492 – 497. Okgerman, H., Muammer, O. & Yigit, S., 2009: Biological as-pects of Rutilus rutilus (roach) in Sapanca Lake (Turkey). – Journal of Animal and Veterinary Advances 8: 441– 446. Olin, M., Rask, M., Ruuhijärvi, J., Kurkilahti, M., Ala-Opas,
P. & Ylönen, O., 2002: Fish community structure in meso-trophic and eumeso-trophic lakes of Southern Finland: the relative abundance of percids and cyprinids along a trophic gradient. – Journal of Fish Biology 60: 593 – 612.
Olin, M., Malinen, T. & Ruuhijärvi, J., 2009: Gillnet catch in estimating the density and structure of fish community – Comparison of gillnet and trawl samples in a eutrophic lake. – Fisheries Research 96: 88 – 94.
Paquet, J.-Y., 2007: Les recensements coordonnés des Grands Cormorans (Phalacrocorax carbo) hivernant en Wallonie et à Bruxelles : hiver 2006 – 2007. – Aves 44: 251– 254.
Paquet, J.-Y., 2011: Recensements coordonnés des dortoirs de Grand Cormoran Phalacrocorax carbo en Wallonie et à Bruxelles : résultats 2010 – 2011. – Aves 48: 249 – 252. Paquet, J.-Y., 2014: Détermination de la pression de prédation
du Grand Cormoran sur le bief de Tailfer (Meuse namuroise) 2013 – 2014. – Unpublished report, pp. 1–10.
Pauly, D., 1980: On the interrelationships between natural mor-tality, growth parameters, and mean environmental temper-ature in 175 fish stocks. – Journal du Conseil International pour l’Exploration de la Mer 39: 175 –192.
Pauly, D., 1997: Méthode pour l’évaluation des ressources hali-eutiques. – Cépaduès-Editions, Toulouse.
Pauly, D. & Munro, J., 1984: Once more on the comparison of the growth in fish and invertebrates. – Fishbyte Newsletter of the Network of Tropical Fisheries Scientists 2: 21.
Peltonen, H., Ruuhijärvi, J., Malinen, T. & Horppila, J., 1999: Estimates of roach (Rutilus rutilus (L.)) and smelt (Osmerus
eperlanus (L.)) stocks with virtual population analysis,
hy-droacoustics and gillnet CPUE. – Fisheries Research 44: 25 – 36.
Petersen, C. G. J., 1896: The yearly immigration of young plaice into the Limfjord from the German Sea. – Report of the Dan-ish Biological Station 6: 5 – 84.
Phillipart, J.-C., 1995: Is captive breeding an effective solution for the preservation of endemic species? – Biological Con-servation 72: 281– 295.
Pigneur, L.-M., Falisse, E., Roland, K., Everbecq, E., Deliège, J.-F., Smitz, J. S., Van Doninck, K. & Descy, J.-P., 2014: Im-pact of invasive Asian clams, Corbicula spp., on a large river ecosystem. – Freshwater Biology 59: 573 – 583.
Poff, N. L., Allan, J. D., Bain, M. B., Karr, J. R., Prestegaard, K. L., Richter, B. D., Sparks, R. E. & Stromberg, J. C., 1997: The natural flow regime. – Bioscience 47: 769 –784.
Ponton, D. & Gerdeaux, D., 1987: La population du gardon (Rutilus rutilus (L.)) du lac Léman en 1983 – 85. Structure en âge, déterminisme du recrutement, analyse de la crois-sance. – Bulletin Français de la Pêche et de la Pisciculture
305: 43 – 53.
Przybylski, M., 1996: Variation in fish growth characteristics along a river course. – Hydrobiologia 325: 39 – 46.
Pusey, B. J., Kennard, M. J., Arthur, J. M. & Arthington, A. H., 1998: Quantitative sampling of stream fish assemblages: sin-gle vs. multiple pass electrofishing. – Australian Journal of Ecology 23: 365 – 374.
Quinn, T. J. & Deriso, R. B., 1999: Quantitative fish dynamics. – Oxford University Press, New York, pp. 1– 560.
Ricker, W. E., 1975: Computation and interpretation of biologi-cal statistics of fish populations. – Bulletin of the Fisheries Research Board of Canada 191, pp. 1– 401.
Rosenberger, A. E. & Dunham, J. B., 2005: Validation of abun-dance estimates from mark-recapture and removal technics for rainbow trout captured by electrofishing in small streams. – North American Journal of Fisheries Management 25: 1395 –1410.
Rufilson, R. A., 1991: Finfish utilization of man-initiated and adjacent natural creeks of South Creek estuary, North Caro-lina, using multiple gear types. – Estuaries 14: 447– 467. Schnute, J. T. & Hilborn, R., 1993: Analysis of contradictory
data sources in fish stock assessment. – Canadian Journal of Fisheries and Aquaculture Sciences 50: 1916 –1923.
Sparre, P. & Venema, S. C., 1996: Introduction à l’évaluation de stocks de poissons tropicaux, Première partie: manuel. – FAO, Document technique sur les pêches, 3036: Rév. 1, , Rome, pp. 1– 401.
Tans, M., 2000: Utilisation de noues de la Meuse en tant que sites de reproduction et de nurserie par les poissons du fleuve. – PhD Thesis, University of Namur, Namur.
Thompson, W. L., White, G. C. & Gowan, C., 1998: Monitoring vertebrate populations. – Academic Press, San Diego. Vøllestad, L. A. & L’Abée-Lund, J. H., 1987: Reproductive
bi-ology of stream-spawning roach, Rutilus rutilus. – Environ-mental Biology of Fishes 18: 219 – 227.
Volta, P. & Jepsen, N., 2008: The recent invasion of Rutilus
rutilus (L.) (Pisces: Cyprinidae) in a large South-Alpine lake:
Lago Maggiore. – Journal of Limnology 67: 163 –170. Von Bertalanffy, L., 1938: A quantitative theory of organic
growth. – Human Biology 10: 181– 213.
Welch, B. L., 1951: On the comparison of several mean values: an alternative approach. – Biometrika 38: 330 – 336.
White, G. C., Anderson, D. R., Burnham, K. P. & Otis, D. L., 1982: Capture-recapture and removal methods for sampling closed populations. – Report LA-8787-NERP, Los Alamos National Laboratory, Los Alamos.
Willemsen, J., 1980: Fishery-aspects of eutrophication. – Aquatic Ecology 14: 12 – 21.
Williams, W. P., 1965: The population density of four species of freshwater fish, roach (Rutilus rutilus (L.)), bleak
(Albur-nus albur(Albur-nus (L.)), dace (Leuciscus leuciscus (L.)) and perch
(Perca fluviatilis (L.)) in the River Thames at Reading. – Journal of Animal Ecology 34: 173 –185.
Winfield, I. J., 1992: Threats to the lake fish communities of the UK arising from eutrophication and species introductions. – Netherlands Journal of Zoology 42: 233 – 242.
Wyatt, R. J., 1988: The cause of extreme year class variation in a population of roach, Rutilus rutilus L., from a eutrophic lake in southern England. – Journal of Fish Biology 32: 409 – 421.