Quantification of lipid bilayer effective
microviscosity and fluidity effect induced by
propofol
Mohamed A. Bahri a, Belinda J. Heyne b, Pol. Hans c, Alain E. Seret a, Ange A. Mouithys-Mickalad d, and Maryse D. Hoebeke b ,*
Department of physics, Institute of Physics, B5, University of Liege, Sart-Tilman, B-4000 Liege (Belgium)
aLaboratory of Experimental Medical Imaging.
bLaboratory of Biomedical Spectroscopy.
cDepartment of Anaesthesiology and Intensive Care, Centre Hospitalier Universitaire, B35,
University of Liège, Sart Tilman, 4000, Liège, Belgium.
dCentre of Oxygen Research and Development (CORD), University of Liège, Institut de Chimie,
B6a, Sart Tilman, 4000, Liège, Belgium.
* Corresponding author. Tel : +32-04- 366 36 51; fax: +32-04-366 28 13. E-mail: [email protected]
1 Abbreviations: DMPC, dimyristoyl-L-_ phosphatidylcholine; n-DSA, n-doxyl stearic acids spin probe; ESR, electron spin resonance; MC540, merocyanine 540; PPF, 2,6-diisopropylphenol (propofol); DPPC, dipalmitoyl phosphatidyl choline; 5-DSA, 2-(3-carboxypropyl)-4,4-dimethyl-2-tridecyl-3-oxazolidinyloxy; 12-DSA, 2-(10-carboxydecy)-2-hexyl-4,4-dimethyl-3-oxazolidinyloxy; 16-DSA, 2-(14-carboxytetradecyl)-2-ethyl-4,4-dimethyl-3-oxazolidinyloxy; MLV, multilamellar large vesicle; !c, correlation time parameter; W0, central line width at half-height; h0, amplitude of the center line; h-1, amplitude of the high-field line; S, order parameter; T||'and T!', anisotropic hyperfine splitting; ", viscosity; #, density of liquid; Pgly, percent of glycerol; SDS, sodium dodecyl sulphate; CTAB, cetyltrimethyl-ammonium bromide.
Abstract
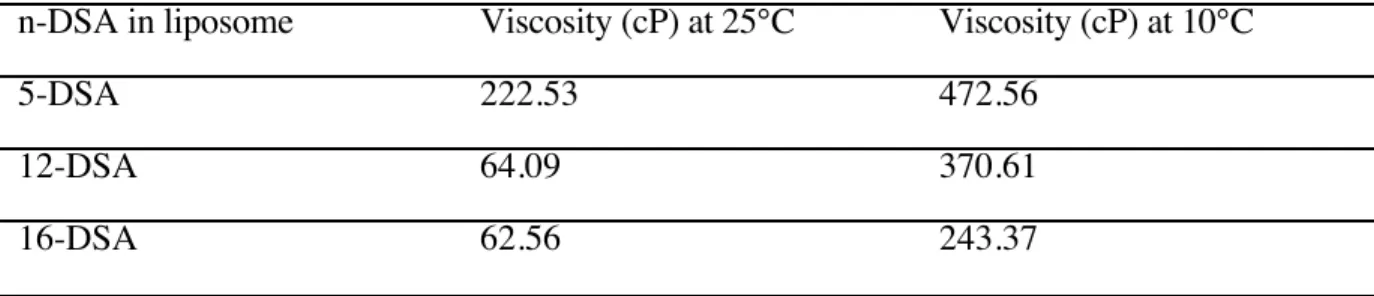
Electron Spin Resonance spectroscopy (ESR) with nitroxide spin probes was used as a method to probe the liposome microenvironments. The effective microviscosities have been determined from the calibration of the ESR spectra of the probes in solvent mixtures of known viscosities. In the first time, by measuring ESR order parameter and correlation time of stearic spin probes, we have been able to quantify the value of effective microviscosity at different depths inside the liposome membrane. At room temperature, local microviscosities measured in dimyristoyl-L-_ phosphatidylcholine (DMPC)1 liposome membrane at thedifferent depths of 7.8, 16.95 and 27.7 Å, were 222.53, 64.09 and 62.56 cP, respectively. In the gel state (10°C), those microviscosity values increased to 472.56, 370.61 and 243.37 cP. In a second time, we haveapplied this technique to determine the modifications in membrane microviscosity induced by propofol (2,6-diisopropyl phenol), an anaesthetic agent extensively used in clinical practice. Propofol is characterized by a unique phenolic structure, absent in the other conventional anaesthetics. Indeed, given its lipophilic property, propofol is presumed to penetrate into and interact with membrane lipids and hence to induce changes in membrane fluidity. Incorporation of propofol into dimyristoyl-L-_ phosphatidylcholine liposomes above the phase-transition temperature (23.9°C) did not change microviscosity. At 10°C, an increase of propofol concentration from 0 to 1.0 $ 10-2 M for a constant lipid concentrationmainly induced a decrease in microviscosity. This fluidity effect of propofol has been qualitatively confirmed using merocyanine 540 as lipid packing probe. Above 10 -2 M propofol, no further decrease in microviscosity was observed and the microviscosity at the
studied depths (7.8, 16.95 and 27.7 Å) amounted 260.21, 123.87 and 102.27 cP, respectively. The concentration 10-2 M was identified as the saturation limit of propofol in dimyristoyl-L-_ phosphatidylcholine liposomes.
1. Introduction
Many physiological functions associated with biological membranes are known to be profoundly affected by the dynamic properties of the phospholipid matrix. It is believed that the changes in such physical properties of bilayers as phase transitions temperature, lateral phase separations, local dielectric properties, and rotational diffusion, modulate the biological activity of many membrane-associated receptors, transport proteins, and enzymes. One of the most widely techniques available to study these properties is fluorescence spectroscopy. It has been shown that environmental fluorescent probes, of varying structural complexity, report on most of these dynamic phenomena, both in natural as well as in model membrane and micellar systems [1]. One important goal of the work has consisted in determining the apparent or effective membrane microviscosity [2]. However, many membrane microviscosity values measured with different fluorophores depend often on the molecular properties of the probe [3]. Generally, when the fluorophore requires a large volume for motion, whether it be for excited-state formation or nonradiative deexcitation, a wide range of microviscosity values is obtained. It has been suggested that the large probe may cause membrane bilayer distortion [2].
Fluorescent probes report not only on bilayer microviscosities and phase behaviour, but they also provide information, on the local dielectric properties of their environment [4, 5]. Usually the fluorescence emission characteristics can be related to the dielectric constant of a solvent in a standard solvent scale.
The bilayer microviscosity can be studied by use of luminescence techniques such as steady-state or dynamic depolarization and diffusion-dependent inter- and intramolecular excimer formation[1, 5]. Unfortunately, these techniques have limitations. For example, the concentrations required for effective intermolecular pyrene excimer formation in lipid bilayer often lead to probe aggregation because of nonuniform probe distribution [5]. Microviscosities obtained from intramolecular excimer formation are more dependent on the structural characteristics of the probe rather than on the environment itself [3]. In order to calculate the microviscosities from steady-state depolarization
we must assume that probe motion in the bilayer is isotropic. This assumption may not be valid for most nonpolar fluorophores [6]. Electron Spin Resonance (ESR) technique is also currently used to investigate the microenvironment of nitroxide spin probes in membrane liposome by measuring the nitrogen-coupling constant and ESR spectra line width [7].The line widths are governed by rotational and lateral diffusion of the spin probes, which in turn is affected by viscosity and temperature of the local environment [7]. So the relative anisotropy observed in an ESR spectrum is directly related to the rotational mobility of the probe, a term that can be correlated with the probe’s microviscosity [8]. This correlation allows to measure the local microviscosity at different depths inside a liposome membrane. Perm Chandar et al. have determined the microviscosity within sodium dodecyl sulphate (SDS) micelles by comparing the ESR nitroxide spectra in SDS micelles to the spectra of the probe in ethanol/glycerol mixture at known viscosity. They suggest that the microviscosity can effectively be defined as the homogenous solution viscosity which results in the same spectrum as that in the microenvironment [8].
In this work, we have established standard curves of effective microviscosities by calibration of the ESR spectra of three n-DSA (n = 5, 12, 16) probes in glycerol-ethanol mixtures of known viscosities. These curves allow us to quantify the effective microviscosity at different depths inside liposomes by measuring the order parameter (S) and the correlation time (!c) on n-DSA ESR spectra. Local microviscosity of the probe environment in the SDS and 2-propanol were calculated using our method. Our results proved to be consistent with values obtained by other techniques and reported in previous studies. Hence, we have applied our method to samples of biological interest such as Propofol solubilized in liposome solutions.
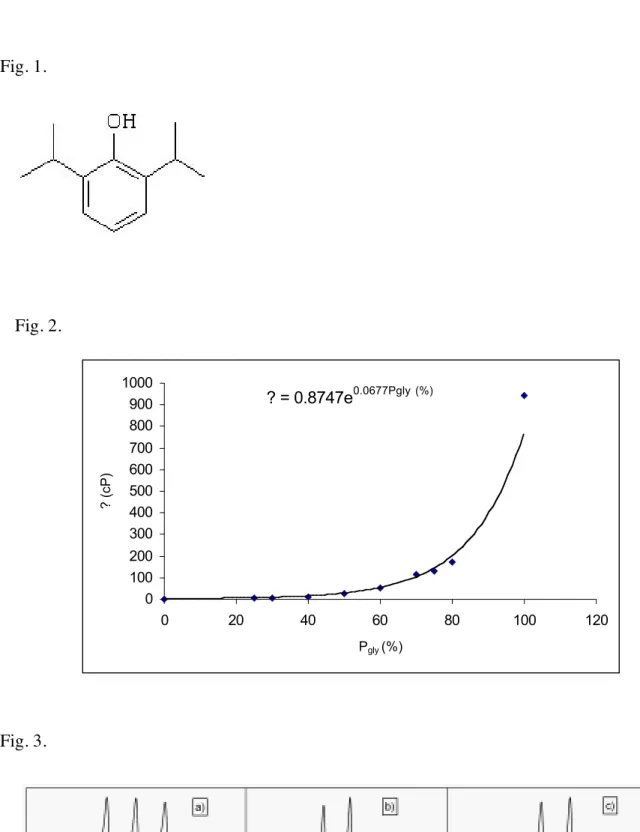
Several drugs can be solubilized inside the membrane bilayer. Some of them induce a decrease in membrane microviscosity and order. Propofol (PPF) (Fig.1) is a non barbiturate anaesthetic agent commonly used for induction and maintenance of general anaesthesia in clinical practice [9]. It is characterized by a unique phenolic structure not present in any other conventional anaesthetic. Due to its lipophilic property, PPF is presumed to penetrate into and interact with membrane lipids,
inducing changes in membrane fluidity [10]. Therefore, quantifying the change in viscosity induced by PPF could be important to better understand the molecular mechanism of its anaesthetic action. It has been previously shown by fluorescence and ESR that PPF promotes the formation of fluid phase domains in membranes [11] and decreases the gel-to-fluid state transition temperature [12]. In this study, we have quantified the membrane microviscosity change induced by PPF incorporation into DMPC, by measuring ESR S-parameter and correlation time of n-DSA. A fluidity effect of PPF in DMPC liposomes below the phase transition temperature has been evidenced. The limit of PPF incorporation in DMPC has also been determined. The PPF fluidity effect has been qualitatively confirmed by using Merocyanine 540 (MC540) as another lipid packing probe.
2. Materials and methods
2.1. Chemicals.
Absolute ethanol and chloroform from Merck (Germany), Glycerol, dipalmitoyl phosphatidyl choline (DPPC) and dimyristoyl phosphatidyl choline (DMPC) from Sigma (USA), stearic spin probes; (3-carboxypropyl)-4,4-dimethyl-tridecyl-3-oxazolidinyloxy (5-DSA), 2-(10-carboxydecyl)-2-hexyl-4,4-dimethyl-3-oxazolidinyloxy (12-DSA) and 2-(14-carboxytetradecyl)-2-ethyl-4,4-dimethyl-3-oxazolidinyloxy (16-DSA) from Aldrich (USA) were with analytical grade and used without further purification.
2.2. Liposome Preparation.
Spin-labelled stearic acids were added to a chloroform solution of DMPC (or DPPC) (5 mg/ml). The mixture was stirred for 5 min and the solvent was evaporated under vacuum. The formed lipid film was suspended in phosphate buffer solution (pH 7.0) at a temperature above the DMPC or DPPC phase-transition temperature 23.9°C and 41.4°C, respectively, and stirred by vortex mixer in order to obtain large multilamellar vesicles (MLV) [13]. After this hydratation, five freeze-thaw cycles using liquid nitrogen were carried out to allow a better incorporation of the labelled stearic acid into the liposome phospholipid bilayer. The MLV suspensions were transferred into an extruder (Lipex Biomembrane, Canada), in which the unilamellar liposomes were formed by passing the suspensions through polycarbonate filters (0.1 µm pore size, Nucleopore, Pleasanton, CA), under a pressure up to 6895 Pa of nitrogen. The procedure was repeated ten times at a temperature above the phase transition temperature of the phospholipids and induced unilamellar liposomes which had a mean size of about 90 nm with very low polydispersity [14, 15].
2.3. Absorption Spectra.
Absorption spectra of MC540 in lipid suspensions were carried out on a Uvikon 941 spectrophotometer (Kontron instruments, Italy). These measurements were performed in quartz
cuvette (1 cm length x 0.4 cm width) thermostatized by a circulating bath connected to the cuvette holder.
2.4. Glycerol-Ethanol Mixtures And Viscosity Measurements.
Glycerol-ethanol mixtures were obtained by adding ethanol to preheated glycerol (35°C) and by stirring the solution for several minutes at room temperature.
Viscosity (") of the glycerol-ethanol mixtures was measured at room temperature using a standard Ostwald viscosimeter [16] and was calculated by equation 1
"2 = "1 (#2 t2 / #1 t1 ) (Equation 1)
where #1, "1, t1 are the known density, known viscosity and the measured liquid flow time of ethanol, respectively; #2 and t2 are the measured liquid flow time and density of the glycerol-ethanol mixtures and "2 its unknown viscosity.
The measured values are listed in Table 1.
The viscosity against the percent of glycerol (Pgly) in glycerol-ethanol mixtures is plotted in Fig. 2. The experimental data were fitted to an exponential law. The isolated point in Fig. 2 represents the value of viscosity in a solution of 100 % glycerol reported from literature [17]. This value can not be measured using Ostwald viscosimeter with a sufficient accuracy.
2.5. Electron Spin Resonance Spectroscopy Measurements.
The ESR measurements were performed at 9.56 GHz using a Bruker ESR 300E spectrometer (Bruker, Germany) equipped with a variable temperature controller accessory. The labeled liposome suspension was introduced into a 50 µl capillary tube. All measurements without liposome were made at room temperature and using an aqueous flat cell. Spectra were recorded by using an 80 G scan range at 20 mW microwave power and 2 G modulation amplitude.
The spectra of 5-, 12- and 16-DSA spin labels in glycerol-ethanol were taken at different percentages of glycerol. All these spectra were interpreted in terms of the correlation time parameter !c, and the order parameter S which were defined successively as
(
)
! ! ! " # $ $ $ % & ' (( ) * ++ , -. . = ' ' 1 10 5 . 6 2 1 1 0 0 10 h h W c/ , expressed in second (Equation 2)
where W0 is the width of the central line at half-height and h0 and h-1 are the amplitudes of the center- and high-field lines [18], and
(
)
(
!)
! " " = T T T T S 2 2 2 2 || ' ' || , (Equation 3)where T||'andT!'are the anisotropic hyperfine splitting measured from the ESR spectra and ||2252TTG!"=
[19]. This value corresponds to the anisotropic hyperfine splitting measured from the ESR spectra of radicalar species completely rigid oriented in a parallel or perpendicular way, respective to the applied magnetic field [19]. The mobility of n-DSA can be quantified as !c in the case of weakly to moderately immobilized labels (!c<3 10
-9 s), whereas for strongly immobilized
probe (!c>3 10
3. Results
3.1. Standard Viscosity Plots
Spin-labels were used as viscosity probes because their ESR spectra are very sensitive to polarity
and mobility [21]. Fig. 3 shows the spectrum of 16-DSA in ethanol (Fig.3.a), in DMPC liposomes (Fig.3.b) and in glycerol/ethanol mixture (Fig.3.c), at 25°C. Spin label stearic acids n-DSA were solubilized in glycerol/ethanol mixture of increasing viscosity. In each case, S and !c were calculated from the measured ESR spectra. For strongly immobilized probes corresponding to _ above 70, 80 and 180 cP, respectively for 5, 12 and 16 DSA (Fig. 4.a), S was used to determine or calculate the microviscosity. For weakly immobilized probes corresponding to _ below these values (Fig. 4.b), microviscosity was determined using !c.
For shake of clarity 5-DSA curves only are presented in Fig. 4 because 12- and 16-DSA curves are very similar to the 5 DSA curve. However, the corresponding fitted formulas are gathered in table 2.
Using these standard curves, the local microviscosities within sodium dodecyl sulphate (SDS), cetyltrimethyl-ammonium bromide (CTAB) and 2-propanol at 25°C, were calculated and the values are 14, 23.59 and 1.37cP, respectively.
3.2. Effects Of Propofol On DMPC Unilamellar Liposomes
In DMPC unilamellar liposomes, ESR spectra were collected for incorporated stearic acids spin labelled at the fifth, twelve and sixteenth carbon positions. The S and !c parameters were measured at temperature above (25°C) and below (10°C) the gel-to-fluid transition temperature (23.9°C) of DMPC.
Microviscosity values at room temperature are displayed in Table 3. At this temperature, the DMPC liposomes are in the fluid state. In this condition, the microviscosity at the level of 5-DSA nitroxyl radical was calculated using S. For 12 and 16 DSA situated in the fluid region of the lipid bilayer, the microviscosity was calculated using !c.
The microviscosity of the three spin labels incorporated in DMPC liposomes at the gel state (10°C) are presented in table 3. These microviscosity values were calculated using S parameter.
The addition of PPF in DMPC at room temperature did not change S and !c parameters (data not shown).
We further investigated the variation of the microviscosity for different PPF concentrations (ranging from 0 to 10 mM) and at a temperature (10°C) below the gel-to-fluid state transition temperature of DMPC.
Microviscosity values presented in Fig. 5 were obtained by using the viscosity standard plots (Fig. 4), which enabled us to transform the ESR spectrum parameters into corresponding microviscosity value. Fig. 5 shows the influence of increasing PPF concentrations on the membrane microviscosity at 10 °C, in the presence of the three different spin labels 5-, 12- and 16-DSA. Addition of PPF at concentrations ranging from 10-3 to 510-2 M into DMPC liposomes containing 5-DSA provoked a rapid decrease of the microviscosity, in a concentration-dependent manner. At PPF concentration higher than 10-2 M, no further microviscosity decrease was observed (Fig. 5). When the experiment was performed in the presence of 16-DSA, PPF addition provoked a lower decrease in microviscosity, compared to that observed with 5- and 12-DSA. In both cases, addition of high PPF concentrations (from 10-2 to 5.10-2 M) did not affect the decrease in microviscosity as described above. The mean microviscosity values calculated at the different depths (C5, C12 and C16) were 260.21, 123.87 and 102.27 cP, respectively for the PPF concentration range from 10-2 to 5.10-2 M.
3.3. Effect Of PPF On DPPC Unilamellar Liposomes Probed By MC540
The lipophilic dye MC540 was used as a sensor of molecular events either in model membrane
systems or in biological membranes [22], because its absorption spectrum is very sensitive to the solubilizing surrounding properties. We used MC540 to monitor the effects of PPF in the lipid DPPC bilayer. The spectra of MC540 in the presence of DPPC liposomes at 16°C (gel state) showed a bulge at 501 nm and two peaks at 532 nm and 568 nm (Fig. 6). The phase transition
temperature of DPPC is 43.1 °C [23]. At 55°C, DPPC liposomes were in the fluid state. At this temperature, the spectrum obtained when adding MC540 to these liposomes showed one peak at 568 nm with a shoulder at 532 nm (Fig. 7). The spectrum of MC540 obtained after addition of PPF to DPPC liposomic dispersions at 16°C is shown in Fig. 8. Addition of PPF to DPPC/MC540 solution yielded a transformation of MC540 absorption spectrum (Figs. 6 and 8) similar to that induced by the temperature increase alone (Figs.6 and 7).
4. Discussion
The ESR spectra of 16-DSA in ethanol, with and without glycerol, and in DMPC liposome are shown in Fig. 3. The spectrum obtained in the presence of DMPC liposome is quite different from that of ethanol alone. When the nitroxide molecule can rotate rapidly and randomly then all the anisotropy averages out and a sharp three line spectrum is obtained as in the case of ethanol (Fig. 3.a). In the presence of the DMPC liposomes, the nitroxide apparently cannot rotate freely, suggesting its immobilization inside the liposome bilayer. The ESR spectrum of 16-DSA in DMPC liposome (Fig. 3.b) resembles the spectrum of the same probe in a mixture of 35% ethanol and 65% glycerol (Fig. 3.c). The spectra resemblance inferred that the mobility of nitroxide is restricted on the same way in glycerol-ethanol mixture and DMPC liposomes. The degree of mobility as monitored by the spectral anisotropy, which is calculated in terms of rotational correlation time and order parameter, can be correlated with the probe’s microviscosity [8]. Using this correlation, we established standard curves, and obtained for the first time a quantitative evaluation of local microviscosity. ESR S and !c parameters of fatty acid spin labels 5-, 12-, and 16-DSA were expressed as a function of a glycerol-ethanol mixture known viscosity. Then, these plots or their corresponding fitting formula enabled us to easily calculate the local microviscosity of any given solution from measured S and/or !c parameters. The measured microviscosity within SDS, CTAB
and 2-propanol cited proved to be consistent with values obtained by other techniques and reported in previous studies [24].
Spin-labeled stearic acids 5-, 12-, and 16-DSA have their nitroxyl group NO•
attached at various positions along the alkyl chain. In the DMPC unilamellar liposome bilayers, the three spin labels 5-, 12-, and 16-DSA are oriented with their long axes parallel to the phospholipid chains and NO• located at different positions on the carbon chain yielding information on the environment at different depths in the bilayer (7.8, 16.95 and 27.7 Å)[25]. Using measured S or !c (according to their degree of immobilization) of these spin labels, we were able to determine the microviscosity value at selected probe positions in liposome bilayer, using our standard viscosity curves or their corresponding fitted formula.
At 25°C, DMPC was in the fluid state and the measured microviscosity values at C5, C12, and C16 carbon position were 222.53, 64.09 and 62.56 cP respectively. However, at a temperature (10°C) below the phase-transition DMPC temperature (23.9°C), microviscosity values at the same positions were 472.56, 370.61 and 243.37 cP, respectively. These results clearly indicated that the central region of the lipid bilayer explored by 12-, and 16-DSA was more “fluid” than the hydrophobic region near the polar head groups explored by 5-DSA, which is in agreement with reported results [19]. We also showed that decreasing the temperature by 13°C below the DMPC phase-transition temperature (23.9°C) induced a large increase in the microviscosity: about 200 cP near polar head group (5-DSA) and about 150 cP at central region of the lipid bilayer (12-, and 16-DSA). It is important to note that 16-DSA may undergo vertical fluctuations in the liposomal membrane, reflecting flexibility of the fatty acid alkyl chain [21, 26, 27].
Using this method that makes possible to quantify the variations of local microviscosity, we have investigated the effect of incorporation of the anaesthetic agent PPF in DMPC liposomes on membrane microviscosity.
measuring a decrease in the order parameter [28]. Adding PPF (% 20 mM) in DMPC at 25°C, i.e. above the DMPC phase-transition temperature, did not change the local microviscosity. Obviously, the lipid matrices in the fluid state, can accommodate high (up to 20 mM) concentrations of the dopants without aggravating the disordered motions of the lipid chains, as previously reported [29]. In the gel state (10°C), the local microviscosity for n-DSA in DMPC liposomes was increased (Tab. 3). However, the incorporation of PPF into these liposomes caused a decrease in the microviscosity. This decrease was studied as a function of PPF concentration at constant DMPC concentration (7.4 $ 10-3 M). An increase in PPF concentration ranging from 0 to 1.0 $ 10-2 M induced a rapid decrease in microviscosity value (Fig. 5). Above 10-2 M PPF, no further decrease was observed and the local microviscosity at the depth C5, C12 and C16 averaged 260.88, 123.87 and 102.27 cP, respectively. Above 10-2 M PPF concentration, any additional amount of PPF seems to remain outside the unilamellar vesicles. Therefore, 10-2 M PPF concentration appears as the saturation limit of PPF in DMPC liposomes. PPF clearly increases the membrane fluidity (Fig. 5). We also found that, at the depth of 5- and 12-DSA, PPF exhibited a higher effect on the membrane microviscosity, compared to that observed at others depths. This discrepancy can be explained by the fact that PPF can act either with fatty acids within liposomes or aqueous molecules. Indeed, PPF can easily cross membranes, given its high lipophilicity, [30]. However, it can also establish hydrogen bonds based on the interactions between its phenolic hydroxyl group and carbonyl oxygen or hydroxyl group coming from aqueous solvent and other molecules within liposome bilayers. Consequently, the strong microviscosity decrease observed in the presence of C5 label is due to the fact that this label is located at the inner membrane and hydrogen bonds keep PPF near the outside membrane. Therefore, we showed that PPF can also act at other sites even if the most likely targets for general anaesthetics are thought to be neuronal ion channels, especially integral membrane proteins (GABA A receptors)[31].
Merocyanine 540 (MC540) is a photosensitizer used in the field of photodynamic therapy [32, 33] which has also been extensively employed as sensor of transmembrane potential [34, 35] and
lipid packing [36]. It is a solvatochromic dye whose absorption spectrum shifts with polarity [34, 35, 37]. As many amphipathic molecules, it has a strong tendency to dimerize in aqueous solutions [26]. The absorption spectrum of the dye in water has a double-banded structure (501 and 533 nm) and the extinction coefficient is concentration dependent, indicating dimerization of the dye [38]. In lipid bilayers, MC540 is located at the membrane interfacial region under dimeric and monomeric forms [36, 39]. It has been shown that MC540 binding is influenced by the degree of lipid packing in the bilayer and that the dimerization equilibrium is sensitive to liposome curvature, composition, phase state and packing [39, 40]. MC540 binds preferentially to membranes with loosely packed lipids and binds to fluid-phase vesicles rather than to gel-phase vesicles. This MC540 property can be used to monitor the viscosity modifications induced by PPF inside liposome bilayers. Indeed, in fluid-phase vesicles, the dye molecules have an absorption spectrum characteristic of molecules in a hydrophobic environment. In contrast, at a similar concentration in gel-phase vesicles, the absorption spectrum changes and reflects molecules in aqueous solvent [22, 41].
Increasing temperature above the phase transition temperature of DPPC leads to a change in vesicule, from gel-state to fluid state [42]. The modification of the bilayer fluid state can be monitored using MC540 absorption spectrum change (Fig. 6, and 7). Indeed when DPPC bilayer is heated to 55°C, the 501 nm bulge and the peak at 533 nm disappear. This behaviour is indicative of the penetration of dye into the unilamellar liposomes when the bilayer goes through the phase transition [43]. These results are in good agreement with the literature [36].
The disappearance of the bulge at 501 nm and the peak at 533 nm was also seen when PPF was added to MC540/DPPC solution in the gel state. The comparison of the spectra of figures 7 and 8 allows us to infer that MC540 spectra obtained when PPF is added to dye/liposome solution maintained below the phase transition are similar to the spectrum observed when the temperature of DPPC liposomes is increased above the transition temperature without adding PPF. This result confirms qualitatively our ESR results showing that PPF induces a modification in the membrane fluidity.
In conclusion, the methodology developed in this work seems to be adequate for studying microviscosity at different depths inside liposome membrane or micellar solution. Microviscosity change induced by drug addition or by temperature can be monitored.
Acknowledgment
References
[1] Yguerabide, J., and Foster, M. C., Fluorescence spectroscopy of biological membranes, Molecular Biology, Biochemistry and Biophysics, 31,(1981) 199-269.
[2] Grieser, F., Lay, M., and Thistlethwaite, P. J., Excited-state torsional relaxation in 1,1'-dihexyl-3,3,3',3'-tetramethylindocarbocyanine iodide: application to the probing of micelle structure, Journal of Physical Chemistry, 89,(1985) 2065-70.
[3] Viriot, M. L., Bouchy, M., Donner, M., and Andre, J. C., Kinetics of partly diffusion-controlled reactions. XII. Intramolecular excimers as fluorescent probes of the 'microviscosity' of living cells, Photobiochemistry and Photobiophysics, 5,(1983) 293-306.
[4] Law, K. Y., Fluorescence probe for microenvironments: a new probe for micelle solvent parameters and premicellar aggregates, Photochemistry and Photobiology, 33,(1981) 799-806.
[5] Thomas, J. K., Radiation-induced reactions in organized assemblies, Chemical Reviews (Washington, DC, United States), 80,(1980) 283-99.
[6] Kung, C. E. R., Juta K., Microviscosity measurements of phospholipid bilayers using
fluorescent dyes that undergo torsional relaxation., Biochemistry, 25(20),(1986) 6114-21. [7] Deo, N. S., P., Electron spin resonance study of phosphatidyl choline vesicles using 5-doxyl
stearic acid., Colloids and Surfaces, B: Biointerfaces, 25,(2002) 225-232.
[8] Chandar, P. S., P.; Waterman, Kenneth C.; Turro, Nicholas J., Variation in nitroxide probe chain flexibility within sodium dodecyl sulfate hemimicelles., Journal of Physical Chemistry, 91,(1987) 148-50.
[9] James, R., and Glen, J. B., Synthesis, biological evaluation, and preliminary structure-activity considerations of a series of alkylphenols as intravenous anesthetic agents, Journal of Medicinal Chemistry, 23,(1980) 1350-7.
[10] Reitz, M., Velizarov, S., Glueck, B., Berg, H., and Brambrink, A. M., Effects of propofol (intravenous propofol emulsion) on cell membranes measured by electrofusion and electroporation, Arzneimittel-Forschung, 49,(1999) 281-285.
[11] Balasubramanian Sathyamangalam, V., Campbell Robert, B., and Straubinger Robert, M., Propofol, a general anesthetic, promotes the formation of fluid phase domains in model membranes, Chemistry and Physics of Lipids, 114,(2002) 35-44.
[12] Momo, F., Fabris, S., Bindoli, A., Scutari, G., and Stevanato, R., Different effects of propofol and nitrosopropofol on DMPC multilamellar liposomes, Biophysical Chemistry, 95,(2002) 145-155.
[13] Chapman, D., Williams, R. M., and Ladbrooke, B. D., Physical studies of phospholipids. VI. Thermotropic and lyotropic mesomorphism of some 1,2-diacylphosphatidylcholines (lecithins), Chemistry and Physics of Lipids, 1,(1967) 445-75.
[14] Olson, F., Hunt, C. A., Szoka, F. C., Vail, W. J., and Papahadjopoulos, D., Preparation of liposomes of defined size distribution by extrusion through polycarbonate membranes., Biochimica et Biophysica Acta, 557,(1979) 9-23.
[15] Hope, M. J., Bally, M. B., Webb, G., and Cullis, P. R., Production of large unilamellar vesicles by a rapid extrusion procedure. Characterization of size distribution, trapped volume and ability to maintain a membrane potential., Biochimica et Biophysica Acta, 812(1),(1985) 55-65.
[16] Glasstone, S., TEXTBOOK OF PHYSICAL CHEMISTRY, Second edition, (1946). [17] Lide, D. R., HANDBOOK OF CHEMISTRY AND PHYSICS, 85 th Edition, CRC Press,
(2004-2005).
[18] Henry, S. A., and Keith, A. D., Membrane properties of saturated fatty acid mutants of yeast revealed by spin labels, Chemistry and Physics of Lipids, 7,(1971) 245-65.
[19] McConnell, H. M., and Hubbell, W. L., Molecular motion in spin-labeled phospholipids and membranes, Journal of the American Chemical Society, 93,(1971) 314-26.
[21] M. Hoebeke, A. Seret, and Vorst, J. P. a. A. V. d., Destruction of stearic acid nitroxyl radicals mediated by photoexcited merocyanine 540 in liposomal and micellar systems.,
Biochemistry, 32,(1993) 2730-2736.
[22] Sikurova, L., Frankova, R., and Chorvat, D., Dimers of merocyanine 540. III. In dimyristoyl lecithin liposomes, Studia Biophysica, 133,(1989) 67-72.
[23] Chapman, D., Phase transitions and fluidity characteristics of lipids and cell membranes., Quarterly Reviews of Biophysics, 8,(1975) 185-235.
[24] Pownall, H. J. S., Louis C., Viscosity of the hydrocarbon region of micelles. Measurement by excimer fluorescence, Journal of the American Chemical Society, 95,(1973) 3136-40. [25] Jost, P., Libertini, L. J., Hebert, V. C., and Griffith, O. H., Lipid spin labels in lecithin
multilayers. Motion along fatty acid chains., Journal of Molecular Biology, 59(1),(1971) 77-98.
[26] Dixit, N. S., and Mackay, R. A., Absorption and emission characteristics of merocyanine 540 in microemulsions, Journal of the American Chemical Society, 105,(1983) 2928-9.
[27] Feix, J. B., Popp, C. A., Venkataramu, S. D., Beth, A. H., Park, J. H., and Hyde, J. S., An electron-electron double-resonance study of interactions between [14N]- and [15N]stearic acid spin-label pairs: lateral diffusion and vertical fluctuations in
dimyristoylphosphatidylcholine., Biochemistry, 23,(1984) 2293-9.
[28] Kalenak, A., McKenzie, R. J., and Conover, T. E., Response of the electrochromic dye, merocyanine 540, to membrane potential in rat liver mitochondria, Journal of Membrane Biology, 123,(1991) 23-31.
[29] Surewicz, W. K., and Leyko, W., Interaction of propranolol with model phospholipid membranes. Monolayer, spin label and fluorescent spectroscopy studies, Biochimica Et Biophysica Acta, 643,(1981) 387-97.
[30] Glen, J. B., and Hunter, S. C., Pharmacology of an emulsion formulation of ICI 35 868., British journal of anaesthesia, 56,(1984) 617-26.
[31] Franks, N. P., and Lieb, W. R., Molecular and cellular mechanisms of general anesthesia., Nature (London, United Kingdom), 367,(1994).
[32] Feix, J. B., Kalyanaraman, B., Chignell, C. F., and Hall, R. D., Direct observation of singlet oxygen production by merocyanine 540 associated with phosphatidylcholine liposomes, Journal of Biological Chemistry, 263,(1988) 17247-50.
[33] Hoebeke, M., Piette, J., and Van de Vorst, A., Photosensitized production of singlet oxygen by merocyanine 540 bound to liposomes, Journal of Photochemistry and Photobiology, B: Biology, 9,(1991) 281-94.
[34] Lelkes, P. I., Potential dependent rigidity changes in lipid membrane vesicles, Biochemical and Biophysical Research Communications, 90,(1979) 656-62.
[35] Lelkes, P. I., and Miller, I. R., Perturbations of membrane structure by optical probes: I. Location and structural sensitivity of merocyanine 540 bound to phospholipid membranes, Journal of Membrane Biology, 52,(1980) 1-15.
[36] Bernik, D. L., and Disalvo, E. A., Gel state surface properties of phosphatidylcholine
liposomes as measured with merocyanine 540, Biochimica et Biophysica Acta, 1146,(1993) 169-77.
[37] Reichardt, C., Solvatochromic Dyes as Solvent Polarity Indicators, Chemical Reviews (Washington, DC, United States), 94,(1994) 2319-58.
[38] Ehrenberg, B., and Pevzner, E., Spectroscopic properties of the potentiometric probe merocyanine-540 in solutions and in liposomes, Photochemistry and Photobiology, 57,(1993) 228-34.
[39] Bernik, D. L., and Disalvo, E. A., Determination of the dimerization constant of merocyanine 540 at the membrane interface of lipid vesicles in the gel state, Chemistry and Physics of Lipids, 82,(1996) 111-123.
[41] Sikurova, L., Haban, I., and Chorvat, D., Dimers of merocyanine 540. I. In aqueous solutions, Studia Biophysica, 125,(1988) 197-201.
[42] Gregoriadis, G., Liposme Technology, Preparation Of Liposomes, Vol. I, 1984). [43] Biondi, A. C., and Disalvo, E. A., Effect of glycerol on the interfacial properties of
dipalmitoylphosphatidylcholine liposomes as measured with merocyanine 540, Biochimica Et Biophysica Acta, 1028,(1990) 43-8.
Table 1. Viscosity and density of glycerol-ethanol mixtures at room temperature. Percent of glycerol in ethanol. 0 25 30 40 50 60 70 75 80 100 Density 0.785 0.926 0.944 0.993 1.041 1.090 1.130 1.153 1.173 1.256 Viscosity (cP) 1.083 4.689 5.987 11.523 23.775 51.482 112.133 129.105 171.133 945.00
Table 2. Fitted formula of viscosity curves of glycerol/ethanol mixture for the three spin labels.
Table 3. Viscosity of DMPC liposomes at three different bilayer depths and at two different temperatures.
Spin label
position Correlation time (!c) vs. viscosity (_) Order parameter (S) vs. viscosity (_) 5-DSA _ = 0.0357!c2 +1.1411! c – 1.6844 _ = 672.16S 2 + 371.47S – 284.38 12-DSA _ = 0.0381!c 2 + 2.251 !c – 4.1345 _ = 1562.4S 2 + 1251.40S + 301.49 16-DSA _ = 0.0838!c2 + 6.5755! c – 4.5234 _ = 11861S 2 – 2607.30S + 242.91
n-DSA in liposome Viscosity (cP) at 25°C Viscosity (cP) at 10°C
5-DSA 222.53 472.56
12-DSA 64.09 370.61
Figure captions:
Fig. 1. Chemical structure of 2,6-diisopropylphenol (propofol).
Fig. 2. Viscosity vs. percent of glycerol (Pgly) in glycerol-ethanol mixture.
Fig. 3. ESR spectra of 16-DSA in a) ethanol, b) in DMPC liposome at 25° C and c) in a mixture of 35% ethanol and 65% glycerol.
Fig. 4. a) Viscosity vs. S-parameter in glycerol-ethanol mixture with 5-DSA at increasing glycerol percentage content (Pgly & 65 %). b) Viscosity vs. correlation time (!c) in glycerol-ethanol mixture with 5-DSA at increasing glycerol percentage content (Pgly % 60 %).
Fig. 5. Viscosity values vs. PPF concentration for different spin label ( + 5-DSA,
*
12-DSA, ' 16-DSA) in DMPC (1.7 10-3M) at 10°C.Fig. 6. Absorption spectra of MC540 (10-5 M) in DPPC (1.7 10-3 M) liposome at 16°C. Fig. 7. Absorption spectra of MC540 (10-5 M) in DPPC (1.7 10-3 M) liposome at 55° C.
Fig. 8. Absorption spectra of MC540 (10-5 M) in DPPC (1.7 10-3 M) liposome after addition of PPF (10-2 M) at 16°C.
Fig. 1. Fig. 2. ? = 0.8747e0.0677Pgly (%) 0 100 200 300 400 500 600 700 800 900 1000 0 20 40 60 80 100 120 Pgly (%) ? (cP) Fig. 3.
Fig. 5.
Fig. 7.