Design of the cryo-optical test of the Planck reflectors
S. Roose, A. Cucchiaro & D. de Chambure*Centre Spatial de Liège, Avenue du Pré-Aily, B-4031 Angleur-Liège, Belgium
*ESTEC, Planck project, Keplerlaan 1, P.O. Box 299, NL-2200 AG Noordwijk ZH, the Netherlands Abstract
PLANCK is the third Medium size mission of the ESA long-term scientific plan Horizon 2000. This paper present the current design status of the design of the cryo-optical test for the Planck primary reflector and Planck
secondary reflector
1.Introduction: the test objectives
PLANCK is the third Medium size mission of the ESA long-term scientific plan Horizon 2000. The objective of the PLANCK mission is to image over the whole sky the temperature anisotropies of the cosmic background radiation. To achieve this objective, the whole sky will be mapped in nine frequency channels ranging between wavelengths of 333 µm (900 GHz) and 12 mm (25 GHz).
The present concept for PLANCK is based on an off-axis telescope with a circular projected aperture of 1.5 m. The PLANCK reflectors are 2 CFRP off -axis ellipsoids to be tested separately (Secondary reflector: 1050 mm x 1100 mm and Primary reflector: 1550 mm x 1890 mm). The cryogenic tests of the reflectors will be done in CSL.
One of the test objectives is the measurement of the changes of the surface figure error (SFE) with respect to the best ellipsoid, between 293 K and 40 K, with a 1 µm RMS accuracy. Therefore, the measurement instrument needs to have a resolution better than 1 µm RMS. The second objective is the focus position change measurement, with an accuracy of 20 µm. The Primary reflector inter-focal distance is 21 m.
Preliminary assessments have shown that only few practical methods can be used to measure both SFE and focus changes at the same time. CSL has proposed to use a wave-front measurement method [1, 2], to be used in stigmatic configuration.
Thermal shroud
Primary reflector
Convex spherical mirror Lens Laser Reflector Thermal shroud Lens Lens To measurement device
Figure 1. Stigmatic test configuration proposed for the primary reflector test (double pass) and secondary reflector test (single pass).
After a review of the surface figure error requirements, the feasibility to measure surface error with infrared interferometry is presented. A back-up solution based on a Hartmann test is given as well. The advantages and the limitations of the 2 IR methods are discussed. Finally, one concludes with the test configurations and the global set-ups description.
2.Surface error measurement: the challenges
Specified SFE are maximum 50 µm RMS, which is in the capabilities of most wave-front sensing devices.
The surface roughness of both reflectors optical faces shall be Rq < 0.2 µm RMS at any scales up to 0.8 mm. This obliges us to work with infrared light in order to limit scattering.
The surface roughness of both the PR and SR reflectors optical faces shall be: Rq < 2.0 µm RMS at any scales up to 10 mm.
The surfaces of the reflectors shall not present medium frequencies periodic or quasi periodic structures (core print-through) with an amplitude larger than ± 2 µm.
All these specifications are given as RMS amplitude of the deformations, which satisfies the scientific needs of the Planck mission, but none of them gives the spatial spectrum of the deformations. The spatial spectrum and the amplitude characterise the SFE slopes. The wave-front-slopes are an important parameter in designing wave-front sensing devices, because these devices are inherently slope limited.
One expects the wave-front to have following contributors:
• -Reflector SFE at room temperature (manufacturing error) x 2 for a reflector (or x 4 for a reflector measured in double pass): slopes not specified
• -Reflector change of SFE from room temperature to cryogenic temperature (or x 4 for a reflector measured in double pass): slopes not predicted in detail. CSL estimates 2 mrad peak-to-valley on very small areas, dominated by the core-cell print-through
• -Interferometer absolute wave-front error: slope estimate < 0.01 mrad RMS
• -Alignment errors at room temperature and cryogenic temperature: slope estimate < 0.01 mrad RMS
In order to assess the measurement feasibility, one has constructed artificial wave-fronts based on metrology data of the SFE of the reflectors mould and on modelisation of the core-cell print-through. 3.Infrared interferometry
An interferometer makes pictures of interference fringes and retrieves the wave-front error from these fringe patterns [1]. (Commercial) Infrared interferometers have generally the following characteristics
• -SFE is hidden in the wave-front measured by the interferometer
• -operational wavelength:10.6 µm
• -WFE resolution < 1 µm
• -high wave-front sampling rate (detector resolution): 320 x 240
• -increased resolution possible with sub-aperture stitching
• -wave-front slope limitation: l wavelength per 4 pixels
• -slope limitation translated at reflector level (SFE slopes): 0.1 mrad (PR), 0.2 mrad (SR).
In order to assess the feasibility, one needs to simulate the interference fringes, followed by the acquisition by a detector with a finite number of pixels. It is assumed that the full reflector aperture is imaged on the detector.
The WFE has been over-sampled in 1024 by 1024 points. The interferogram has been computed for a wavelength of 10.6 µm, which is the wavelength of CSL's PYRIS phase shifting infrared interferometer. The interferogram intensity integration over the pixels (440 by 440) has been performed (Figure 2). Areas with too high slopes do not generate a fringe pattern. The fringe modulation is zero. It gives local grey image.
Figure 2. Simulated interferogram of the secondary reflector WFE (2 x SFE) at 10.6 µm. The reconstructed SFE from the interferogram (440 x440 pixels).
Figure 2 shows also the SFE retrieved from the interferogram. 90% of the SR is measurable with an infrared interferometer with a standard 320 x 240 pixels detector, provided that one uses stitched sub-aperture measurements, as proposed in similar cryo-optical test on CFRP reflectors [3, 4].
Figure 3. Simulated interferogram of the primary reflector WFE (4 x SFE) at 9 µm. The reconstructed SFE from the interferogram (800 x 800 pixels).
Figure 3 shows that about 800 x 800 pixels are required to resolve the interference fringes correctly of the primary reflector SFE. The slopes are limited to 0.1 mrad. Although, it is still in the capabilities of sub-aperture stitching, CSL is currently envisaging the use of a high-resolution infrared interferometer based on a 512 x 512 pixels detector working at 9 µm wavelength.
4.Dynamic Hartmann test
4.1 Parametric study
A Hartmann device measures immediately the slopes of a wave-front [2]. A simplified principle is shown in Figure 4. σ d c Wavefront Pinhole Array Detector-array δpixel pixel subapertures N N 2
Figure 4. Parameter definition in a Hartmann test. The characteristics of the Hartmann method are:
• wave-front slope measurement method
• slope dynamic range scalable (at the price of sampling rate)
• centroid precision 0.1 pixel (for 0.02 mrad)
• dynamic range of 10 pixel (for 2 mrad)
• sampling rate: 24 (for a 320 by 240 pixel camera)
The sampling rate is not sufficient for SFE measurement. A parametric study shows (Figure 5) that at least 64 x64 point are needed for the secondary reflectors and 100 by 100 for the primary reflector. The sampling rate is mainly driven by the periodic core-cell print-through [5]. Typically, 4 samples are needed per cell.
Figure 5. SFE reconstruction for secondary reflector (based on 64 x 64 samples) and primary reflector (based on 100 x 100 samples).
In order to by-pass the shortcomings of the standard Hartmann method, a dynamic Hartmann method is proposed. σ d c Wavefront
Moving Pinhole Array
Detector-array
Figure 6. Parameter definition in a dynamic Hartmann test.
In a dynamic Hartmann test, the sampling rate is not constrained by the dynamic range. The full-detector area can be used. The price to pay is the duration of an acquisition. 100 by 100 pictures will require 10000 image to be taken. Even with an automated procedure for movement of the pinhole and automated of centroid search (without saving the image on hard-disk): 10 seconds per image. A full acquisition would last more than 24 h.
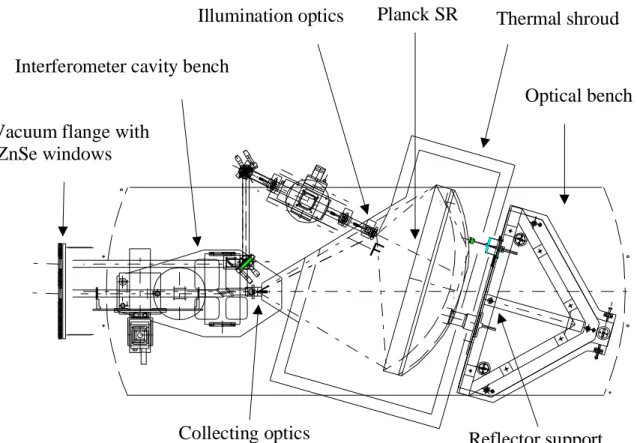
5.Secondary reflector test configuration
The secondary reflector cryo-optical test set-up will be mounted in the FOCAL 3 facility at CSL (Figure 7). The test configuration is a single pass configuration. Interferometer camera and laser are outside the vacuum chamber; Light will be injected in the focus with smallest F-number (F/0.33). The optics is mounted on 3 DOF support for positioning of the lens in focus. All the optics is mounted outside the cryogenic box.
The light will be collected on the focus with largest Fnumber (F/0.66). This choice has been made in -order to relax optical design complexity: lens with the smallest F-number has no field. Aspheric, ZnSe lenses will be used for reflector illumination and light collection.
The residual field aberration (Only field aberrations are relevant for our measurements) in the system due to the auxillary optics is better than 0.33 µm RMS WFE.
The interferometric cavity is mounted on 5 DOF table.
The metrology for focus search is based on the following items:
1) LVDTs to measure secondary reflector I/F with respect to the CSL I/F (uncertainty <10 µm) 2) T° regulation of optical bench and supports (<0.2 K) gives (uncertainty <5 µm)
O M2 O M2C
F
Thermal shroud
Reflector support
Illumination optics
Interferometer cavity bench
Planck SR
Collecting optics
Optical bench
Vacuum flange with
ZnSe windows
Figure 7. Test set-up for the cryo-optical test of the secondary reflector.
6.Primary reflector test configuration
The primary reflector test set-up will be mounted in the upgraded FOCAL X facility at CSL. The test configuration of the primary reflector (Figure 8) has imposed the use of a double pass configuration. Because, one focus is at 21 m distance, the use of a convex spherical mirror (diameter 1500 mm) with a virtual focus at about 20 m needed.
After several trade-offs, it has been concluded that the convex mirror needs to be put in the cryogenic environment, and this in order to limit in as much perturbation of the thermal equilibrium and to increase cool-down speed of the primary reflector.
A feasibility study has demonstrated that an Aluminium Al 5083 could be used for this purpose. Special care will be taken in order homogenise the CTE of the convex mirror (AFNORM stechiometric non-uniformity of 1%). Predictions foresee a wave-front error of 1 µm for a worst case 5% CTE in-homogeneity, induced by this mirror on the measurement
The set-up is a double pass configuration, light is entering and returning through the same path. The optical design is slightly simplified, but the slopes are increased by a factor 2.
Interferometer camera and laser are outside vacuum chamber, and the inteferometric cavity is mounted on 5 DOF support outside the cryogenic box.
The convex spherical mirror (Diameter 1500 mm) is inside the cryogenic box. The 3 DOF mount is outside this box.
The metrology for focus search is based on
1) LVDTs to measure PR I/F wrt CSL I/F (uncertainty<10 µm)
2) T° regulation of optical bench and supports (uncertainty<0.2 K) (uncertainty<5 µm) 3) stigmatic image (minimize WFE):(uncertainty<2 µm)
4) in situ radius measurement of contraction of spherical mirror in order to derive the changes in radius of curvature: (uncertainty<0.1 ppm) ) or (uncertainty<3 µm)
Planck PR Vacuum flange with
ZnSe optical windows
Interferometric cavity bench
Thermal shroud
Convex spherical mirror
Figure 8. Test set-up for the cryo-optical test of the primary reflector
7.Reflector cool down
The cryo-optical test needs to measure the SFE between room temperature and operational temperature (40 K). Both reflectors will be cooled by radiative exchange. Consequently, the cool-down will be slow (minimum 72 h) (Figure 9), especially near equilibrium (asymptote) which is dependent on the permanent heat losses (optical apertures) and the emissivity of the front face sheet. No conductive heat exchange is allowed via the mechanical attachment points. Specific thermally regulated interfaces are designed. In order to lower the conductivity, INVAR will be selected as material.
Se condary re fle ctor cool down
0 40 80 120 160 200 240 280 320 0 20 40 60 80 100 Ti me (h) T e m p era tu re ( K ) Secondary reflector
Primary reflector cool down
0 40 80 120 160 200 240 280 320 0 20 40 60 80 100 Time (h) T em p erat u re ( K )
Convex spherical mirror Primary reflector
Figure 9. Cool-down predictions for secondary and primary reflector test
8.Conclusions
The secondary reflector test is foreseen in July 2003 and test procedures, AIV plan are currently in progress. The primary reflector test is foreseen in December 2003. Critical items for the test are the high resolution infrared interferometer which is currently in design and the spherical convex mirror.
9.Acknowledgements
We have appreciated the support of ASTRIUM Ghmbh (Friedrichshafen), which has provided the SFE inputs of mould and for deformations at 30 K.
10.References
1. Optical Shop Testing, D. Malacara, Wiley and Sons, January 1992. 2. "Introduction to Wavefront Sensors", J. Geary, SPIE Press, June 1995.
3. B. Catanzaro et al. “Comparison of full-aperture interferometry to sub-aperture stitched interferometry for a large diameter fast mirror” Proc. SPIE 4444, Aug 2001.
4. B. Catanzaro et al. “Cryogenic (70K) measurement of an all-composite 2-meter diameter mirror”, Proc. SPIE 4444, Aug 2001.
5. Brian Catanzaro et al. "Optical Metrology for Testing an All-Composite 2-Meter Diameter Mirror" Proc. SPIE 4444, Aug 2001.
Presentation made at the "First International Workshop on Test Philosophies, Standards, Methods and Quality for Space Systems", Torino, 18-19 March 2003.