Reining in Excessive Risk Taking by Executives: The Effect of
Accountability
Mathieu Lefebvre
University of Liège, CREPP; Boulevard du Rectorat, 7 Bâtiment 31, boîte 39, 4000 Liège, Belgium.
and
Ferdinand M. Vieider
*WZB, Reichpietschufer 50, 10785 Berlin, Germany
19 July 2012
Abstract
Performance-contingent compensation by means of stock options may induce risk taking in agents that is excessive from the point of view of the company or the shareholders. We test whether increasing shareholder control may be an effective checking mechanism to rein in such excessive risk taking. We thus tell one group of experimental CEOs that they may have to justify their decision making processes in front of their shareholders. This indeed reduces risk taking and increases the performance of the companies they manage. Implications are discussed.
Keywords: executive compensation; stock-options; incentives; accountability; risk taking JEL Classification: D03, G28, G32, J33, L22
1. Motivation
Traditional financial agency literature has long tried to address the question of how to induce optimal levels of risk taking in executives. The focus thereby has often been on how to increase the risk appetite of naturally risk averse agents (Agrawal and Mandelker, 1987; Feltham and Wu, 2001). Following the recent financial crisis, however, the focus has shifted to how to limit risk taking on the side of executives and financial managers when such risk taking is excessive from the point of view of shareholders or the company (Bebchuk et al., 2010).
The microeconomic agency literature has generally emphasized an approach that is based on judging performance by the outcome achieved, which is institutionalized by tying pay to
performance. A large body of evidence from the psychology literature, however, points out how holding people accountable purely for the outcomes they achieve—or rewarding them purely based on the outcomes they produce—may be suboptimal in cases where outcomes depend to a large extent on chance as well as skill (Baron and Hershey, 1988; Mauboussin, 2010; Tetlock, Vieider, and Grant, 2011). There is also some evidence in the economics literature that executives are often rewarded for luck rather than skill (Bertrand and Mullainathan, 2001).
A better system in such cases may be to hold executives accountable for their decision making process (Lerner and Tetlock, 1999)—something that has received hardly any attention in the microeconomic literature. Such systems have, however, been discussed in the management and organizational literature, where they are known under the name of “behavioral monitoring” (Ouchi and Maguire, 1975). Such monitoring can have positive effects inasmuch as “it relieves managers of achieving outcomes they can only partially influence, and instead focuses evaluation on means, which are assumed to be objectively and accurately assessed” (Wiseman and Gomez-Majia, 1998, p. 144).
We conduct an experiment to test the effectiveness of process accountability as a means to rein in excessive risk taking by executives. Experimental executives' pay is thereby linked to
performance through stock options to reflect currently widely diffused performance-contingent pay practices.1 Experimental executives are given a choice between two investment options to invest total company assets in every period—a high volatility investment and a low volatility investment. By design, the high volatility investment is always inferior in terms of expected value in order to test whether excessive risk taking will occur, and to what extent it may be reduced by introducing an additional process accountability requirement. Even though our experimental environment is highly stylized and the results may thus not be immediately generalizable to the real world, our results provide an indication that introducing an institutionalized accountability mechanism, consisting in the requirement for executives to potentially justify their decisions in front of a shareholder reunion, may be effective in reducing excessive risk taking, thus improving company performance.
The paper proceeds as follows. Section 2 discusses the nature of the principal-agent problem and the relevant accountability literature. Section 3 describes the experiment, with 3.1 providing an overview of the experimental design and 3.2 presenting the results. Section 4 discusses the results and section 5 concludes this paper.
2. Increasing Accountability of Executives towards Shareholders
One of the reasons why executives may take actions that are not fully in the interest of the shareholders is that the original principal-agent relationship has been substituted with a weaker surrogate relation. The so-called managerial power approach shows how there may be an issue in the fundamental structure of the principal-agent relationship postulated by traditional agency theory. Indeed, the board seems to hold most of the powers theoretically attributed to the principal, while in practice its interests may often be closer to those of the agent (Bebchuk and Fried, 2003; Bebchuk et al. 2002). This suggests that increasing the institutional power of the original principal—the
shareholder reunion—in the principal-agent relationship vis-à-vis the executive may improve the
control exerted on the executive's actions. Empirically, the presence of large shareholders has been found to be associated with lower executive pay and better performance (Cyert et al., 2002). And the influence of such large shareholders seems to be particularly strong when they are present on the board, which increases their institutional standing (Bertrand and Mullainathan, 2001).
Purely outcome-based monitoring systems and rewards may be especially tricky when performance-contingent pay assumes non-linear forms such as compensation through stock options. Indeed, under such compensation schemes risks affect executives and shareholders differently. While executives are rewarded for increases in stock prices and sheltered from losses (Feltham and Wu, 2001), shareholders are exposed to the whole spectrum of stock-price movements. This has been justified traditionally with the idea that linear compensation of executives—which would thus equalize their incentive structure with the one of shareholders themselves—may induce excessive risk aversion. This argument, however, relies on the assumptions of executives being risk averse expected utility maximizers—an assumption that has been shown to be far from innocent and that is generally not supported empirically (Fiegenbaum, 1990; Wiseman and Gomez-Majia, 1998;
Lefebvre and Vieider, 2011).
Recent empirical findings on decisions when the decision maker is responsible for others as well as herself indicate a cautious shift phenomenon, whereby people tend to exhibit increased risk aversion when deciding for others as well as themselves (Charness and Jackson, 2009). While in our experiment executives are always responsible for others' payoffs as well as their own, we may expect a cautious shift tendency when subjects anticipate the possibility of having to justify their decisions to those others who depend on them. There may, however, also be tendencies in the opposite direction. Pahlke, Strasser, & Vieider (2012) found that loss aversion is reduced under responsibility for somebody else if the decision maker may explicitly justify her choices in front of the recipient, thereby replicating an earlier finding in individual decision making (Vieider, 2009). Furthermore, Sutter (2009) found that payoff commonality, i.e. dividing the payoff between the
decision maker and other group members, was sufficient to increase investment into a risky asset with positive expected returns relative to an individual baseline.
It is, however, not immediately evident how such findings would transfer to the present situation. On the one hand, high volatility investments in our experimental design are always
inferior in terms of expected value, while the investment had positive expected value in Sutter
(2009) and the two options were monetarily equivalent in Pahlke, Strasser, & Vieider (2012). On the other hand, given the asymmetry in payoff mechanisms between executives and shareholders, it may be optimal for executives to take high levels of risk even when such risk-taking involves choosing investment opportunities with relatively low expected value. For shareholders, to the contrary, such risk taking will always be suboptimal in our experiment, so that a conflict between private motives and responsibility for shareholders is likely to emerge.
This in turn makes our accountability manipulation somewhat special. Indeed, most accountability manipulations in social psychology regard individual decisions. In the present setting, however, there may be an additional element of moral hazard, with executives deciding in their own interest when their actions are not observable. The experiment is thus related to a strand of literature mainly in economics, in which decisions that affect the decision maker as well as others are made visible to the group—e.g. donations in a dictator game (Hoffman et al., 1996) or
contributions in a public goods game (De Cremer et al., 2001; Rege and Telle, 2004). The latter studies generally manipulate a kind of implicit accountability, without the need or the opportunity for the decision maker to explain the reasons behind her choices—a manipulation that has generally been found to be particularly strong and to lead to better decision making processes (Lerner and Tetlock, 1999).
Given the discussion above, we hypothesize that unaccountable executives will try and maximize their own payoffs, regardless of shareholder interest. When accountable, however, executives will feel a conflict between maximizing their own payoff and maximizing shareholder
payoff. This also means that executives will sacrifice some of their profits when accountable so as to increase shareholder value and to make their decisions more easy to justify.
3. The Experiment
3.1 Experimental Design
Subjects. 78 subjects were recruited from a list of experimental subjects maintained at GATE,
University of Lyon, France, using the ORSEE software (Greiner, 2004). Groups of six subjects needed to be formed, so that all sessions were run with either 12 or 18 subjects each. Subjects had an average age of 22 years, and 58% of subjects were female. 78% were studying economics or business management, and 22% mathematics or engineering.
Task. In the main part of the experiment, groups of six subjects are formed. The composition of the
groups is kept fixed for the 15 periods, and subjects do not know who they are matched to. At the outset of the experiment, each group member is assigned the role of CEO of one company. In their function of CEO of a company, subjects are confronted with a sequence of investment decisions over 15 periods. In each period, the CEO decides between two investment opportunities into which to invest the total stock of company assets (screenshots in appendix A). The initial stock value of the company is €100 ($150) for everyone. The final value of the company will be determined by the outcome of the 15 investment decisions.2 At the same time, each group member also acts as
shareholder in the five other companies managed by the five other subjects in her group. The shareholder role is a passive role, in the sense that it does not require any action from the subject (except at the very end in the accountability treatments, see below). However, it contributes towards final payoffs in the following way. Each subject is given one share with the initial value of €1
2 Please note that any change in share prices in our experimental model are generated purely by changes in the underlying value of the company assets as determined by investment outcomes—potential reactions by shareholders to option plans or to differences in risk taking by the CEO are not captured inasmuch as there is no market for shares.
($1.50) in each of the other five companies in her group. She is then paid the final value of that share (total company value divided by 100) at the end of the 15 periods. The main part of the experiment lasted about 30-40 minutes. The experiment was conducted using the REGATE software (Zeiliger, 2000) .
Investment Decisions. In each period, the CEO has to choose between two investment opportunities
in which to invest total company assets. The investment opportunities (prospects) are described in terms of percentage increases or decreases of the company’s value. Investments are displayed graphically by means of pie-charts representing the probabilities of winning and losing in addition to a verbal description. The choice is always between a high volatility (HV) and a low volatility (LV) prospect. The LV prospect always offers a higher expected value than the HV prospect, so that any risk taking observed is excessive from the point of view of the company or the shareholders by definition, inasmuch as it delivers a lower expected value. Indeed, differences in expected value were such that consistently investing in the LV option would yield an expected final company value that was almost 30 percentage points higher than the one obtainable by consistently investing into the HV option. In the initial instructions, subjects were given a graphical overview of the general characteristics of the two investments as well as an example representing a choice between two 'typical investments'. This graphical display, as well as the complete instructions and a table showing the parameters of all prospect pairs, can be found in the appendix.
Stock-Option Compensation. Each CEO obtains five stock-options in each period, which are
emitted at-the-money, i.e. giving the right to buy company stock at the current stock value. For example, the five options granted before period one investment decisions are made give each the right to buy a share of the company at €1 ($1.50). The options get vested in the subsequent period and remain exercisable until the end of the game, so that they can be 'cashed' at any time. While in
reality the options give right to buy company stock which can then be either sold or kept, this decision was unified in order to simplify the game. That is, exercising options in the experiment means buying stock and reselling it immediately, thus realizing the difference between current stock value and the exercise price of the option. This process closely mimics real-world practices of “cashless exercise” (Heath et al., 1999). Thus in every period after the first, the CEO is called upon to decide whether to cash her options after the results of the investment have become known
(separately for options emitted in different periods). She will then obtain the new options and decide what kind of investment to take for the subsequent period.
Accountability manipulation. In the baseline treatment subjects are unaccountable. While their
actions will determine the final payoff of their shareholders, they cannot be traced back to them personally. In the accountable treatment, on the other hand, subjects acting as CEOs may be called upon to justify their decisions in front of their shareholders. At the beginning of the experiment subjects were asked to indicate their name so that they could be identified in case they would be extracted to justify their choices. They were assured that their names would not be kept together with their data and that this information would be destroyed after the experiment. Subjects are informed at the outset that in each group of six, one subject will be randomly extracted at the end of the game to justify her choices in front of the other five subjects in her group, who will act as shareholders. The randomized extraction was implemented inasmuch as it simulates a probability with which the executive's actions become known, and hence mimics the hidden action problem at the base of the principal-agent relationship. During the shareholder reunion, the shareholders were given a summary sheet displaying the decisions of the CEO and the evolution of the stock-value, and were allowed to interrogate the CEO about the reasons behind the decision making process. This was done in a separate room under the supervision of the experimenter. At the end of that questioning phase, they were required to hold a vote approving or disapproving the management of
the company. This vote held no monetary or other practical consequences, and subjects were dismissed as soon as this procedure was over.3
Risk Attitudes. We used the method of Abdellaoui, Bleichrodt, & l'Haridon (2008) to elicit detailed
risk attitudes. We elicited six certainty equivalents for pure gain prospects, six for pure loss prospects, and one for a mixed prospect. This allows us to derive utility functions over relevant amounts, which together with the estimation of probability weighting functions for gains and losses allow for the precise estimation of loss aversion (Abdellaoui, Bleichrodt, & Paraschiv, 2007; Booij & van de Kuilen, 2009; Schmidt and Zank, 2005). This was done before any treatment
manipulations were introduced, so that the elicitation procedure was the same for all subjects. While one choice was selected for real pay in each domain (gains, losses, and mixed gambles), no
information on payoffs was given until the very end of the experiment to avoid income effects. This part of the experiment lasted approximately 20 minutes. Following Abdellaoui et al. (2008), we classified a subject as risk averse (seeking) within each domain, if she was risk averse (seeking) for at least 4 out of 6 prospects in said domain. If a subject had exactly three risk averse and three risk seeking answers in one domain, then she was classified as risk neutral.
3 Interrogations were typically quite short, and mostly ended in a vote of approval. One exception occurred when an experimental CEO selected to be held accountable had taken considerable risks and had obtained a very low final share price. He was questioned repeatedly as to why he had chosen the high volatility investment even though it was clearly inferior in terms of average payoffs. The session ended with a vote of non-approval.
3.2 Results: reducing risk taking through increased accountability
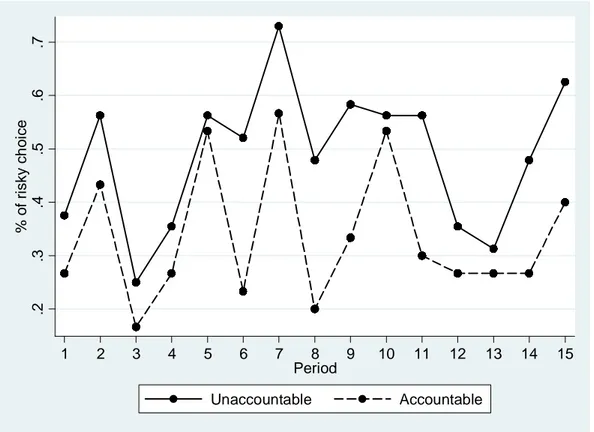
Figure 1: Average choices of risky investment by accountable and unaccountable subjects
.2 .3 .4 .5 .6 .7 % o f ri s k y c h o ic e 1 2 3 4 5 6 7 8 9 10 11 12 13 14 15 Period Unaccountable Accountable
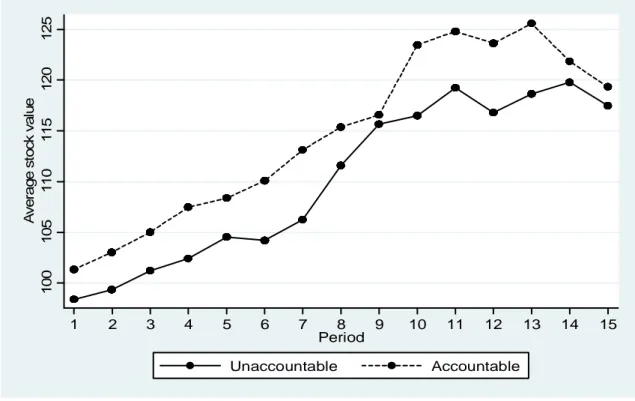
Figure 1 shows the percentage of risky choices by unaccountable and accountable subjects. It can be seen clearly that accountable subjects take less risks than unaccountable subjects in all periods. Since any risk-taking is sub-optimal by design, these choices should also be reflected in the performance of companies managed by accountable and unaccountable CEOs. Figure 2 shows company performance over the 15 periods of the experiment. And indeed, companies managed by accountable subjects can clearly be seen to outperform companies managed by unaccountable subjects. This effect is undermined somewhat by some endpoint effects showing up in the last two periods, which cannot entirely be explained by the choices shown in figure 1. Especially the large
decline in period 14 seems thereby due mostly to bad luck by accountable subjects, not excessive risk taking, as can be seen from figure 1.
Figure 2: Comparison of mean company performance managed by accountable and unaccountable subjects
1 0 0 1 0 5 1 1 0 1 1 5 1 2 0 1 2 5 A v e ra g e s to c k v a lu e 1 2 3 4 5 6 7 8 9 10 11 12 13 14 15 Period Unaccountable Accountable
Table 1 shows the results of a linear regression model with errors clustered at the subject level4, which regresses the choice of the riskier HV investment on a dummy variable indicating the
treatment and a number of other variables. All but specification I include period dummies as well as demographic variables such as age, gender5 and whether the participant is studying economics or business administration (for summary statistics of these variables, see appendix D). Accountability is clearly seen to significantly reduce risk taking—the high volatility investment is chosen about 49% of the time by unaccountable subjects, but only 34% of the time by accountable subjects
4 The results do not change if we use a random effects Probit model instead.
5 In some accountability studies gender effects have been found, whereby men react more strongly to accountability manipulations than women, especially in front of a male audience (Brandts & Garofalo, 2011) . We do not find any main or interaction effect of the gender variables, and do thus not report the coefficients in our regression analysis to keep the exposition tractable.
(p<0.01).
Risk aversion is thought to play an important role in the decision making of CEOs. Indeed, risk aversion by CEOs has been used as an argument for using stock-option compensation over stock-ownership plans to link CEO pay to company performance (for a detailed analysis of risk attitudes induced by different compensation mechanisms, see Lefebvre and Vieider, 2011). Adding a general index of risk aversion for gains, we indeed find a negative and strongly significant effect as we would expect.
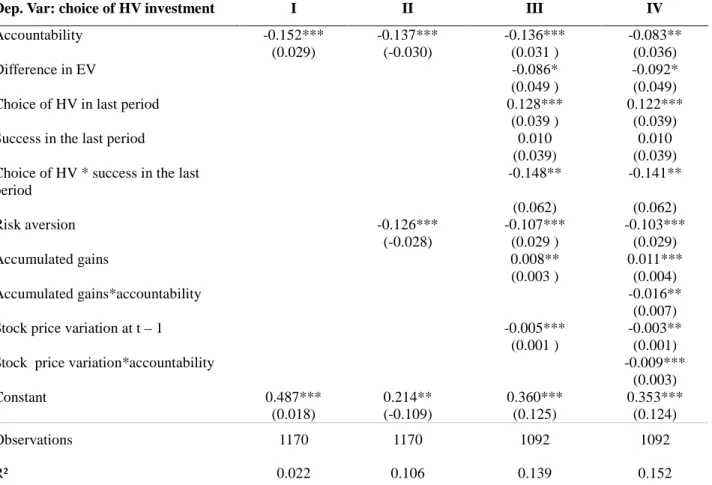
Table 1: Drivers of choice of the HV investment (linear probability model with errors clustered by subject)
Dep. Var: choice of HV investment I II III IV
Accountability -0.152*** -0.137*** -0.136*** -0.083**
(0.029) (-0.030) (0.031 ) (0.036)
Difference in EV -0.086* -0.092*
(0.049 ) (0.049)
Choice of HV in last period 0.128*** 0.122***
(0.039 ) (0.039)
Success in the last period 0.010 0.010
(0.039) (0.039) Choice of HV * success in the last
period -0.148** -0.141** (0.062) (0.062) Risk aversion -0.126*** -0.107*** -0.103*** (-0.028) (0.029 ) (0.029) Accumulated gains 0.008** 0.011*** (0.003 ) (0.004) Accumulated gains*accountability -0.016** (0.007)
Stock price variation at t – 1 -0.005*** -0.003**
(0.001 ) (0.001)
Stock price variation*accountability -0.009***
(0.003)
Constant 0.487*** 0.214** 0.360*** 0.353***
(0.018) (-0.109) (0.125) (0.124)
Observations 1170 1170 1092 1092
R² 0.022 0.106 0.139 0.152
Note: Specifications II, III, and IV include also controls for age, gender, and studies, as well as period dummies. *** ,**, * denotes a statistical significance at the 1%, 5% and 10% level respectively.
While the difference in expected value between the two investment options produces only a
marginally significant effect, a choice in the last period from a HV investment makes it more likely that another HV investment will be chosen again. This effect is qualified by the interaction term
between having chosen HV in the last period and whether the investment has been successful. Indeed, choices of the HV option decline after a successful HV investment, indicating a
capitalization strategy. A similar effect is also captured by the variation in stock price from the last period. Indeed, a positive variation in stock price reduces risk taking, indicating a strategy whereby subjects reduce risk taking following a successful investment in order to capitalize on any realized gains. Interestingly, this strategy seems to be used more by accountable subjects, which after an increase in the stock price reduce the likelihood of investing into a HV investment more strongly. Another interesting effect is found for accumulated gains, indicating the income from stock options that have already been exercised, and which can thus no longer be lost. Without accountability, we find a typical income effect, with risk taking increasing in accumulated gains. With accountability, however, we do not find such an effect, but rather the opposite effect of high accumulated gains resulting in less risk taking. This is consistent with a contentment strategy, whereby difficult-to-justify risks are taken by accountable subjects only when they deem this strictly necessary, but subjects resort to lower risk strategies once a certain level of income has been achieved.
The data just discussed seem to indicate that accountable subjects do not only generally take less risks than unaccountable subjects, but that they also follow a different investment strategy overall, whereby they try to capitalize on any gains in share price realized by switching to low risk strategies. However, any account of such behavior must by necessity be incomplete if one fails to consider the decisions by CEOs on when to cash their options, i.e., the decisions on how to maximize their own income. Indeed, if there is a capitalization strategy, we would expect accountable CEOs to hold on to their options longer—not least because it may take longer to accumulate a good revenue margin, while the risk of losing parts of one's potential income will be lower. At the same time, we would also expect loss averse agents to sell their options too early.
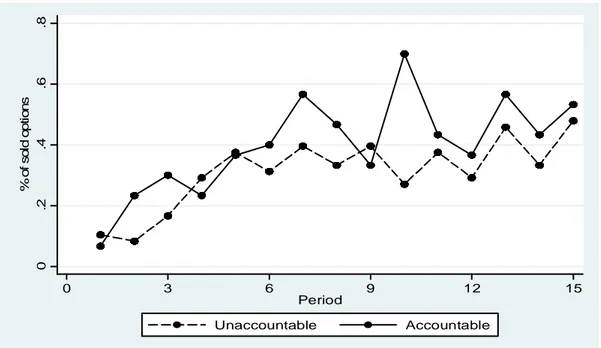
Such an account is at least partially confirmed by the selling behavior shown in figure 3. Accountable subjects seem to hold their options somewhat longer on average (see also regression
below). What seems to be even more evident, however, is that accountable subjects manage to sell
more of their options on average (statistically significant at p=0.001, two-sided Mann-Whitney test).
While they sell more options, those options are generally sold at a lower profit margin (0.51 cents per bundle of options which compares to 0.74 cents for unaccountable subjects). Overall, this leads to lower earnings: accountable subjects earned only €11 ($16) on average, which compare to an average of €19 ($28) earned by unaccountable subjects (significantly different at p<0.05, two-sided Mann-Whitney test). This confirms our hypothesis that executives will sacrifice some of their own payoffs to please shareholders when they are accountable. This finding thus indicates a conflict between the maximization of own profits and maximization of shareholder value.
Figure 3: % of options sold per period
0 .2 .4 .6 .8 % o f s o ld o p ti o n s 0 3 6 9 12 15 Period Unaccountable Accountable
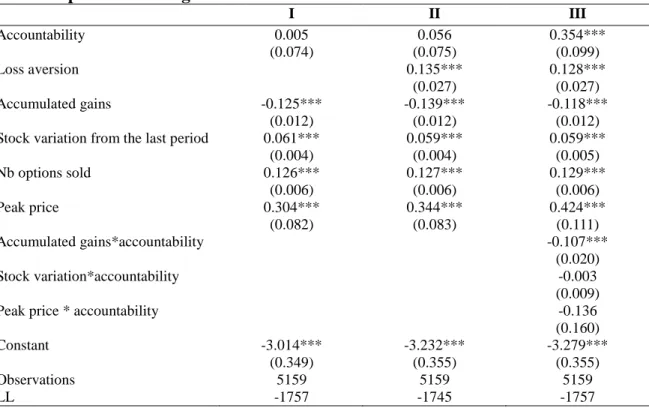
Table 2 reports a random effects Probit model regressing the selling decision on a number of explanatory variables. We take as dependent variable the selling decision (1 if sold, 0 if kept) for each bundle of five options. Option bundles are thus followed from their emission period through the selling period, and may be included in the regression between one and 15 times, depending on
when they are emitted and when they are sold. This method follows the analysis in Heath, Huddart, & Lang (1999), and results in a total of 5159 observations. A negative effect thus indicates a
decision not to sell in a given period—or in other words, to hold on to one's options longer. The regressions show that loss aversion plays a strong role for selling decisions, with loss averse CEOs selling their options earlier on. The number of options already sold before also makes it more likely that options will be sold in any given period. The latter finding could be due to several factors, including a general positive trend in stock-price, a different investment strategy, or the perpetuation of an initial selling strategy (e.g. 'sell as soon as a positive gain can be realized'). As already for investment choices, we find an income effect also for selling (exercising) decisions. Indeed, a higher accumulated income makes it less likely that options are sold in any given period, indicating a higher acceptance of the risk deriving from keeping the options longer-term. This relation is even reinforced under accountability, which goes to show that subjects do indeed try to capitalize on any gains obtained, but do so mostly when they have already accumulated some income.
Table 2: Option-exercising decisions
I II III Accountability 0.005 0.056 0.354*** (0.074) (0.075) (0.099) Loss aversion 0.135*** 0.128*** (0.027) (0.027) Accumulated gains -0.125*** -0.139*** -0.118*** (0.012) (0.012) (0.012)
Stock variation from the last period 0.061*** 0.059*** 0.059***
(0.004) (0.004) (0.005) Nb options sold 0.126*** 0.127*** 0.129*** (0.006) (0.006) (0.006) Peak price 0.304*** 0.344*** 0.424*** (0.082) (0.083) (0.111) Accumulated gains*accountability -0.107*** (0.020) Stock variation*accountability -0.003 (0.009)
Peak price * accountability -0.136
(0.160)
Constant -3.014*** -3.232*** -3.279***
(0.349) (0.355) (0.355)
Observations 5159 5159 5159
We also find a highly significant effect of a reference point, given by the peak price obtained in the past, as suggested by previous studies (Baucells, Weber, & Welfens, 2011; see also Lefebvre & Vieider, 2011, for an analysis of such effects in the present setting).6 Representing such a reference point by a dummy variable indicating whether the current stock-price is higher or lower than in any preceding period, we find that a stock-price above the reference point makes an exercising decision much more likely. Finally, we find a simple main effect of accountability in regression III,
indicating the effect of accountability when all higher term interactions that include the treatment dummy are equal to zero (Jaccard and Turrisi, 2003). This shows the effect that accountable subjects sell options sooner when for instance accumulated gains are equal to zero. When, on the other hand, accountable subjects have already accumulated some gains, they tend to keep options the longer the more income they have already accumulated, indicating higher risk acceptance consistent with an income effect as discussed above.
6. Discussion
Our experiment clearly shows how making executives accountable in front of their shareholders is an effective mechanism to rein in excessive risk taking on the side of our experimental executives. While some excessive risk taking does still take place under accountability, it is significantly
reduced, something that also shows in company performance. Obviously, the specific accountability mechanism we have implemented may be seen as lacking realism in several ways. We will start our discussion by addressing such potential criticism.
While shareholders could vote on whether they approved a CEOs action, no actual
consequences were connected to a vote of no confidence in our experimental design. Nevertheless, our experimental CEOs were on average willing to forego a payoff of €9—or two thirds of their
pay—in order not to acquire a reputation of selfishness amongst their peers. When millions of euros are at stake, a CEO may be more reluctant to sacrifice such an amount for saving her face. It thus seems important that real implications be connected to a shareholder vote. In our experiment, we wanted however to show that a simple justification need in front of a shareholder reunion may be enough to shame a CEO into acting in the shareholders' interest.
Costs of monitoring the actual behavior of CEOs can in practice be quite high. Also, reality is obviously more complex than our simple binary investment choice, and decisions do generally take place under uncertainty rather than risk (Knight, 1921). It may thus not always be clear how risky an investment was relative to others—more research is needed to determine to what extent this particular simplification may affect our results. Nevertheless, we believe that a general idea of the riskiness of an investment can be obtained by shareholders at least ex post. Obviously, whether obtaining such information and taking action may be considered worthwhile will generally depend on company performance, such that outcome monitoring, being automatic, will still present the primary means of controlling executives. In this sense, our random mechanism to determine which CEOs will be called to account for their actions is not very realistic, since shareholders can be expected to call such a meeting more often when a company underperforms. Still, the random element may be expected to weaken the effectiveness of our accountability mechanism, such that the results obtained are all the stronger.
A different criticism to our experimental design is that due to the symmetry in the setup it may have been optimal for every CEO to maximize her own payoffs to the detriment of her shareholders, inasmuch as everybody could earn higher payoffs by doing so (a sort of efficiency argument at the group level). While this is true to a certain extent, inasmuch as the loss in payoff of accountable CEOs relative to unaccountable CEOs was less than compensated by the increase in the payoffs from the shareholder function, assuming that our experimental subjects reasoned this way appears quite a stretch. Indeed, it would have been hard for them to predict how much earning they
would need to give up by a change of strategies ex ante. Furthermore, the experimental task was clearly presented as one in which each experimental subject mainly acted as the CEO of a company who may have to justify their choices to others, while the shareholder role was clearly secondary. Given this emphasis, we deem it unlikely that our subjects saw the game as a symmetric one, although we cannot completely exclude it based on our data. Finally, experimental CEOs did not see fit to offer such an explanation when held accountable—a strong indication against this line of reasoning.
In addition to these issues related to the design of the experiment, there is a more general note of caution that needs to be added. Our experimental manipulation clearly relies on a summary simplification of a potential situation faced by real-world CEOs. We have already mentioned that the stakes we use are far removed from the ones faced by real CEOs. We should also note that we have removed many other considerations that in the real world may play a role. These include, but are not limited to, job market considerations, shareholder and market expectations that may in turn influence stock prices, and legal issues. Furthermore, accountability can be a complex construct, and more accountability, or even different types of accountability, may not always be a solutions, with effects that can be much more complex and subtle than anticipated at first (Patil, Vieider, & Tetlock, forthcoming). Our result should thus be taken as a provocative suggestion, rather than as a finding that can be directly translated into a policy recommendation.
It also seems important to note that we do not want to make a general statement on the desirability or not to compensate executives through options. Lefebvre & Vieider (2011) provide detailed results on the risk attitudes induced by different incentive mechanisms. There is no doubt that options can produce positive results when any risk taking by executives may be desirable for shareholders. We wanted to test an extreme case in which risk taking is always undesirable. Since in risky environments outcomes will depend to a large extent on luck or chance as well as effort or skill, it seems desirable to supplement existing forms of outcome monitoring through pay for
performance with process monitoring systems that can be used when purely outcome-based systems fail. Our results show that merely the possibility of being called to justify one's actions is indeed an effective tool to align executive investment behavior with the interest of shareholders.
7. Conclusion
We designed an experiment in which executives compensated through stock options take investment decisions on behalf of shareholders. The excessive risk taking observed for
unaccountable subjects is reduced substantially when executives face the possibility that they may need to justify their decision in front of a shareholder reunion. Indeed, they sacrifice substantial amounts of money to conform to the interests of shareholders. A mechanism that increases the power of actual shareholders to call executives to account for their behavior thus seems a promising addition to existing pay-for-performance schemes, which may fail in cases where the outcomes depend to a large extent on chance as well as skill. The extent to which such process monitoring systems can be applied in real world settings is obviously also an issue of implementation costs. Nevertheless, we believe that at the very least allowing from such a system could serve as a useful supplement to existing systems when things go wrong.
Appendix A: Decision Screens, Main Experiment i) Investment screen
Appendix B: Instructions main experiment (unaccountable)
In this part of the experiment you will be asked to take repeated decisions over 15 rounds. You have two roles in this part, one as CEO of a company, and one as stockholder in 5 other companies managed by five other people in your group. Groups are randomly formed at the beginning of part 2 and stay the same for all 15 rounds. Just as you are a shareholder in the 5 companies managed by the other 5 people in your group, the other 5 people in your group are shareholders in your company and part of their payoff thus depends on your company's performance.
Please notice that your decisions are completely anonymous, and that neither the experimenter nor any of the shareholders in your company (the other 5 people in your group) can trace any decisions or outcomes back to you. As a matter of fact, neither you nor the other people taking part in the experiment will know who of the others in the experiment was in their group of 6.
In your function as CEO, you are managing a company. Your company has an initial value of 100 euros, corresponding to 100 shares of the value of 1 euro each. Your main decision will be to choose in each period which of two investment projects you want to invest the assets of your company in: investment A or investment B. You will have to make a choice between these two options, and you have to invest the total value of your company in every period. Each investment will be described for each period, and is characterized by its outcomes and its probabilities. Outcomes are given in percentage changes of company value, which can be either positive, negative or zero.
Example:
A typical choice is shown in the screen below. In the example shown, you are called upon to decide between two investments for your company assets:
investment A, which gives you a 50% chance that the company assets will increase by 8% and a
50% chance that they will decrease by 4%
investment B, which gives you a 20% chance that the company assets will increase by 40%, and an
80% chance that the value of your company assets will decrease by 8%
Imagine that you are facing the first investment decision (period 1), and that the company you manage is thus worth 100 euros. Imagine now you choose investment A and your investment is successful. Your company is now worth 108 euros, which corresponds to a value of 1.08 euros per share. This will be your starting value for period 2. There are 15 periods of investment in total.
Payoffs:
Contrary to part 1, all your decisions will now count towards your final payoff. Your payoffs are determined as follows. Before each investment period, you will obtain 5 stock options that give you the right to buy company stock in any future period for the exercise price indicated on the
option. Options will be emitted at company value and will become vested (that is, cashable) in the subsequent period. You can then decide separately for options obtained in different periods whether you want to: 1) cash the options, thus obtaining the difference between the current stock price and the emission value of the option (times 5 since you have five options); or 2) keep the options and preserve the right to exercise them in a later period.
Example (continued):
Following the example given above, this means that before your first investment decision you have obtained 5 stock options with an exercise price of 1 euro each (the company value divided by 100). Imagine again that you chose option A and that your investment was successful, so that your share value increased to 1.08 euros per share. You will now be asked whether you want to sell your options (actually: buy company stock and resell the stock, but the decision is only one and incorporates the two steps) or whether you want to keep the options.
If you decide to sell your options, in the example above you now gain 0.08 euros (8cents) on each of them for a total of 40 cents (the current stock value minus the exercise price for the five shares you can buy). If you decide to keep them, you obtain no money but preserve the right to sell them at a later point. Whatever your decision, at this point 5 new options will be emitted at an emission value of 1.08 euros each and you will start round 2. Once again, you will choose an investment, become feedback on whether the investment was successful or not, and you will again be asked whether you want to exercise your stock options. In case you have not yet sold your period 1 options, you will now be asked separately whether you want to sell your period 1 options and whether you want to sell your period 2 options.
Your Role as Shareholder:
In addition to your role as CEO, you are also a shareholder in the 5 companies managed by the other 5 people in your group (just as those other 5 people are shareholders in your company). This is a passive role, inasmuch as it does not require you to take any decisions. However, the shares you hold in the other companies will contribute towards your final payoffs as follows. In each of the 5 companies, you initially hold one share worth 1 euro. At the end of the 15 rounds, you will be paid out the total value of the shares you own in the different companies. For instance, if the final value of company 4 is 103 euros and the final value of company 6 is 187 euros, you will obtain 1.03 euros from your share in company 4, and 1.87 euros from the share you own in company 6 (plus whatever your shares in the other 3 companies are worth).
25 Typical Properties of Investments:
Finally we include a graphical display of the typical properties of investments A and B, derived from a simulation of investments with very similar characteristics. Please notice that the changes displayed in the graphs below are not the ones that will obtain in the experiment, but that they represent only random realizations from the same type of investment that have obtained in the past. However, the general trends that are indicated reflect the two types of investment that you will face. This means that the graphical display should not be seen as a substitute for careful considerations of probabilities and outcomes, but only as an indication of the general average characteristics of the different investment types.
Graph 1 below displays the evolution of typical investments A and B in 15 periods in the past (thick solid lines, with the light line representing investment A and the dark line representing investment B). Graph 1 also shows the long-term average returns of the two investment types (thin dashed lines, with the light line representing investment A and the dark line representing investment B). Those average returns are what results from observing investment types A and B over thousands of trials and averaging the outcomes.
Graph 1: Solid lines indicate the evolution of investments A and B over 15 periods in the past; the dashed lines indicate long-time trends of the two investment types.
70 80 90 100 110 120 130 140 150 0 1 2 3 4 5 6 7 8 9 10 11 12 13 14 15 Investment A Investment B
Accountability manipulation (substitute for paragraph 2 above):
At the end of the experiment, one CEO in your group of 6 will be extracted at random to be questioned by the group of his/her shareholders. If you are extracted, your name will be called out, and you will meet your shareholders in a separate room indicated by the experimenter. Your shareholders will obtain a printed summary of your choices in each period and of the evolution of your company's stock, as well as of your payoffs and the payoffs they have received as shareholders of your company. Your shareholders will then be given the opportunity to interrogate you about the reasons behind each one of your choices. At the end of that questioning period, your shareholders will be asked to vote on whether they approve or disapprove your actions as CEO.
Appendix C: Investment Pairs
HV prospect LV prospect
Prob. (loss, gain) % change Prob.(loss, gain) % change
Pair 1 (0.8, 0.2) (-8, 40) (0.5, 0.5) (-4, 8) Pair 2 (0.6, 0.4) (-4, 10) (0.3, 0.7) (-2, 4) Pair 3 (0.6, 0.4) (-6 ,9) (0.6, 0.4) (-1, 7) Pair 4 (0.9, 0.1) (-2, 22) (0.2, 0.8) (-2, 4) Pair 5 (0.5, 0.5) (-8, 12) (0.3, 0.7) (-4, 5) Pair 6 (0.6, 0.4) (-12 ,19) (0.5, 0.5) (-2, 8) Pair 7 (0.4, 0.6) (-15 ,12) (0.5, 0.5) (-2, 6) Pair 8 (0.8, 0.2) (-6, 34) (0.2, 0.8) (-6, 6) Pair 9 (0.7, 0.3) (-10 ,26) (0.7, 0.3) (-0, 6) Pair 10 (0.5, 0.5) (-8, 13) (0.4, 0.6) (-5, 8) Pair 11 (0.7, 0.3) (-9, 20) (0.5, 0.5) (-2, 5) Pair 12 (0.9, 0.1) (-8, 60) (0.6, 0.4) (-0, 4) Pair 13 (0.8, 0.2) (-7, 30) (0.3, 0.7) (-3, 5) Pair 14 (0.6, 0.4) (-10, 16) (0.6, 0.4) (-5, 12) Pair 15 (0.9, 0.1) (-8, 70) (0.8, 0.2) (0, 7)
Appendix D: Summary Statistics by Treatment
Accountablity treatment Unccountability treatment All treatments
# of subjects 30 48 70
% of male 60.0 56.3 57.7
Age 21.7 22.4 22.1
Proportion of risk averse sub.s for gains
60.0* (49.0) 54.2 (49.8) 56.4 (49.6)
Proportion of risk averse sub.s for losses
20.0* (40.0) 27.08 (44.5) 24.35 (42.9) Loss aversion 1.5*** (0.7) 2.02 (1.8) 1.83 (1.6) Proportion of risky investment 33.6*** (47.3) 48.8 (50.0) 42.9 (49.5) Proportion of successful investment 45.6* (49.9) 40.5 (49.1) 42.5 (49.5)
Stock price variation from period to period
1.3* (8.4) 1.46 (12.6) 1.39 (11.2)
# of periods options are kept 4.2 (3.8) 3.95 (3.5) 4.08 (3.6)
Options sold per period 8.3*** (7.5) 13.56 (16.8) 11.26 (13.3)
Accumulated gains 2.3* (3.7) 2.96 (5.4) 2.71 (4.8)
Total payoffs 11.0*** (12.9) 19.2 (18.5) 16.0 (17.1)
Note: The table indicates average values; the standard deviations are in parentheses. ** ,**, * denotes a statistical difference at the 1%, 5% and 10% level between accountability and baseline treatments. There are some differences between the two treatments in terms of risk attitudes. For one, we have marginally more risk averse subjects in the accountability treatment. While this could potentially explain some of the differences found, controlling for risk attitudes in regression II of table 1 shows that it does not significantly affect the main effect. Also, we also find subjects in the accountability treatment to be significantly less loss averse—and this would predict an effect in the opposite direction, with subjects assigned to the accountability treatment in theory more accepting of the high losses of the high volatility investment.
Acknowledgements
Financial support from the Agence Nationale de la Recherche (ANR BLAN07-3_185547 “EMIR” project) is gratefully acknowledged. We are indepted to Sylvain Ferriol for programming the
experiment, as well as to Marie Claire Villeval, Peter P. Wakker, Klaus Schmidt, Aurélien Baillon and participants at the CREPP seminar, the ESA conference in Copenhagen, and the WISE workshop on experimental economics in Xiamen, China, for helpful comments. All errors remain ours.
References
Abdellaoui, M., Bleichrodt, H., & Paraschiv, C. (2007). Loss Aversion Under Prospect Theory: A Parameter-Free Measurement. Management Science, 53(10), 1659-1674.
Abdellaoui, Mohammed, Bleichrodt, Han, & L’Haridon, O. (2008). A tractable method to measure utility and loss aversion under prospect theory. Journal of Risk and Uncertainty, 36(3), 245-266.
Agrawal, A., & Mandelker, G. N. (1987). Managerial Incentives and Corporate Investment and Financing Decision s. Journal of Finance, 42(4), 823 - 37.
Baron, J., & Hershey, J. C. (1988). Outcome bias in decision evaluation. Journal of Personality and
Social Psychology, 54, 569-579.
Bebchuk, L. A., Cohen, A., & Spamann, H. (2010). The Wages of Failure: Executive Compensation at Bear Stearns and Lehman 2000-2008. Yale Journal on Regulation.
Bebchuk, L. A., & Fried, J. M. (2003). Executive Compensation as an Agency Problem. Journal of
Economic Perspectives, 17(3), 71-92.
Bebchuk, L. A., Fried, J. M., & Walker, D. I. (2002). Managerial Power and Rent Extraction in the Design of Executive Compensation. University of Chicago Law Review, 69(3), 751-846. Bertrand, M., & Mullainathan, S. (2001). Are CEOS Rewarded for Luck? The Ones without
Principals Are*. Quarterly Journal of Economics, 116(3), 901-932.
Booij, A., & van de Kuilen, G. (2009). A Parameter-Free Analysis of the Utility of Money for the General Population under Prospect Theory. Journal of Economic Psychology, 30, 651-666. Brandts, J., & Garofalo, O. (2011). Gender pairings and accountability effects. Journal of Economic
Behavior & Organization, forthcoming.
Charness, G., & Jackson, M. O. (2009). The role of responsibility in strategic risk-taking. Journal of
Economic Behavior & Organization, 69, 241-247.
Cyert, R., Kang, S.-H., & Kumar, P. (2002). Corporate Governance, Takeovers, and
Top-Management Compensation: Theory and Evidence. Top-Management Science, 48(4), 453-469. Jaccard, James, & Robert Turrisi (2003). Interaction Effects in Multiple Regression. Second Edition.
Sage Publications, London.
The effects of trust, accountability and self-monitoring in social dilemmas. European Journal
of Social Psychology, 31(1), 93-107.
Feltham, G. A., & Wu, M. G. H. (2001). Incentive Efficiency of Stock versus Options. Review of
Accounting Studies, 6, 7-28-28.
Fiegenbaum, A. (1990). Prospect Theory and the Risk-Return Association. Journal of Economic
Behavior & Organization, 14, 187–203.
Greiner, B. (2004). The Online Recruitment System ORSEE 2.0 - A Guide for the Organization of Experiments in Economics. University of Cologne, Working Paper Series in Economics 10. Heath, C., Huddart, S. J., & Lang, M. H. (1999). Psychological Factors and Stock Option Exercise.
Quarterly Journal of Economics, 114(2), 601–627.
Hoffman, E., McCabe, K., & Smith, V. L. (1996). Social Distance and Other-Regarding Behavior in Dictator Games. American Economic Review, 86(3), 653 – 60.
Knight, Frank (1921). Risk, Uncertainty, and Profit. University of Chicago Press, Chicago Lefebvre, M., & Vieider, F. M. (2011). Risk Taking of Executives under Different Incentive
Contracts: Experimental Evidence. University of Munich Discussion Paper 2011-7. Lerner, J., & Tetlock, P. E. (1999). Accounting for the effects of accountability. Psychological
Bulletin, 125.
Mauboussin, M. J. (2010). Untangling skill and luck: How to Think About Outcomes—Past, Present, and Future. Legg Mason Capital Management.
Ouchi, W. G., & Maguire, M. A. (1975). Organizational Control: Two Functions. Administrative
Science Quarterly, 20(4), 559-569.
Pahlke, J., Strasser, S., & Vieider, F. M. (2012). Risk-Taking for Others under Accountability.
Economics Letters, 114(1), 102-105.
Patil, Shefali V., Ferdinand M. Vieider, & Philip E. Tetlock (forthcoming). Process versus Outcome
Accountability. Oxford Handbook of Public Accountability. Mark Bovens, Thomas
Schillemans, & Robert E. Goodin (eds.), Oxford University Press.
Rege, M., & Telle, K. (2004). The impact of social approval and framing on cooperation in public good situations. Journal of Public Economics, 88(7-8), 1625-1644.
Schmidt, U., & Zank, H. (2005). What is Loss Aversion? Journal of Risk and Uncertainty, 30(2), 157-167.
Sutter, M. (2009). Individual Behavior and Group Membership: Comment. American Economic
Review, 99(5), 2247–2257.
Tetlock, P. E., Vieider, F. M., & Grant, A. (2011). Ideology, Agency and Accountability: Explaining Shifting Managerial Preferences for Alternative Accountability Regimes. Working Paper Trautmann, S. T., & Traxler, C. (2010). Reserve prices as reference points – Evidence from auctions
for football players at Hattrick.org. Journal of Economic Psychology, 31(2), 230-240.
Vieider, F. M. (2009). The effect of accountability on loss aversion. Acta Psychologica, 132(1), 96-101.
Wiseman, R. M., & Gomez-Majia, L. R. (1998). A Behavioral Agency Model of Managerial Risk Taking. Academy of Management Review, 23(1), 133-153.
Zeiliger, R. (2000). A Presentation of Regate, Internet Based Software for Experimental Economics.