HAL Id: hal-01539730
https://hal.sorbonne-universite.fr/hal-01539730
Submitted on 15 Jun 2017HAL is a multi-disciplinary open access archive for the deposit and dissemination of sci-entific research documents, whether they are pub-lished or not. The documents may come from teaching and research institutions in France or abroad, or from public or private research centers.
L’archive ouverte pluridisciplinaire HAL, est destinée au dépôt et à la diffusion de documents scientifiques de niveau recherche, publiés ou non, émanant des établissements d’enseignement et de recherche français ou étrangers, des laboratoires publics ou privés.
nitrate ionic liquid+water system: Electrocapillarity,
surface charge and differential capacitance
Malika Ammam, Dung Di Caprio, Laurent Gaillon
To cite this version:
Malika Ammam, Dung Di Caprio, Laurent Gaillon. Interfacial properties of mercury/ethylammonium nitrate ionic liquid+water system: Electrocapillarity, surface charge and differential capacitance. Elec-trochimica Acta, Elsevier, 2012, 61, pp.207-215. �10.1016/j.electacta.2011.12.004�. �hal-01539730�
Interfacial properties of mercury/ethylammonium nitrate ionic liquid +
water system: electrocapillarity, surface charge and differential capacitance
Malika Ammam †‡*, Dung Di Caprio† and Laurent Gaillo†
† Laboratoire d’Electrochimie et Chimie Analytique, Equipe Energétique et Réactivité aux
Interfaces, Université Pierre et Marie Curie-Case 39, 4, place Jussieu 75252 PARIS Cedex 05, France
‡ Present address: Faculty of Science, University of Ontario Institute of Technology, 2000
Simcoe Street North, Oshawa, ON L1H 7K4, Canada
* Corresponding author: Phone (905)721-8668, ext 3625; Fax 905-721-3304; email:
[email protected]; [email protected]
Abstract
In this account, surface tensions of mercury/ethylammonium nitrate (EAN) aqueous solutions at different compositions as a function of the potential have been measured. Using the first and the second derivative of surface tension curves, surface charge and differential capacitance have been obtained. Assumptions based on simple hypotheses and comparison of the EAN behavior with respect to ammonium nitrate (AN) provided information about the ionic structure at the interface mercury/ EAN solutions. The results from the electrocapillarity maximum data suggest excess adsorption of the nitrate anions at low EAN concentrations and excess adsorption of the ethylammonium cations at higher concentrations. The results from the differential capacitance data indicate that the ethyl group of the EAN cation would preferably be oriented towards the metal mercury.
Key words: Dropping mercury electrode, Ethylammonium nitrate ionic liquid, Interfacial
1. Introduction
Ionic liquids, or room temperature ionic liquids (Ils), constitute one of the most widely investigated material groups today both for their fundamental and enormous range of possible applications [1-2]. The synthesis of the first IL, ethylammonium nitrate (abbreviated as EAN) was described by Paul Walden in 1914 [3]. The salt involves dissociable protons, which makes it a protic ionic liquid (PIL) [4]. Even thought, this first paper by Walden [3] did not receive much resonance in the scientific world at its time, today EAN is the most extensively studied PIL. The interest in this salt has been largely driven by its many similarities in properties and behavior to water. In view of this, early work from the 1980s by Evans and co-workers showed many similarities between EAN and water, based strongly on the ability of EAN to promote aggregation of surfactants [5-7]. However, later work by Mirejovsky and coworkers showed that there are key differences between EAN and water, based on their heat capacities [8]. The main water like properties of EAN are: i) it can promote the formation of micelles [5], ii) has a high cohesive energy density [8-9], iii) is highly polar with solvophobic behavior [5,10] and iv) has water like properties in its enthalpy and entropy changes for the transfer of nonpolar gases to EAN [7]. On the other hand, both water and EAN have hydrogen bonding acceptor and donor sites, thus can form a hydrogen-bonded network structure [5]. However, the nature of the structure is different because EAN has a negligible heat capacity for dissolving nonpolar gases compared to that of water [8].
The large similarities between the properties of EAN to that of water gave rise to a wide range of applications. For example, EAN is used in biology for proteins renaturation and crystallization [11-14], as a reaction media for enzymes such as Candida Antarctica lipase B
[11] and, to generate useful immunotoxins by modification of toxic protein such as mistletoe lectin 1 by EAN [15-17]. In the field of electrochemistry, EAN was found very useful as a nonaqueous electrolyte because it exhibits a wide potential window compared water [1,18]. It is also used as electrolyte solutions for cyclic voltammetry experiments on ferrocene based complexes [19], reduction of uranium complexes [20], and reduction of a variety of metal ions [18]. In this context, it has been reported that hexavalent uranium was irreversibly reduced by EAN at 20 °C, while tetravalent uranium was unstable and formed hexavalent uranium within 5 h [20-21]. Also, the metal cations Cd2+, Zn2+, Cu2+, Pb2+, and Tl+ all
reversibly reduced in EAN, while Ni2+ was irreversibly reduced, with very stable potentials
[18]. It was also observed that the addition of water to EAN shift the redox potentials from -0.228 V to 0.327 V for ferrocene [19]. More recently, it has been reported that polyaniline films with improved characteristics can successfully be deposited from EAN solutions [22].
Ethylammonium nitrate is miscible with water to form a mixture of any composition, and both ions, C2H5H3N+ and NO3-, can favorably form hydrogen bonds with water molecules.
Physicochemical properties, such as molar volumes [23], heat capacity [23-24], vapor pressure [25] and, acidity/basicity [26] have been examined over the range of solvent composition. The studied quantities showed that EAN-water mixture is almost an ideal model system to study high concentrated electrolyte solutions. Ethylammonium cation involves three –NH protons capable of forming hydrogen-bonds, and the NO3– anion can be bonded to the
proton through the O atom. Ions in pure EAN are linked together to form a hydrogen-bonded network structure. On the other hand, in an EAN–water mixture, the hydrogen bonded network structure may be broken, and other kind of hydrogen-bonded structure involving cations, anions and water may be formed. The physicochemical properties may thus be strongly dependent on the EAN-solvent composition.
Interfacial phenomena of mixtures water-EAN is one of the electrolyte properties to take into consideration when interfacial electrochemical processes from these media are involved. This study investigates the electrochemical properties at the interface between mercury electrode and EAN aqueous solutions at various concentrations, which might be relevant for eventual applications of electrode/EAN solutions in electrochemical processes such as electrodeposition of metal ions from these solutions [27]. On the other hand, while considerable data are available on diluted electrolyte solutions, the knowledge is still little for concentrated electrolyte solutions. The strong interactions between the charged species as well as the low solubility lead to complications, especially at the interface electrode/solution. In this study, dropping mercury electrode (DME) is used because it is a useful tool to access interfacial properties between the electrode and the EAN solutions. More importantly, it behaves as an ideally polarized electrode in a wide range of potentials. Using DME, we have measured the surface tension of mercury/EAN solutions as a function of the potential. The first and the second derivative of the surface tension data led respectively to surface charge and differential capacitance. Analysis of these quantities provided information about the ionic structure at the interface mercury/EAN solutions.
2. Experimental
2.1. Materials
Ultrapure water milliQ grade with a resistivity of 18.2 MΩcm was used for all the experiments. All chemicals are analytical grad and ethylamine was dried by distillation. EAN has been prepared from aqueous ethylamine (70) and nitric acid (69.5) by mixing equimolar amounts in an ice bath. The prepared solution (pH 6-7) was dried in vacuum at
temperature of 36 oC, then treated with liquid nitrogen and finally further dried in desiccators
in presence of P2O5. The melting temperature was verified and found to be close to the
reported 12 oC [3].
2.2. Equipment and procedures
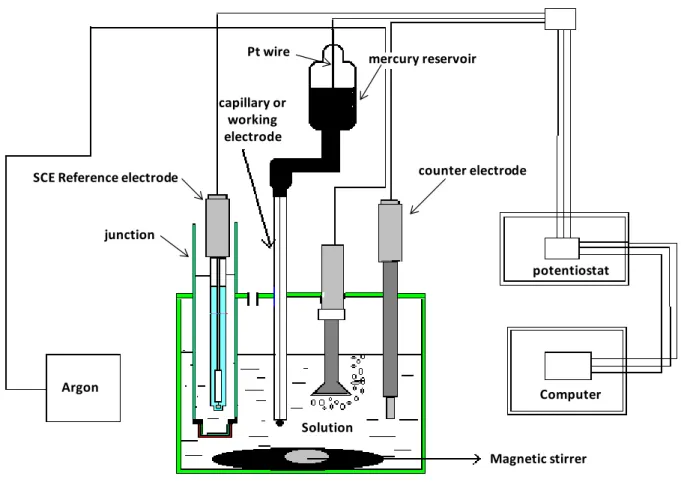
The experiments were carried out using DME system schematically displayed in Fig. 1. To prevent external mechanical vibrations, the system of Fig. 1 was set on an anti-vibration table. The height of the mercury column over the tip of the capillary was kept at a constant height. The three electrodes system was connected to a potentiostat that is in turn connected to a computer for data acquisition. To prevent the system from eventual contamination with KCl of the reference electrode, a ceramic frit junction is used to separate the reference electrode from the EAN studied solutions (Fig. 1). To remove dissolved gases such as O2, which may
be reduced at the mercury electrode and interfere with the measurements, the studied solutions were degassed with Argon for at least 30 min prior to measurements. Finally, in order to prevent the system from eventual adsorption of contaminants, all material is rinsed with diluted nitric acid, ultrapure water and acetone prior to use.
The range of the potentials where DME is ideally polarized for the investigated solutions of (propylammonium nitrate (PAN), ethylammoniun nitrate (EAN), ammonium nitrate (AN) and potassium nitrate (PN)) was determined by linear sweep voltammetry and found to be in the range of -1600 to 500 mV vs. SCE. Beyond, electrochemical reactions can be produced. The experiments consist of applying a constant potential and measure the time of 20 mercury drops. Near the potential of zero charge (PZC), the measurements were varied by 20 mV and outside this region; the measurements were swept by 50 mV. This is primarily carried out with the calibration solution (0.1 M KNO3), then with the EAN solutions at various
concentrations ranging from 10-2 M to pure EAN. The time of the mercury drops is recorded
with a chronometer ( 0.005s) and all the measurements were performed at 25 0.1 oC. 3. Theoretical considerations and reminders
3.1. Dropping mercury electrode (DME)
In work with a dropping mercury electrode, the height of the mercury column above the capillary tip governs the pressure driving mercury through the DME (Fig. 1), thus it is a key determinant of the mass m. In turn, m controls the drop time tmax, because the maximum
mass that the surface tension can support (mtmax) is a constant defined by [28]:
where g is the gravitational acceleration, r is the radius of the capillary, and is the surface tension of the interface mercury/solution.
Eq. (1) gives the relationship between the drop time, a parameter that is experimentally measurable and surface tension. Thus, surface tension can be deduced from Eq. (1) as: =
mtmaxg/2r and, m can be replaced by the Archimedes Principle (Buoyancy) to yield:
= Vtmaxg(Hg-sol)/2r (2)
where V is the volume, Hg is the density of mercury and, sol is the density of the solution.
In Eq. (2) volume, V, and the radius of the capillary r, which is more precisely the radius of the link between the mercury drop and the capillary at the time when the drop falls are usually unknown. To overcome this problem as well as to obtain reproducible results, the DME apparatus is calibrated with a solution that have a known surface tension. In this study, 0.1 M KNO3 was selected as a calibration solution because KNO3 has the same anion as EAN (NO3
-). The concentration of 0.1 M is selected for calculus simplification reasons. Because it is a diluted solution, its density can be assimilated to the density of water. Accordingly, for 0.1 M KNO3, Eq. (2) can be written as:
KNO3 = Vtmaxg(Hg-water)/2r (3)
The ratio of Eq. (2) to Eq. (3) gives the final formula, which allows calculating the surface tension of the mercury/EAN solutions:
EAN = tmax(EAN)KNO3(Hg-sol)/ tmax(KNO3)(Hg-eau) (4)
where Hg equals 13.534 g/cm3 at 20 oC, water equals 0.996 g/cm3 at 20 oC and, the density of
the EAN solution, sol, is determined from Fig. 2 obtained from the partial molar volumes
reported in literature at 25 oC [23] by, assuming equal densities at 20 oC and 25 oC. The surface tension of the calibration solution, KNO3, is taken as 424 mN/m [29].
3.2. Ideally polarized electrode (IPE)/solution
An electrode or an interface electrode/solution is called ideally polarized when no charge transfer at the interface of the electrode/solution can occur regardless of the applied potential. While no real electrode can behave as an IPE over the whole range of the potential available in a solution, some electrode/solution systems such as DME can approach ideal polarizability over limited potential ranges. Although in this region, reduction of water is thermodynamically possible, it occurs at a very low rate at DME. Hence, the only Fradaic current that flows in this region is due to charge-transfer reactions of trace impurities such as metal ions, oxygen, and organic species, and this current is quite negligible in clean systems.
Since charge cannot cross IPE interface when the potential across it is changed, the behavior of the electrode/solution interface is analogous to that of a capacitor. A capacitor is an electrical circuit element composed of two metal sheets separated by a dielectric material. Its behavior is governed by the equation [28]:
C = q/E (5)
where q is the charge stored on the capacitor (in coulombs, С), Е is the potential across the capacitor (in volts, V), and С is the capacitance (in farads, F).
During the charging process, a current (called the charging current) will flow. The charge on the capacitor consists of an excess of electrons on one sheet and a deficiency of electrons on the other side. The electrode/solution interface has been shown experimentally to behave like a capacitor, and a model of the interfacial region somewhat resembling a capacitor can be given [28]. At a given potential, there will exist a charge on the metal electrode, qm, and a
charge in the solution, qsol. Whether the charge on the metal is negative or positive with
respect to the solution depends on the potential across the interface and the composition of the solution. At all times, however, qm=-qsol, or often divided by the surface area of the electrode and expressed as charge densities, m = -sol, usually given in C/cm2. The charge density on
the metal, m, represents an excess or deficiency of electrons and resides in a very thin layer
(<0.1 Å) on the metal surface. The charge density in solution, sol, is made up of an excess of
either cations or anions in the vicinity of the electrode surface. The whole array of charged species and oriented dipoles existing at the metal/solution interface is called the electrical
double layer. At a given potential, the electrode/solution interface is characterized by a double
layer capacitance, Cd, typically in the range of 10 to 40 F/cm2. However, unlike real
capacitors, whose capacitances are independent of the voltage across them, Cd, is often a
function of potential [28].
3.3. Description of the electrical double layer
3.3.1. Metal side
The side of the double layer on the metal side can be modeled by the so-called Jellium
model [30]. The latter considers the metal side of the double layer as a jelly of positive ions with a uniform charge distribution and, in which a cloud of mobile electrons behave as a gas. The metal side is overall electrically neutral. Despite the kinetics, the electrons cannot move farther from the metal because of the strong forces exercised by the cations. The latter yields a potential gap which prevents the electrons from moving farther from the surface.
The solution side of the double layer is thought to be made up of several "layers". That closest to the electrode, the inner layer, contains solvent molecules and sometimes other species (ions or molecules) that are said to be specifically adsorbed [28]. This inner layer is also called the compact, Helmholtz, or Stern layer. The locus of the electrical centers of the specifically adsorbed ions is called the inner Helmholtz plane, which is at a distance x1. The
total charge density from specifically adsorbed ions in this inner layer is i (С/сm2). Solvated ions can approach the metal only to a distance x2(x2>x1); the locus of centers of
these nearest solvated ions is called the outer Helmholtz plane. The interaction of the solvated ions with the charged metal involves only long-range electrostatic forces, so that their interaction is essentially independent of the chemical properties of the ions. These ions are said to be nonspecifically adsorbed. Because of thermal agitation in the solution, the nonspecifically adsorbed ions are distributed in a three dimensional region called the diffuse
layer, which extends from the outer Helmholtz plane into the bulk of the solution. The excess
charge density in the diffuse layer is d, hence the total excess charge density on the solution
side of the double layer, sol, is given by:
sol = i + d = -m (6)
3.4. Electrocapillarity
Eq. (4) illustrated the relationship between the surface tension and drop time. In turn, the relationship between surface tension and potential is given by Lippman’s equation, resulting from the general equation of electrocapillarity at constant chemical potential, µi,
temperature, T, and pressure, P [28,31]:
(-d = mdE)i,T,P (7) The plot of the curve of surface tension as a function of potential ( = f(E)) called
electrocapillarity curve, has the nearly parabolic shape that is usually characteristic of these
curves, although there are significant variations in the curves as the electrolyte is changed. A feature common to all of the curves is the existence of a maximum in surface tension. The potential at which it occurs is the electrocapillarity maximum (ECM) and is an extremely important point in the system. Since the slope of the curve is zero there, it is the potential of
zero charge (PZC), where m = sol = 0. At more negative potentials, the electrode surface
has a negative excess charge, and at more positive potentials there is a positive surface charge. The units of the electronic charge composing any excess repel each other, hence they counteract the usual tendency of the surface to contract, and they weaken the surface tension. Usually, the electrocapillarity curves do not yield enough information about the ionic
structure at the interface. More information can be obtained from surface charge and differential capacitance data [28]. Surface charge is obtained from the derivative of the electrocapillarity curve:
m = -/Ei,T,P (8)
In turn, differential capacitance is obtained from the derivative of surface charge curve:
Cd = m/Ei,T,P (9)
4. Results and discussion
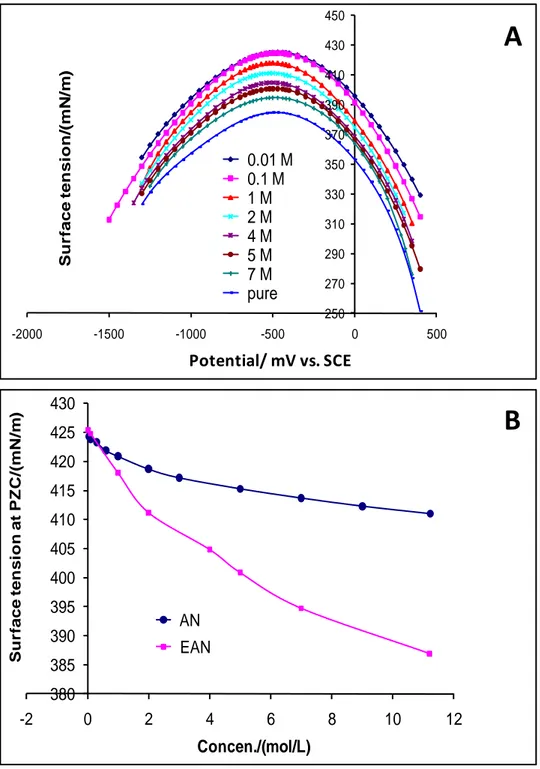
4.1. Electrocapillarity curves of mercury/EAN solutions
In this study, after obtaining experimentally the curves of drop time as a function of potential, polynomial regression fittings of different orders, 6, 7 and 8 have been employed. Overall, no significant difference in the form, shape or position between the resulting fitted curves was noticed. Accordingly, a polynomial fitting of degree 6 was selected and using Eq. (4) which relate the surface tension to drop time, the electrocapillarity curves ( = f(E)) of the investigated EAN-water compositions were obtained as shown in Fig. 3A. One can clearly see the parabolic shape of the curves. Also, all the curves show the presence of surface tension maximum around -500 mV vs. SCE, corresponding to the potential of zero charge (PZC). At high or low potentials from PZC, the surface tension decreases due to the accumulation of charges on both sides of the metal/solution as described in paragraph (3.4).
The surface tension of pure air/EAN equals 47.3 mN/m [32-33], that of water/air is reported as 71.97 mN/m (equilibrium at 25 oC) [34] and, the surface tension of mercury/air
equals 487 mN/m (15 oC) [34]. Fig. 3A reveals that the recorded surface tensions are close to the reported value for mercury/air. This means that a large part of the surface tension of mercury/EAN solutions would be attributed to the metal mercury, rather than to EAN. Fig. 3A also depicts that the shifts in surface tension is more significant at potentials higher than PZC than at lower potentials and, the shifts become more pronounced at elevated EAN concentrations. Careful analysis of Fig. 3A around PZC reveals a change in position of the PZC as a function of the EAN concentration. It is worth reminding that the position of zero charge is characterized by two components maximum surface tension and potential of zero charge. Each component will separately be addressed as a function of the EAN concentration. In order to examine the eventual effects of the ethyl group of the EAN cation on these components, the results will be examined and compared with respect to ammonium nitrate (AN) [35].
4.1.1. Effect of the EAN concentration on surface tension at PZC
Fig. 3B compares the curves of variation of surface tension at PZC as a function of the concentration of EAN with respect to AN. At c=0, the curves of EAN and AN should indicate the surface tension of water and point to the same value. However, a slight shift can be noticed in Fig. 3B which will be assigned to experimental errors. Fig. 3B also shows that the surface tension of EAN and AN decreases as the concentration increases. Furthermore the decrease obtained with EAN is more significant than that of AN and, the shift between the two curves, becomes more pronounced as the concentration is getting higher. The surface tension results from the change in the surrounding environment of the species located close to surface compared to those located in bulk. The species close to the surface are influenced by two kinds of interactions i) those exercised by the solution and, ii) those induced by the metal. The interactions that might be present in EAN and AN solutions would essentially be electrostatic and hydrogen bonds. It turn out that microscopically the significant decrease in the surface tension obtained with EAN compared to that of AN would particularly be attributed to substitution of one hydrogen atom in AN by an ethyl group in EAN. This leads to a decrease in the number of the hydrogen bonds. The latter is supported by Fig. 4A, which compares the variation of the surface tension as a function of potential of mercury/propylammonium nitrate (PAN) with respect to EAN. PAN is a protic ionic liquid with a melting temperature of 4 oC and a density of 1.1568. As one can expect from the strong
amphiphilic nanostructure due to presence of the propyl group in PAN and, which may reduce the number of the hydrogen bonds [36], the surface tension of mercury/pure PAN is reduced compared to that of EAN. Fig. 4B clearly shows that the surface tension at PZC decreases when the number of carbon atoms of the ammonium cation (AN, EAN and PAN) increases.
4.1.2. Effect of the EAN concentration on PZC
Fig. 5A compares the curves of variation of PZC as a function of the concentration of EAN with respect to AN. At c=0, the two curves should point to the same PZC value, which is the PZC of mercury/water interface. However, a slight shift can be observed in Fig. 5A, which will be assigned to errors in the measurements. Fig. 5A depicts that the two substances EAN and AN behave differently at high concentrations (c4 M). For 0c11.2 M, large shifts in PZC can be noticed and reaches 160 mV for mercury/saturated AN. The reason for that may have to do with: i) the effect of the liquid-liquid junction and/or, ii) the effect of the specific adsorption.
Effects of the liquid-liquid junction occurs between the reference electrode SCE and the EAN or AN solutions when the concentration changes from pure water to pure molten salt for EAN or saturated solution for AN. The liquid-liquid junction potential is influenced by several parameters including nature of the solvent, nature of the ions and their activities in solution. With regard to nature of the ions, it is generally assumed that KCl is equitransferent [37] and, we think that it might be the case for EAN ions. The liquid-liquid junction potential is thus ion concentration independent and will only be influenced by the nature of the solvent on both sides of the junction. For EAN concentrations (0<c 4M), the molar ratio of EAN to water is <0.1. Consequently, it can be assumed that water is the solvent on both sides of the junction and the liquid-liquid junction potential is constant in that range of concentrations. For higher EAN concentrations (c>4M), theoretically, it would be incorrect to consider water as a solvent. But, since the structure of these concentrated solutions as well as the chemical potentials of the ions are unfortunately unknown, hence, we will assume that the liquid-liquid junction potential is constant for the whole range of the explored concentrations and only the change in the specific adsorption will be considered.
Shifts in PZC as a function of the concentration may also be assigned to specific adsorption of the charged species, called Esin-Markov effect [28,38]. If we consider a system in which the anion is specifically adsorbed and the electrode is being held at the PZC. If we introduce more of the same electrolyte substance, more anions will be adsorbed; hence sol
becomes nonzero and must be balanced. Since the electrode is more polarizable than the solution, the counter charge is induced there. To regain the condition m = 0, the potential
must be shifted to a more negative value, so that the charge excess of specifically adsorbed anions is exactly counterbalanced by an opposing excess charge in the diffuse layer. Thus specific adsorption of anions is indicated by negative shifts in potential at constant charge density, whereas specific cationic adsorption is revealed by positive shifts, as the electrolyte concentration is elevated [28]. Fig. 5A displays that at c<4 M, the PZC reduces as the concentration increases for both substances EAN and AN. This would be attributed to the adsorption of excess nitrate anions in the inner Helmholtz plane. Furthermore, it can be noticed that the shift is more pronounced for AN compared to that of EAN, suggesting that the excess adsorbed nitrate anions at the interface are more important for AN than for EAN. The reason for that may have to do with the presence of the ethyl group in EAN that creates some kind of competition between the nitrate anion and the ethylammonium cation. However, in this range of concentrations, this effect is nevertheless not sufficient to reverse the
adsorption of the excess anions into excess cations. By contrast, for c>4 M, the curve corresponding to AN continues to decrease suggesting a dominant specific anionic adsorption of nitrate ions, while the EAN curve shows an increase. Assuming a liquid-liquid junction potential that is constant for the whole range of the explored concentrations, the increase observed in the EAN curve would be related to the adsorption of excess ethyl ammonium cations. In this context, if presence of the ethyl group creates an excess cationic adsorption at higher concentrations, one can wonder the consequences of a longer hydrocarbon chain. Fig. 5B displays the relationship between PZC and the number of carbon atoms introduced within the ammonium cation (AN, EAN and PAN). It is clear that the more the hydrocarbon chain becomes longer, the more the PZC increases. This demonstrates that elongation of the hydrocarbon chain within the ammonium cation favors the adsorption of excess cations.
Generally speaking, the electrocapillarity curves do not give enough information about the interfacial structure. The first and the second derivative of the electrocapillarity curves yield respectively the surface charge and the differential capacitance, two important quantities to examine in order to have a better idea on the behavior of the cationic and the anionic species at the interface.
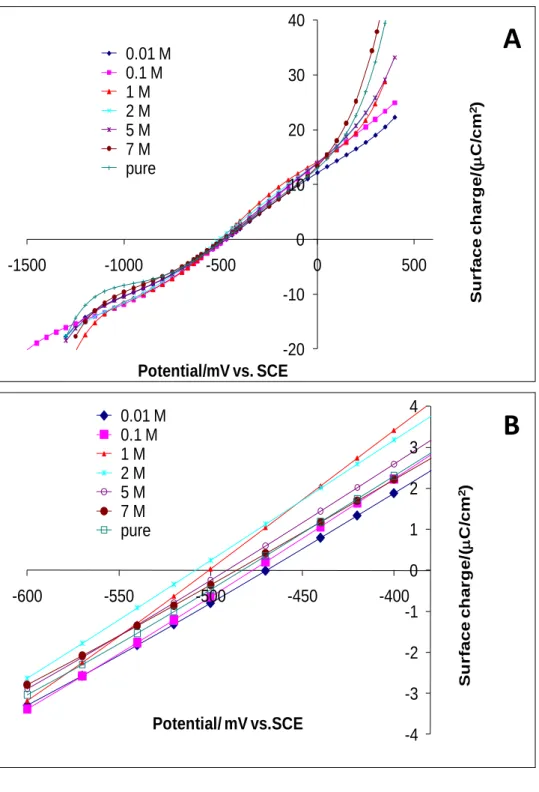
4.2. Surface charge of mercury/EAN solutions
Fig. 6A shows the surface charge curves (m-E) of the various studied EAN-water
compositions. Around the PZC, no significant shift between the curves obtained at various EAN concentrations can be noticed. At more positive or negative potentials, shifts between the curves can be observed. However, at these potentials, it is important to remind that the curves are very sensitive to edge effects of the polynomial regression fittings employed in the electrocapillarity curves. Hence, their interpretations will not be very useful. A zoom of Fig. 6A around PZC yields Fig. 6B with a better view. It is clear from Fig. 6B that PZC for the investigated concentrations are located between -470 and -508.4 mV vs. SCE. A slight difference between the positive and the negative surface charges with respect to PZC of each concentration can also be noticed. In the range of potentials located at -600 to -380 mV vs. SCE, the highest positive charge with respect to PZC is recorded as 4 C/cm2 and, the highest negative charge is around 3.4 C/cm2. With respect to the recorded positive charge, the charge on the metal mercury is positive, thus, the excess charge on the solution side will be negative, which would essentially be induced by an excess of the nitrate anions. By contrast, at potentials below PZC, the excess charge on the metal mercury is negative; hence the excess charge on the solution side is positive induced essentially by the presence of excess
ethylammonium cations. At PZC for each concentration, it is clear that the charge on both sides mercury and EAN solution is zero. The latter can be interpreted by the presence of both ion species, nitrate anion and ethylammonium cation on the EAN solution side, without neglecting water molecule that will preferably be adsorbed in the inner Helmholtz plane. For pure EAN, ion pairs are the species present on the solution side of the interface.
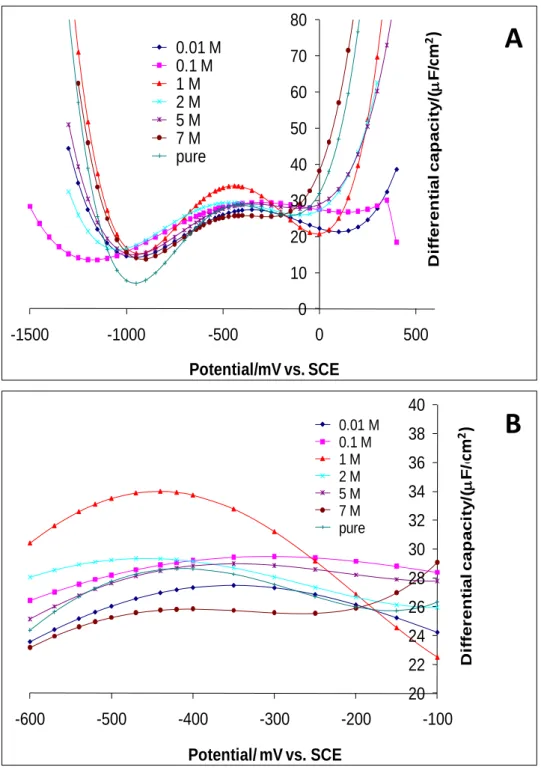
4.3. Differential capacitance of mercury/EAN solutions
Fig. 7A displays the differential capacitance curves (Cd-E) for the various explored
EAN concentrations. The double layer capacitance, Cd, can be assumed of two components in
series that are attributable to two layers: i) Helmholtz layer, CH, and, ii) diffuse layer, CD. This
model known as the Gouy-Chapman-Stern (GCS) model gives predictions that account for the gross features of behavior in real systems that might be useful to access some information about the mercury/EAN solutions interfaces [28,39]:
1/Cd = 1/CH + 1/CD (10)
Generally speaking, the value of СH is independent of potential, but CD varies in the V-shaped fashion that displays a minimum at PZC called the Gouy-Chapman minimum [28]. The composite capacitance, Cd, should have a complex behavior that is governed by the smaller of
the two components of Eq. (10). Near the PZC in systems with larger electrolyte concentrations and small ions size, CD, is so large that it no longer contributes to, Cd, and one
sees only the constant capacitance of, CH. Accordingly, at low EAN concentrations, one can
expect to observe a V-shaped fashion characteristic of, CD. Here, the lowest explored EAN
concentration equals 10-2 M, and unfortunately no minimum can be seen in Fig. 7A around
the PZC. However, it is possible that 10-2 M is not low enough to yield a V-shaped fashion of capacitance around PZC. Theoretically, the concentration has to be lower than 10-2 M.
Nevertheless from the experimental standpoint, the latter is definitely not an easy task because the more the concentration becomes lower, the more the conductivity decreases. There is another factor that may be the reason for the absence of the Gouy-Chapman minimum and the latter has to do with the polynomial regression fitting order. With respect to this, our analysis of the data showed no significant change in the position of the curves minima with the polynomial regression fitting order up to 8. Thus, the absence of the minimum around PZC for the whole range of the explored EAN concentrations suggest that the double layer capacity of mercury/EAN solutions would essentially be attributed to Helmholtz capacity, CH. On the
other hand, two minima on both sides of the PZC for each EAN concentration can clearly be observed in Fig. 7A. The values of the differential capacitance recorded for the minima located at higher potential of PZC are more important than those observed at lower potentials.
This difference can be related to different factors including surface charge, thickness of the double layer and the dielectric constant. If we assume that, CD, is negligible, the double layer
capacitance that is attributable to, CH, can be assimilated to a parallel electric capacitor [28]:
Cd = 0/d (11)
Where, d, represents the distance between the metal surface and the Helmholtz layer, , is the relative dielectric constant in the Helmholtz layer and, 0, is dielectric constant of vacuum.
Accordingly, the large capacitance values recorded at potentials higher than PZC in Fig. 7A can be attributed either to a small distance, d, or to a large dielectric constant, . The distance,
d, essentially depends on the dimensions of the adsorbed species and their orientations at the
interface, while the dielectric constant depends on the solvent properties in the inner layer. With regard to nitrate, the specie is symmetric with a trigonal planar geometry. However, ethylammonium cation has a tetrahedral geometry with an asymmetry that is related to the presence of the ethyl group. The behavior of the differential capacitance observed in Fig. 7A can be related either to the radius of the nitrate anion that is smaller than the radius of the ethylammoinium cation or, to ethylammonium cation that oriented its hydrocarbon chain towards the mercury metal, thus resulting in a larger distance, d, compared to that of the nitrate anion. With respect to dielectric constant, the discussion would only be possible for pure EAN because there will be no water molecules in the inner layer. In that case, the low capacitance values observed for potentials below PZC might be attributed to the weak polarization of the ethylammonium cation from the hydrocarbon chain side, which will consequently be oriented towards the metal mercury.
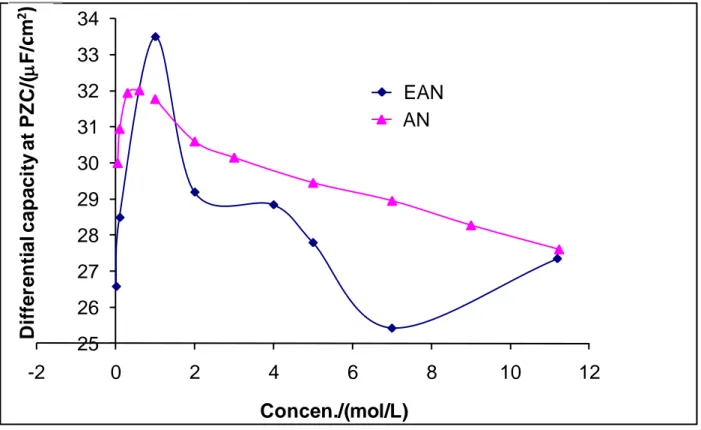
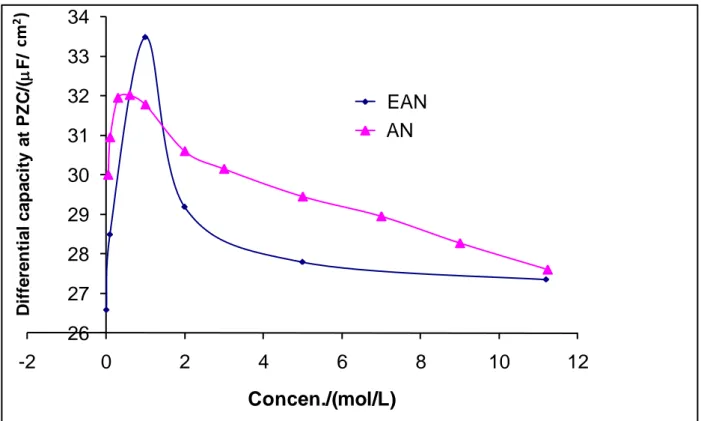
A zoom of Fig. 7A around PZC yields Fig. 7B which shows a better view about the influence of the EAN concentration on differential capacitance. The relationship between the differential capacitance at PZC and the EAN concentration in comparison with AN are gathered in Fig. 8. It will be noted that the two curves of EAN and AN follow similar trend. The two curves depict an initial increase in capacitance at low concentrations (c1 M) followed by a decrease at higher concentrations (c>1 M). Fig. 8 also reveals a particular drop in capacitance at 7 M for the EAN curve compared to the rest of the concentrations. Analysis of the data at 7 M revealed that the results obtained using different polynomial regression fittings are not stable as shown in Fig. 9A. In contrast, for other concentrations, the results are quite stable as evidenced by Fig. 9B for 5 M as an example. This suggests that the experimental results obtained at 7 M EAN may contain errors. If we delete it from Fig. 8 and assume that the particularly elevated value obtained at 1 M is also due to errors (Fig. 10), one
can propose that the differential capacitance values of EAN would overall be lower than those corresponding to AN and, this would essentially be related to presence of the ethyl group in EAN cation. In this context, if we assume that the two ionic species, the anion and the cation, for each interface mercury/EAN and mercury/AN are adsorbed, this difference can be explained by a larger thickness of the Helmholtz layer for mercury/EAN interface, which can be understood by the preferential orientation of ethyl group of the EAN cation towards the metal mercury.
5. Concluding remarks
In this account, the surface tensions between mercury electrode and EAN-water mixtures at various compositions have been measured. Electrocapillarity, surface charge as well as the differential capacitance curves have been obtained. Assumptions that are based on simple hypotheses and comparison of the EAN behavior with respect to that of AN provided information about the ionic structure at the interface mercury/EAN solutions. Influence of the hydrocarbon chain of the ammonium cation is clearly visible on the electrocapillarity maximum. The surface tension reduces as the hydrocarbon chain is elongated (AN, EAN and PAN). The latter has been attributed to two factors: i) replacement of a hydrogen atom with a hydrocarbon chain within the ammonium cation decreases the number of the hydrogen bonds and, ii) elongation of the hydrocarbon chain increases the adsorption of excess cations at the interface. In regard to specific adsorption it is found that the adsorption phenomena become more important as the NEA concentration increases and the maximum effect is observed for pure EAN. Assumption based on liquid-liquid junction potential that is constant for the whole range of the studied concentrations allowed to study the specific adsorption phenomena induced at PZC as a function of the concentration. For low EAN concentrations (c<4 M), the excess adsorption was found to be anionic and reverses to cationic at higher concentrations. The latter differs from the behavior of AN where excess anionic adsorption dominants the whole range of the studied concentrations. The differential capacitance data of mercury/EAN and mercury/AN solutions at PZC as a function of the concentration are found to follow similar trends. However, the capacitance values of mercury/EAN are overall lower than those of mercury/AN. The latter has been interpreted by the preferential orientation of ethyl group of the EAN cation towards the metal mercury.
Acknowledgements
The authors acknowledge the support of CNRS and the University of Paris VI (France) and Natural Sciences and Engineering Research Council of Canada and UOIT (Canada).
References
[1] P. Hapiot, C. Lagrost, Chem. Rev. 108 (2008) 2238.
[2] T. Tsuda, C. L. Hussey, The electrochemical Society Interface, spring (2007) 42. [3] P. Walden, Bull. Acad. Imp. Sci. St Petersbourg 8 (1914) 405.
[4] T. L. Greaves, C. J. Drummond, Chem. Rev. 108 (2008) 206.
[5] D. F. Evans, A. Yamauchi, R. Roman, E. Z. J. Casassa, Colloid Interface Sci. 88 (1982) 89.
[6] D. F. Evans, A. Yamauchi, G. J. Wei, V. A. Bloomfield, J. Phys. Chem. 87 (1983) 3537.
[7] D. F. Evans, S. H. Chen, G. W. Schriver, E. M. Arnett, J. Am. Chem. Soc. 103 (1981) 481.
[8] D. Mirejovsky, E. Arnett, J. Am. Chem. Soc. 105 (1983) 1112.
[9] E. L. Arancibia, R. C. Castells, A. M. Nardillo, J. Chromatogr. 398 (1987) 21. [10] I. M. Herfort, H. Schneider, Liebigs Ann. Chem. 1 (1991) 27.
[11] R. M. Lau, M. J. Sorgedrager, G. Carrea, F. Van Rantwijk, F. Secundo, R. A. Sheldon, Green Chem. 6 (2004) 483.
[12] C. A. Angell, Wang, L. M. Biophys. Chem. 105 (2003) 621. [13] C. A Summers, R. A. Flowers, Protein Sci. 9 (2000) 2001.
[14] J. A. Garlitz, C. A. Summers, R. A. Flowers, G. E. O. Borgstahl, Acta Crystallogr., Sect D 55 (1999) 2037.
[15] T. L. Bushueva, N. V. Medvedeva, A. G. Tonevitsky, U. Pfuller, S. Fiedler, H. Franz, Stud. Biophys. 138 (1990) 229.
[16] U. Pfuller, H. Franz, K. Pfuller, I. Jungham, H. Bielka, Lectins 6 (1988) 299. [17] U. Pfuller, H. Franz, Patent DD262042-A, 1989.
[18] H. Schneider, J. Stroka, Pol. J. Chem. 68 (1994) 795.
[19] J. B. Shotwell, R. A. Flowers, Electroanalysis 12 (2000) 223.
[20] L. Martinot, F. Gubbels, C. Michaux, C. Nemeeger, Radiochim. Acta 57 (1992) 119. [21] L. Martinot, D. Bare, C. Michaux, J. Radioanal. Nucl. Chem. Art. 170 (1993) 389. [22] G. A. Snook, T. L. Greaves, A. S. Best, J. Mater. Chem. 21 (2011) 7622.
[23] M. Allen, D. F. Evans, R. Lumry, J. Solution Chem. 14 (1985) 549. [24] D. Mirejovsky, E. M. Arnett, J. Am. Chem. Soc. 105 (1983) 1112. [25] M. Biquard, P. Letellier, M. Fromon, Can. J. Chem., 63 (1985) 3587.
[26] R. Kanzaki, K. Uchida, X. Song, Y. Umebayashi, S. I. Ishiguro, Analytical sciences 24 (2008) 1347.
[27] Y. Z. Su, Y. C. Fu, Y. M. Wei, J. W. Yan, B. W. Mao, Chemphyschem, 11 (2010) 2764.
[28] A. J. Bard, L. R. Faulkner, Electrochemical methods: fundamentals and applications, 2nd ed., John Wiley, 2001.
[29] J. F. Danielli, Progress in surface and membrane science, Volume 6, Academic Press., 1973, Science, pp 55.
[30] C. Kittel, Quatum theory of solids, John Wiley, New York, 1963, pp 142.
[31] G. Lippmann, Ann. Chim. Phys. 5 (1875) 494; G. Lippmann, J. Phys. Radium 12 (1883) 116.
[32] T. L. Greaves, A. Weerawardena, C. Fong, I. Krodkiewska, C. J. Drummond, J. Phys. Chem. B 110 (2006) 22479.
[33] M. Hadded, H. Bahri, P. Letellier, J. Chim. Phys. 83 (1986) 419. [34] Lange's Handbook of Chemistry, 10th ed. pp 1661–1665.
[35] B. V. K. S. R. A. Tilak, M. A. V. Devanathan, J. Phys. Chem. 73 (1969) 3582.
[36] R. Hayes, S. Imberti, G. G. Warr, R. Atkin, Phys. Chem. Chem. Phys. 13 (2011) 13544.
[37] A. Manzoni, P. R. Mussini, T. Mussini, Journal of Solution Chemistry 28 (1999) 1329.
[38] O. A. Esin, B. F. Markov, Ada Physicochem. USSR 10 (1939) 353. [39] D. C Grahame, J. Am. Chem. Soc. 79 (1957) 2093.
Fig. 1. Schematic representation of the dropping mercury electrode (DME) system used in
this study.
Pt wire mercury reservoir
capillary or working electrode
SCE Reference electrode
junction Argon counter electrode potentiostat Computer Magnetic stirrer Solution
Fig. 2. Variation of density of EAN-water mixtures as a function of the EAN concentration.
0
0.2
0.4
0.6
0.8
1
1.2
1.4
-2
0
2
4
6
8
10
12
D en si ty Concen./(mol/L)Fig. 3. (A) Electrocapillarity curves of EAN-water mixtures at various EAN concentrations,
(B) Comparison between the curves of surface tension at PZC as a function of the concentration of EAN and AN.
250 270 290 310 330 350 370 390 410 430 450 -2000 -1500 -1000 -500 0 500 Su r face ten si o n /(mN /m ) Potential/V vs. ECS 0.01 M 0.1 M 1 M 2 M 4 M 5 M 7 M pure 380 385 390 395 400 405 410 415 420 425 430 -2 0 2 4 6 8 10 12 Su r face ten si o n at PZ C /(mN /m ) Concen./(mol/L) AN EAN
A
B
Potential/ mV vs. SCEFig. 4. (A) Comparison between the electrocapillarity curves of pure EAN with respect to
pure PAN, (B) Relationship between surface the tension at PZC and number of the carbon atoms present within the ammonium cation (AN, EAN and PAN).
250 270 290 310 330 350 370 390 410 -1500 -1000 -500 0 500 S u rf a c e t e n s io n /( m N/m ) Potential V vs.SCE pure PAN pure EAN 375 380 385 390 395 400 405 410 415 -1 0 1 2 3 4 Su r face ten si o n at PZ C /(mN /m )
Number of carbon atoms
A
B
Potential/ mV vs. SCEFig. 5. (A) Variation of PZC as a function of the EAN concentration with respect to that of
AN, (B) Relationship between PZC and number of the carbon atoms present within the ammonium cation (AN, EAN and PAN).
-620 -600 -580 -560 -540 -520 -500 -480 -460 -440 -2 0 2 4 6 8 10 12 PZ C /mV Concen./(mol/L) AN EAN -650 -600 -550 -500 -450 -400 -350 -300 -0.5 0 0.5 1 1.5 2 2.5 3 3.5 PZ C /mV
Number of carbon atoms
A
Fig. 6. (A) Surface charge on the mercury electrode as a function of the potential at various
EAN concentrations, (B) Zoom of (A) around the PZC. -20 -10 0 10 20 30 40 -1500 -1000 -500 0 500 Su r face ch ar g e/ ( C /cm 2) Potential/mV vs. SCE 0.01 M 0.1 M 1 M 2 M 5 M 7 M pure -4 -3 -2 -1 0 1 2 3 4 -600 -550 -500 -450 -400 Su r face ch ar g e/ ( C /cm 2) Potential/ mV vs.SCE 0.01 M 0.1 M 1 M 2 M 5 M 7 M pure
A
B
Fig. 7. (A) Differential capacitance as a function of the potential for the various EAN
concentrations, (B) Zoom of (A) around PZC. 0 10 20 30 40 50 60 70 80 -1500 -1000 -500 0 500 D iff er en ti al cap aci ty /( F /cm ) Potential/mV vs. SCE 0.01 M 0.1 M 1 M 2 M 5 M 7 M pure 20 22 24 26 28 30 32 34 36 38 40 -600 -500 -400 -300 -200 -100 D iffer en ti al cap aci ty /( F /cm ) Potential/ mV vs. SCE 0.01 M 0.1 M 1 M 2 M 5 M 7 M pure
A
B
cm 2 ) cm 2 )Fig. 8. Variation of the differential capacity at the PZC as a function of the concentration of
EAN and AN.
25 26 27 28 29 30 31 32 33 34 -2 0 2 4 6 8 10 12 D iffer en ti al cap aci ty at PZ C /( F /c m) Concen./(mol/L) EAN AN
cm
2)
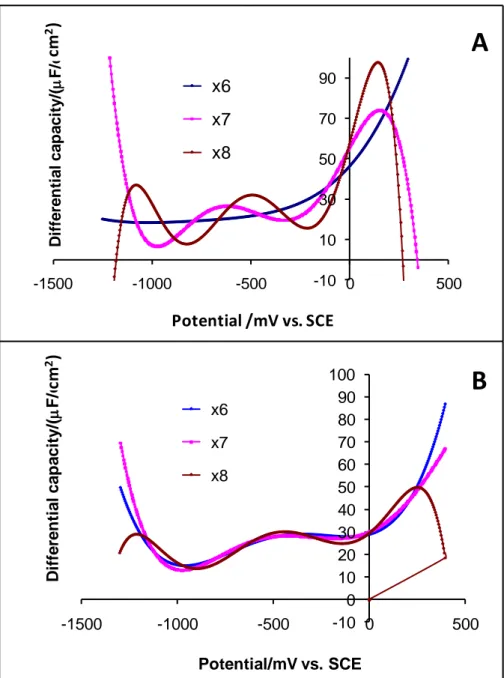
Fig. 9. Variation of the differential capacitance with the polynomial regression fitting order of
6, 7 and 8 for EAN at 7 M (A) and 5 M (B).
-10 10 30 50 70 90 -1500 -1000 -500 0 500 D iffe re n ti a l c a p a c ity /( F /c m ) Potential/ V vs. SCE x6 x7 x8 -10 0 10 20 30 40 50 60 70 80 90 100 -1500 -1000 -500 0 500 D iffe re n ti a l c a p a c ity /( F /c m ) Potential/mV vs. SCE x6 x7 x8
A
B
cm 2 ) cm 2 ) Potential /mV vs. SCEFig. 10. Corrected Fig. 8 26 27 28 29 30 31 32 33 34 -2 0 2 4 6 8 10 12 D iffe re n ti a l c a p a c ity a t PZ C /( F /c m ) Concen./(mol/L) EAN AN cm 2)