D
D
O
O
C
C
T
T
O
O
R
R
A
A
T
T
D
D
Délivré par Discipline ou spécialité :Mme. Rachel Auz Mme. Eliane Souteyrand,
Mme. Sylvie Lorthoi Mr. Bruno Grassl, Mme. Blanca Martin Vaca, Mme. Anne-Françoise Mingotaud
Ecole doctorale :
Unité de recherche : Laboratoire des Interactions Moléculaires et Réactivité Chimique et Directeur(s) de Thèse :
Rapporteurs :
Présentée et so
Titre : NANOSTRUCTURATION
POLYMERS FOR THEIR USE IN PROTEIN DETECTION
T
T
H
H
È
È
S
S
E
E
En vue de l'obtention du
D
D
E
E
L
L
’
’
U
U
N
N
I
I
V
V
E
E
R
R
S
S
I
I
T
T
É
É
D
D
E
E
T
T
O
O
U
U
Délivré par l'Université Toulouse III - Paul SabatierDiscipline ou spécialité : Chimie Macromoléculaire et Supramoléculaire
JURY
Mme. Rachel Auzély Velty, CERMAV, Grenoble, Rapporteur Mme. Eliane Souteyrand, Ecole Centrale de Lyon, Rapporteur
Sylvie Lorthois, IMFT, Toulouse, Examinateur Bruno Grassl, IPREM, Pau, Examinateur lanca Martin Vaca, LBPB, Toulouse, Examinateur
Françoise Mingotaud, IMRCP, Toulouse, Directrice de thèse
Ecole doctorale : Science de la Matière
Laboratoire des Interactions Moléculaires et Réactivité Chimique et Photochimique
Directeur(s) de Thèse : Anne-Françoise Mingotaud & Juliette Fi Rapporteurs : Rachel Auzély Velty & Eliane Souteyrand
Présentée et soutenue par Seila Rodriguez Vilches Le 19 juillet 2011
NANOSTRUCTURATION OF INNOVATIVE MOLECULAR IMPRINTED FOR THEIR USE IN PROTEIN DETECTION
U
U
L
L
O
O
U
U
S
S
E
E
Chimie Macromoléculaire et Supramoléculaire
Rapporteur Rapporteur
Examinateur
Directrice de thèse
Laboratoire des Interactions Moléculaires et Réactivité Chimique et Juliette Fitremann
Eliane Souteyrand
Seila Rodriguez Vilches
OF INNOVATIVE MOLECULAR IMPRINTED FOR THEIR USE IN PROTEIN DETECTION
“When we are children we are all scientists,
but growing up only the few of us treasure
some of this curiosity - the mother of science”
ACKNOWLEDGEMENTS
This PhD Thesis has been done at University of Paul Sabatier in Toulouse, at the IMRCP laboratory. I would like first to thank these two institutions for allowing me to carry on my doctoral studies.
I thank those who have done me the honor of participating in my thesis committee: Rachel Auzély Velty from University of Joseph Fourier (Grenoble), Eliane Souteyrand from Ecole Centrale of Lyon, Sylvie Lorthois from IMFT CNRS of Toulouse, Bruno Grassl from University of Pau and Pays de l’Adour, Blanca Martin Vaca from Paul Sabatier University in Toulouse and Anne-Françoise Mingotaud from IMRCP laboratory in Toulouse.
I would like to express my sincere thanks to all those who have assisted me and offered their support over these years of my doctoral studies.
I would like to express a particular gratitude to my supervisor Juliette Fitremann, who has trusted me on this project. Thank you for the time you spent to correct my manuscript, my reports and helping me prepare my oral presentations.
I would like to express a particular gratitude to Anne-Françoise Mingotaud, who has afforded me constant guidance and encouragement throughout this research project. Thank you for your help in the beginning of my arrival. I am truly indebted to you Anne-Françoise for being my supervisor and teaching me new skills that I have developed over the last few years. I always appreciated your kindness, understanding and attention any time I asked for it. Thank you for all the personal and professional discussions that we had together. You were always helpful, kind and optimistic and you have played an enormous role in my academic and personal development. Thank you also to believe in the project.
I would like to thank Monique Mauzac for hosting me in the laboratory. It was a pleasure to be part of your team. It was always very nice to see you in a good mood and a big smile every morning.
I would also like to thank Innabiosanté Foundation for the financial support of this work.
Thanks to the ITAV (Centre Pierre Potier), LAAS laboratory and Biochips platform of Toulouse Genopole for welcoming in their laboratories.
I would like to express my gratitude to Childérick Severac, who launch the idea of this project several years ago, and who found a way to built it. Without his contribution, this work would have not been possible. Moreover, I have to thanks you for your support in my PhD and help with my work application process.
I would like to express my particular gratitude to Loic Laplatine, who has been a co-worker during approximately six months. Thank you for your professionalism and good ideas. Thanks to this team work, we have achieved one of the challenges of the project.
I also thank Dominique Collin and Philippe Martinoty from Institut Charles Sadron in Stransbourg, for their kind welcome in their laboratory. In particularly, I would like to thanks Dominique Collin who has worked hard to analyze all the solutions that I have sent, in an extremely rigorous manner. I am greatly grateful to him for his dedication.
I would like to thank Vincent Paveau, Jean-Christophe Cau from Innopsys S.A, for their close help and constant support for fluorescence scanner and for setting up the diffraction scanner.
Thanks to Isabelle Fourqueaux from CMEAB at the Faculty of Medicine of Toulouse, Stephanie Balor and Nacer Benmeradi from IBGC Laboratory, Jean-Pierre Laugier from Nice Sofia Antipolis University for the electronic microscopy analyses.
I would like also to thank the rest of the members of my group, Barbara Lonetti, Jean-Baptiste Doucet, Ophélie Riou, Jérôme Ehrhart, Pascale Saint-Aguet, Elisabeth Laurent and Lacramioara Zadoina for the kind support and help, for the good moments that we spent together inside and outside of the lab. I would like to thank in particular Elisabeth Laurent for her guidance in my first year at the IMRCP. You showed me with patience what I needed to be autonomous in the lab. I would like to express a special gratitude to Lacramoiara Zadoina, who is like a sister for me. You have been a big support for me and afforded me pertinent advice. We have shared beautiful moments together in our personal lives. You will be always in my heart. Gracias Lacra.
I would like to thank Joris Irvoas and Marie-Anne Carpene for the friendship they have shown and their support. Good luck for the final straight line!. I would like to express a particular gratitude to Renee Mayap-Talom, we have overcome together the difficulties found during these three years. And for all the nice moments we shared throughout this thesis. I wish you the best.
I would like to express my gratitude to the permanent staff, Jean-Daniel Marty, Christophe Mingotaud, Fabienne Gauffre, Stéphane Gineste, Nancy de Viguerie, Muriel Blanzat, Esther Oliveros, Marie-Thérèse Maurette, Patricia Vicendo, Véronique Pimienta and Christophe Coudret, for the
numerous discussions, scientific or not, that we have
shared throughout my PhD, your good mood, your friendship and your kindness. I would also like to thank Christophe for believing in the Nanotool program which was really the reason why I joined the IMRCP laboratory.
I would like also to thank Florence Frechou, Charles-Louis Serpentini, Sandrine Ferrère, Nadia Laouaf, Fernanda Rodrigues, Arielle Noirot, Danielle Brunet and Yann Morell for all services rendered for your availability, your good humor, sympathy and support.
Thanks to all the students, Anass Dazzazi, Etienne Girard, Pauline Castagnos, Clara Chaouat, Marion Martignac, Virginie Rahal, Julie Massaad, Rawad tadmouri, Stéphane Lemonier.
I would like to express my thanks to my friends (Olaia Gil, Miguel Comesaña, Carlos Giraldo, Raul Garcia Pla, Patricia Lara Muñoz and Miguel Guerrero), and especially to you Sar, whose love, care, support and understanding have been the source of courage for dealing with all the difficult phases and completing this work.
Finally, I am deeply grateful to my parents, who supported me throughout my doctoral work in the distance. The hard work of my parents has brought me to where I am today and has given me the encouragement to carry out and complete this work – I dedicate this thesis to them.
III
TABLE OF CONTENTS
ABBREVIATIONS…………..………....IX INTRODUCTION………...1 I. BIOSENSORS………..…...6 I. 1. Bioreceptors ... 8 I. 2. Biosensor Interface ... 9 I. 2. 1. Adsorption Approach ...10 I. 2. 2. Diffusion Approach ...11 I. 2. 3. Covalent Attachment ...11I. 2. 4. Affinity Attachment. Capture Molecules. ...12
I. 2. 5. Summary ...16 I. 3. Transducer ... 16 I. 3. 1. Electrochemical Transducer ...17 I. 3. 2. Optical Transducer ...18 I. 3. 3. Piezoelectric Transduction ...20 I. 3. 4. Summary ...21 I. 4. Miniaturization ... 23 I. 5. Conclusions ... 24 II. MOTIVATION………..24 BIBLIOGRAPHY………..…...27 RÉSUMÉ INTRODUCTION ………29
IV
CHAPTER I. MIP HYDROGELS, SYNTHESIS AND CHARACTERIZATION…....35
I. MOLECULAR IMPRINTED POLYMERS -STATE OF THE ART... 39
I. 1. History-General Introduction ...39
I. 2. MIP for Protein Recognition ...42
I. 2. 1. Recent Accomplishments ...43
I. 2. 1. 1. Process Choice ...45
I. 2. 1. 2. Synthesis Method ...48
II. SYNTHESIS ... 52
II. 1. Selection of the Chemical Polymerization System ...52
II. 2. Results ...53
III. CHARACTERIZATION ... 60
III. 1. Polymerization Kinetics. ...60
III. 1. 1. Raman Spectroscopy...60
III. 1. 2. Piezo-Rheometry. ...63
III. 1. 2. 1. Results ...65
III. 1. 2. 2. Conclusions ...74
III. 2. Swelling Ratio ...75
III. 3. Pore Size Distribution ...80
III. 3. 1. Electron Microscopy ...80
III. 3. 1. 1. Results ...81
III. 3. 1. 2. Discussion ...84
III. 3. 2. Atomic Force Microscopy-AFM ...85
III. 3. 3. Thermoporometry by Differential Scanning Calorimetry (DSC) ...88
III. 3. 3. 1. Results ...90
III. 3. 3. 2. Discussion ...95
IV. GENERAL CONCLUSIONS ... 97
V
RÉSUMÉ CHAPITRE I ………..103
CHAPTER II. HYDROGEL NANOSTRUCTURATION……….113
I. BIBLIOGRAPHIC INTRODUCTION ... 117
I. 1. Conventional Imprinting Techniques ...117
I. 1. 1. Photolithography ...117
I. 1. 2. Scanning Beam Lithography ...121
I. 2. Next Generation Imprinting Lithography ...122
I. 2. 1. Extreme Ultraviolet Lithography (EUV) ...122
I. 2. 2. Nanoimprint Lithography (NIL) ...122
I. 2. 2. 1. Thermal Nanoimprint Lithography (T-NIL) ...123
I. 2. 2. 2. UV Nanoimprint Lithography (UV-NIL) ...124
I. 2. 2. 3. Thermal NIL versus UV-NIL ...126
I. 2. 3. Soft Nanoimprint Lithography ...126
I. 2. 3. 1. Replica Molding (REM) or Soft UV-NIL ...128
I. 2. 3. 2. Solvent Assisted Micromolding (SAMIM) ...129
I. 2. 3. 3. Microcontact Printing (µCP) ...130
I. 3. Hydrogel Patterning ...132
II. PROCESS FOR HYDROGEL NANOSTRUCTURATION ... 136
II. 1. Surface Substrate Modification ...137
II. 2. Preliminary Millimetric Structuration of the Hydrogel without Lithographic Molds ...140
II. 3. Structuration of the Hydrogel using Micrometric Lithographic Molds ...141
II. 3. 1. Soft PDMS Mold...144
II. 3. 2. Soft NOA73 Mold ...146
II. 3. 3 Hard Silicon Mold ...149
II. 4. Structuration of the Hydrogel using Nanometric Lithographic Molds ...149
II. 4. 1. Soft NOA73 and SU-8 Molds ...150
II. 4. 2. Hard Silicon Mold ...151
VI
IV. PROFILOMETER ... 156
V. GENERAL CONCLUSIONS ... 157
BIBLIOGRAPHY ... 159
RÉSUMÉ CHAPITRE II ... 163
CHAPTER III. PROTEIN DETECTION ... 169
I. BIODETECTION VIA FLUORESCENCE ... 174
I. 1. Theoretical Background ...174 I. 1. 1. Photostability ...176 I. 1. 2. Fluorescence Labeling ...176 I. 1. 2. 1. Organic Fluorophores...177 I. 1. 2. 2. Nanoparticles...178 I. 1. 2. 3. Fluorescent Proteins ...180 I. 1. 3. Polymer Networks ...181 I. 1. 4. MIPs ...183
I. 2. Preliminary Considerations for MIP Rebinding Characterization by Fluorescence ...186
I. 2. 1. Fluorescence Scanner ...186
I. 2. 2. Experimental Parameters Set up ...187
I. 3. MIP of Streptavidin. ...192
I. 3. 1. Biotin- DY-636 as Secondary Probe. ...192
I. 3. 2. Rebinding step with STV-Cy5 ...195
I. 3. 3. Conclusions ...198
II. DETECTION IN THE ABSENCE OF LABELED MOLECULES: THE LIGHT DIFFRACTION TECHNIQUE ... 199
II. 1. State of Art ...199
II. 1. 1. Theoretical Background ...199
II. 1. 2. Biomolecular Detection ...203
VII
II. 2. 1. Prototype Diffraction Scanner ...210
II. 3. Results: Application to Soft Hydrogel Diffraction ...210
II. 3. 1. Alignment of the Gratings ...211
II. 3. 2. The Mold and Nanostructuration of the Hydrogel ...212
II. 3. 3. Variation of the Diffracted Signal with Drying ...213
II. 3. 4. Variation of the Diffracted Signal with Dry/Swollen cycles ...215
II. 3. 4. 1. Variation of the Diffracted Signal with the Same Mold ...215
II. 3. 4. 2. Variation of the Diffracted Signal with Different Molds ...216
II. 3. 5. Preliminary tests with MIP-Streptavidin and NIP ...217
II. 3. 5. 1. MIP- Streptavidin. Recognition by Biotin-DY-636 interaction ...218
II. 3. 5. 2. MIP-streptavidin. Recognition by STV-Cy5 interaction ...221
II. 3. 6. Conclusions ...222
III. GENERAL CONCLUSIONS ... 223
BIBLIOGRAPHY ... 224
RÉSUMÉ CHAPITRE III ... 227
OVERALL CONCLUSIONS AND PERSPECTIVES ... 233
CONCLUSION GÉNÉRALES ET PERSPECTIVES ... 237
ANNEXE CHAPTER I... 241
ANNEXE CHAPTER II ... 251
X Abbreviations
Abbreviations XI
XI
ABBREVIATIONS
∆Ha : apparent melting enthalpy of a solvent.
∆Hf : melting point of the solvent
∆T: transition temperature shift
AEMHC: 2-aminoethyl methacrylate hydrochloride AFM : atomic force microscopy
BSA: bovine serum albumin
CryoSEM: cryogenic scanning electron microscopy DSC: differential scanning calorimetry
dq/dt: heat flow recovered by DSC DTS: dodecyltrichlorosilane
dR
dv : pore size distribution
e- beam: electron beam lithopgraphy EUVL : extreme ultraviolet lithography Ɛ: shear stain
G’: shear modulus G’’: viscous modulus
GEMA: α,β-glucosyloxyethylmethacrylate GFP : green fluorescence protein
GST : glutation-S- transferase HEMA: 2-hydroxyethylmethacrylate HHMP : 2-hydroxy-4’-(2-hydroxy-ethoxy)-2-methylpropiophenone H-PDMS: hard polydimethylsiloxane I : lamp power IF : imprinting factor
XII Abbreviations
XII
NIL: nanoimprint lithography NIP: non imprinted polymers Mab: monoclonal antibody
mBisA: N, N-methylenebisacrylamide MIP: molecularly imprinted polymers
MPS: γ-methacryloxypropyltrimethoxysilane OTS: octadecyltrichlorosilane
Pab: polyclonal antibody PBS: phosphate buffer solution
PCR: polymerase chain reaction PDMS : polydimethylsiloxane
PEG 1000 DMA: Polyethyleneglycol dimethacrylate pI: isoelectric point
PMMA: Polymethylmethacrylate PU: polyurethane
QCM: quartz crystal microbalance REM: replica Molding
RIE: reactive ion etching Rp : pore size
SAMIM: Solvent Assisted Microcontact Molding SAMs: self-assembled monolayers
SDS: sodium dodecyl sulfate. SEMA: 2-Sulfoethylmethacrylate SEM: scanning electron microscopy
S-FIL: step and Flash imprinting lithography SPR: surface plasmon resonance
Abbreviations XIII
XIII
STV: streptavidin
Tm: melting/solidification temperature of the solvent confined in the pore
To: melting/solidification temperature of the bulk solvent
TEM: Transmission electron microscopy T-NIL: Thermal nanoimprint lithography Tg: Glass transition
UV-NIL: ultraviolet nanoimprint lithography µCP: Microcontact Printing
XIV Abbreviations
2 Introduction
Introduction 3 3
TABLE OF CONTENTS
I. BIOSENSORS... 6 I. 1. Bioreceptors ... 8 I. 2. Biosensor Interface ... 9 I. 2. 1. Adsorption Approach ... 10 I. 2. 2. Diffusion Approach ... 11 I. 2. 3. Covalent Attachment ... 11 I. 2. 4. Affinity Attachment. Capture Molecules. ... 12 I. 2. 5. Summary ... 16 I. 3. Transducer... 16 I. 3. 1. Electrochemical Transducer ... 17 I. 3. 2. Optical Transducer ... 18 I. 3. 3. Piezoelectric Transduction ... 20 I. 3. 4. Summary ... 21 I. 4. Miniaturization ... 23 I. 5. Conclusions ... 24 II. MOTIVATION ... 24 BIBLIOGRAPHY ... 274 Introduction
Introduction 5
5
“The principles of physics, as far as I can see, do not speak against the possibility of maneuvering things atom by atom. It is not an attempt to violate any laws; it is something, in principle, that can
be done; but, in practice, it has not been done because we are too big.” (R.P. Feynman 1959, There’s plenty of room at the bottom)
In 1959, Richard. P. Feynman gave a speech describing the coming technology for making, manipulating and controlling things on a small scale.[1] At that time, the miniaturization was still a supposition. It was necessary to wait until the 1980s to see those technologies emerge. Nowadays, nanotechnology is present in several aspects of our daily life. From a general point of view and according to the IUPAC definition, nanoscience and nanotechnology are science and technology
concerning objects of nanometer dimension (nanoscale about 1 to 100 nm, 1nm ~ 10-9 m), which are atoms (tenths of nanometers) and molecules (nanometers).[2] Nanotechnology encloses several
science fields, including chemistry, biology, physics, material science, and engineering. Even more than that, nanotechnology is the fusion of all of them. According to U.S National Nanotechnology Initiative (NNI) “nanotechnology is not just a new field of sciences and engineering, but a new way
of looking and studying”.[3]
In agreement with this new way of studying, nanotechnology has offered new technologies to better understand the biological systems down to single molecules and has given new refining techniques for medical diagnostics and biomolecular detection. Moreover, great efforts have been made to find technologies with minimal or non-invasive processes. The development of DNA microarrays coupled to fluorescence technique in the early 90s opened the possibility to study thousands or millions of genes simultaneously.[4] Such a characterization of human genome would yield the identification of several disease genes.
The subject presented in this manuscript is a typical example of the multidisciplinarity of nanoscience, in between chemistry, biology and physics. Indeed, our main objective was the fabrication of a device for early detection of cancer biomarkers without the need of labeling. Currently, the diagnostic tools in the case of cancer consist, in particular, in tracking some dysfunctional proteins which are biomarkers of the disease state. These biomarkers are identified and quantified by methods relying on their recognition by their respective antibodies (e.g. immunohistochemistry). However, the production of antibodies specific of a given protein requires successive, long and costly biotechnological steps. In addition, the detection of the protein-antibody
6 Introduction
6
complexation also requires a complex step for labeling the antibody with a “tag” allowing its detection by a suitable equipment.
Therefore, ONCOMATE project (“Olfactory” Nano-detection of Cancer Obtained from Machine learning TEchnology) was born from the initiative of four laboratories and one local company: the LAAS laboratory (Laboratory for analysis and architecture of systems, groups LAAS-NBS and LAAS-DISCO), the Biochips platform of Toulouse Genopole (CNRS-INRA-INSA), Claudius Regaud Institute (ICR-INSERM), IMRCP laboratory (Laboratory of Molecular Interactions and Chemical and Photochemical Reactivity) and Innopsys S.A. They were inspired by an innovative and interdisciplinary approach to develop and improve the detection of protein biomarkers by combining three main technologies: molecularly imprinted polymers (MIP) technique, label-free detection based on light diffraction by nanoscale structures and the use of machine learning tools for processing the database of patients. Detecting and quantifying the desired biomarkers being at the centre of the subject, the following introduction will first present an overview of biosensing.
I. Biosensors
A sensor is defined as an integrated self-containing device that recognizes the presence of the species of interest and converts it into an output signal. This signal provides a specific, quantitative or semi-quantitative analytical information. Biosensors specificity is to include a biological element, either in the device itself or in the engineering method. Biosensors consist, on the one hand, of a biological recognition element, which acts upon a biochemical mechanism, and, on the other hand, of a transducer relying on electrochemical, mass, optical or thermal principles (see Figure 1).[5]
Introduction 7
7 Figure 1. Schematic illustration of biosensor principle.
The bioreceptor or biorecognition molecule (e.g. enzyme) as its name suggests, is capable of specifically recognizing a target substance. It is the component which determines the specificity of the biosensor. The bioreceptor is immobilized on the transducer surface and thus constitutes the sensitive layer of the biosensor. The transducer (e.g. potentiometric biosensors) converts the recognition event in a measurable output and the sensitivity of the biosensor will depend on it. Depending on the transducer method, the latter can be divided into labeled (the signal is measured by the labeled compound) or label-free types (the signal is achieved when the analyte binds to the receptor). In addition, due to the inherent fragility of biological elements to harsh conditions, the biosensor preparation must be carried out in mild conditions (such as temperature and pH) in order to preserve their native form. Clark and Lyons in 1962 developed the first biosensors that were marketed in 1975 by Yellow Springs Instrument Company. These were composed of the glucose oxidase enzyme which was immobilized onto an amperometric oxygen electrode for determination of glucose.[6] Thenceforth, the development of biosensors and their miniaturization have grown up and several parameters have been improved such as the reduction of the sample required for the analysis, higher sensitivity and selectivity, lower detection limits and high-throughput, fast and real-time analysis.
8 Introduction
I. 1. Bioreceptors
Biosensors can be subdivided into t catalytic and affinity biosensors (see
Figure 2. Classification of biosensors with respect of
Catalytic biosensors mostly
They are based on catalytic reactions between the analyte and the enzyme to give a product measurable form.[7] The enzymes are also used to enh
Antibody-antigen complex recognition elements used in affinity action for these biosensors relies on affinity bioreceptors display high specificity
the catalytic ones. However, this interaction is almost irreversible whereas are in most of the cases auto-regenerated. Affinity
range efficient concentration because of antibody-antigen complexes, process, multistep fabrication and on DNA microarrays have been complementary DNA (cDNA).[4]
Molecular imprinting is a technique for creat molecule in a synthetic polymer. MIPs are produce
presence of a template. Upon removal of the target molecule, a cavity remain
Catalytic biosensors
Enzymes Microorganism
8
Biosensors can be subdivided into two classes, based on their mechanism of (see Figure 2).
ors with respect of bioreceptor types.
mostly use enzymes and microorganisms as the
They are based on catalytic reactions between the analyte and the enzyme to give a product The enzymes are also used to enhance amplification signals in
antigen complexes also called “inmunoreceptors” are t in affinity-based biosensors (see Section I. 2. 4)
action for these biosensors relies on specific binding of the analyte to the receptor.
display high specificity and affinity for the analyte and sometimes higher than However, this interaction is almost irreversible whereas the biocatalytic elements
regenerated. Affinity-based biosensors sometimes present because there is a saturation of the bioreceptor.
es, antibodies show several disadvantages such as
and high price to produce. Another kind of affinity biosensors based on DNA microarrays have been widely developed due to the large and expanding data
These biosensors are made also with cells and
imprinting is a technique for creating receptor sites which are specifi
in a synthetic polymer. MIPs are produced by polymerizing functional monomers in presence of a template. Upon removal of the target molecule, a cavity remain
Receptors
Microorganism MIP
Affinity biosensor
Antibodies DNA
their mechanism of recognition,
the recognition element. They are based on catalytic reactions between the analyte and the enzyme to give a product in a
ance amplification signals in other systems. are the most common (see Section I. 2. 4). The mechanism of to the receptor. In general, and sometimes higher than the biocatalytic elements sometimes present a narrow . Despite the wide use such as time consuming Another kind of affinity biosensors based and expanding database of These biosensors are made also with cells and lectin proteins.
which are specific to a target by polymerizing functional monomers in the presence of a template. Upon removal of the target molecule, a cavity remains whose shape, size,
Affinity biosensor
Introduction 9
9
functionality and spatial arrangement are complementary to the imprinted molecule. These selective recognition sites enable MIPs to bind target molecules with affinity and selectivity which has reached, in some examples, those of natural receptors. These biomimetic receptors display several advantages over their natural analogues such as low manufacturing cost, robustness and high stability. MIP receptors have already been used for diagnostic and pharmaceutical applications. For instance, Polyintell is a company founded in 2004 by K. Haupt and cofounders using MIPs for those applications.[8] A detailed description of MIPs will be given in Chapter I.
I. 2. Biosensor Interface
The challenge of fabricating biosensors relies on the correct choice of a solid surface depending of the final application. Moreover, the development of the interface layer to tether the receptor near to or onto the transducer surface is a critical step. The latter must be carried out by selecting a surface chemistry which is compatible with the receptor while maintaining its native conformation and biological function (see Figure 3).
Figure 3. Schematic illustration of protein surface immobilization. a) Ideal case in which proteins are uniformly orientated, properly folded and optimally spaced. b) Non-ideal situation in which proteins are immobilized in various orientations, with varying degrees of denaturation aggregates and with the presence of non-specific adsorbed proteins.[9]
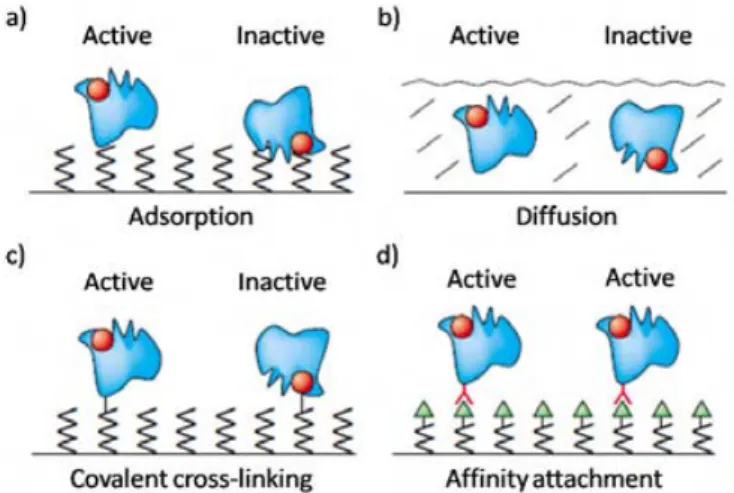
In this section, we will discuss the parameters that need to be controlled in protein biochips. We have divided the methods to immobilize the receptor molecules, in adsorption, diffusion (entrapped) and covalent and affinity binding to a support as shown in Figure 4.
10 Introduction
10
Figure 4. Protein surface immobilization strategies. The red dots represent the active sites of the proteins.[10]
I. 2. 1. Adsorption Approach
The protein immobilization by adsorption approach relies on the physical adsorption of the protein onto a support. Owing to their complex structure, proteins can adsorb onto the surface mainly through hydrophobic, electrostatic and van der Waals interactions. Regarding the solid surface type, gold is one of the most currently metallic substrates used in biosensors with electrochemical and surface plasmon resonance (SPR) transducers.[11] Gold surface offers several attractive properties such as electrical conductivity and compatibility for self-assembled monolayers (SAMs) deposition. Glass is another solid surface widely used for biosensors as well as microarrays. For instance, Affymetrix is the world's leading company in high-density DNA arrays on glass slides.[12] Glass and silicon surfaces are usually adopted for optical sensors due to the transparence (glass) and minimal degree of fluorescence. Moreover, they display suitable rigidity, flatness and their surface can be modified by several modification surface processes. For instance, they can be first activated by oxygen plasma or pirhana solution (H2O2/ H2SO4) and then modified
with organosilane reagents. Synthetic polymers are an alternative for protein surface immobilization due to their low price. Generally, they have to be modified to offer a surface compatible with the proteins. Examples of synthetic polymers used mostly in microfluidic technology are poly(dimethylsiloxane) (PDMS), poly(methyl methacrylate) (PMMA) or polycarbonate (PC).[13]
The main obstacle presented in the elaboration of proteins biosensor is the non-specific interactions. Consequently, any protein present in the biological sample in contact with the biosensor can be non-specifically bound. Such non-specific binding can exceed the detection of the desired analyte interaction. In order to avoid this, several processes have been developed. For
Introduction 11
11
instance, the use of SAMs based on oligo (ethylene glycol) derivatives is very efficient because they offer a hydrophilic surface in which the water layer on the oligomer resists to protein adsorption. In addition, blocking agents such as bovine serum albumin (BSA) or casein from skim milk powder are currently used to control non-specific protein adsorption.[14] Furthermore, the proteins can be adsorbed with various orientations reducing their biological activity (see Figure 4a). A shortcoming of this approach is that the attachment by adsorption is usually weak and reversible. In fact, the molecules can be easily desorbed from the surface by simple rinsing.
I. 2. 2. Diffusion Approach
Proteins can also diffuse without chemical modification in the porous matrix of polymer membranes (nitrocellulose, poly-L-lysine or nylon) or hydrogels (polyacrylamide, agarose, dextran, polysaccharides or poly (ethylene glycol)) which are covalently attached to glass slides (see Figure 4b). The main advantage of these materials lies in their aqueous environment, which minimizes protein denaturating. However, some inactivation can still occur depending on the matrix and the orientation of the protein inside. In some cases, these matrixes can also hinder optical detection due to their high background signal. Furthermore, because the analyses are generally carried out at room temperature, one of the major limitations in biosensors when using membranes or hydrogels is the ability to preserve the humidity of the materials while measuring the recognition event.
I. 2. 3. Covalent Attachment
Proteins can be immobilized on a solid support by covalent bonds through many of their functional groups, which lead to a strong attachment and high protein density. It can be carried out on glass slides functionalized with epoxides, primary amines, aldehydes or N-hydrosuccinimide esters (NHS). This approach is suitable for protein immobilization. However, since the proteins have numerous functional groups, a random organization can occur through the lateral side-chains (see Figure 4c). Consequently, the protein can suffer changes in its conformation, losing its activity or making it inaccessible.[10]
12 Introduction
12 I. 2. 4. Affinity Attachment. Capture Molecules.
This approach is based on the high specific affinity between some capture molecules and their target molecule. The substrate is usually first modified using different surface chemistries, leading to the functional groups necessary to immobilization of the capturing entity.
Among others (see Figure 5),[15, 16] antibodies which display high affinity with proteins are used to “capture” them. Otherwise, aptamers can be used. They are single-strand oligonucleotide sequences (DNA or RNA), artificially synthesized, which are able to recognize various target molecules with a high affinity and specificity. They can be an alternative to antibodies because they are more stable and their production on a large scale is less expensive; however, their affinity constant can be smaller.
Figure 5. Different classes of molecules acting as capture molecules.[15]
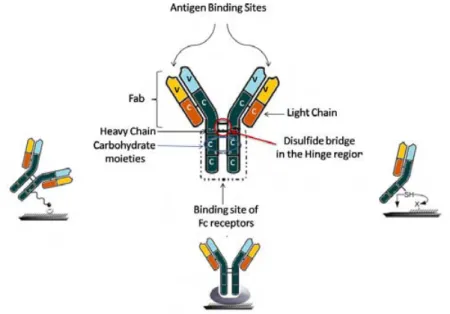
Antibodies are robust proteins, also called immunoglobulins produced by specific B lymphocytes (plasma cells) in response to the invasion of foreign molecules (antigen) in the body. Antibodies structure is generally represented as a Y-shape and it is constituted of four polypeptide chains: two identical copies of a heavy chain and two of a light chain linked by disulfide bonds (see Figure 6). These chains are composed of two arms, Fab (fragment antibody) and a tail, Fc (crystalizable fragment) with variable (V) and constant(C) regions. On one hand, variable regions (amino acids) of the antibody contain two available sites to bind an antigen.[17] On the other hand, the tail (Fc), which is constituted of carbohydrate moieties, can be used for antibody immobilization onto the substrate when the antibody is employed as a capture molecule. In addition, the antibody can be immobilized onto the substrate by the thiol group in Fab fragments.[18]
Introduction 13
13
Figure 6. Schematic illustration of antibody structure with the three sites dedicated for oriented immobilization.[19]
We can differentiate two different types of antibodies depending on the fabrication procedure: monoclonal (Mab) and polyclonal antibodies (Pab). Monoclonal antibodies are produced by a unique B lymphocyte generating one type of antibody which specifically recognizes one region (epitope) on an antigen. Polyclonal antibodies are fabricated by using a mixture of B lymphocytes, therefore generating multiple antibodies that recognize several epitopes on an antigen. Whether one chooses to work with monoclonal or polyclonal antibodies, mainly depends on the intended application. For instance, the production of Pabs is carried out in a relative short time (4-8 weeks) and requires low technology, whereas Mabs production is obtained after months using high technology.[20] Pabs offer higher affinity and lower specificity than Mabs. This is due to the fact that the polyclonal antibodies can recognize multiple independent epitopes on any antigen, while Mabs can recognize only one epitope on an antigen. Hence, Pabs will be suitable when the proteins are immobilized on the array and the antibodies are used as a probe molecule with a linked fluorophore or an enzyme, increasing the possibility to recognize the desired analytes. However, this can lead to a high background staining due to the non-specific interactions. Therefore, no protein quantification is possible but a relative quantification of abundance between samples is possible. When, Pabs are used as capture molecules and a mixture of labeled proteins are added to the array, a high cross-reactivity is obtained. To reduce it, a pre-purification of the analyte sample can be carried out, but is not really suitable. The Pabs are also suitable when the protein could have suffered some conformational changes in its structure (e.g. slight denaturation). Mabs are limited when the protein conformation changes, but can be useful to evaluate such a change. They are more
14 Introduction
14
adapted for the sandwich detection approach in which two antibodies (one immobilized onto the surface and one as a probe molecule) are used concurrently.[21] The main differences between monoclonal and polyclonal antibodies are summarized in the following Table 1.
MONOCLONAL ANTIBODY POLYCLONAL ANTIBODY
Production
Expensive and long production by conventional techniques
Less expensive and more rapidly production
High technology required Technology required is low Can produce large amounts of
specific antibodies
Produce large amount of non specific antibodies
Characteristics High specificity High affinity
Recognition Recognize one epitope from one antigen
Recognize multiple epitopes on any antigen
Table 1. Main differences between monoclonal and polyclonal antibodies.
Another strategy to immobilize proteins involves the fusion of the protein of interest and a capture protein such as glutathione-S-transferase (GST) tag that reacts to form covalent linking with the modified surface.[16, 22] This approach is used to study protein-protein interaction. In addition, the protein of interest can be fused with high affinity tags such as oligohistidine tag. Fusion of site-specific peptide reactive moiety to native proteins is obtained with high selectivity by genetic recombination at a defined terminal position.[19] Then, it is linked via this tag to a complementary group previously grafted onto the surface (see Figure 4c). Therefore, it is highly favorable for molecule immobilization, preserving the native protein conformation and its biological activity while the attached proteins may be homogeneously oriented. The advantage of the latter method over others is that the affinity tag is a small peptide, thus possibly causing minimal effect to the target protein. However, the binding between the groups at the surface and the tag is reversible. This fact can be considered as a drawback when several analyses are done due to the loss of reproducibility or an advantage owing to the recyclability of the surface device for repeated use.
Biotinylated surfaces are widespread as immobilization supports for several surface applications. This method is based on the specific biomolecular interaction between biotin and
Introduction 15
15
streptavidin. They have high affinity (KA= 1015 M-1 ),[23] forming a very strong and stable complex
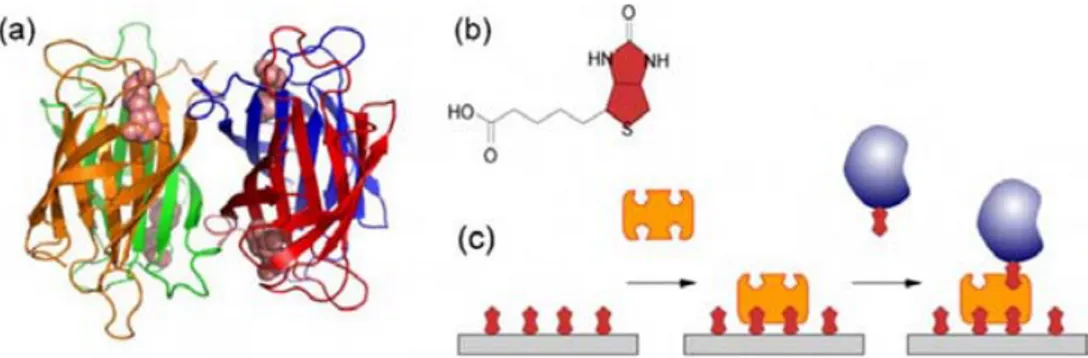
(almost irreversible). Streptavidin has four identical monomer subunits each of which binds one biotin molecule. Usually, taking advantage of the stoichiometry of the complex, a sandwich approach is used, in which streptavidin is deposited on the biotinylated surface in a first step. Then, the free sites on streptavidin are used to capture botinylated proteins (see Figure 7).
Figure 7.Immobilization through biotin/streptavidin interaction. (a) Structure of tetrameric streptavidin (ribbon model) with four biotin molecules (space-filling model). (b) Structure of biotin. (c) Immobilization of a biotinylated protein in a sandwich format.[24]
16 Introduction
16 I. 2. 5. Summary
Table 2 summarizes the main characteristics of each immobilization technique. As described above, the choice of the procedure depends on the nature of the biological element, transducer type, physico-chemical properties of the analyte and the working conditions of the biosensor.
Immobilization technique Description Interface (examples) Advantages Disadvantages Adsorption Attachment of receptor by ionic interactions, H bonding and Van der Waals forces
Gold Glass Silicon Simple. Low cost. Regenerable Matrix. No protein modification.
High protein binding
Non-specific adsorption. Weak attachment : Protein removal by extern conditions High background Diffusion (Entrapment) Physical retention of the receptor inside the matrix cavities Hydrogels Nitrocellulose Poly-lysine Low cost. Mild conditions. No protein modification.
High protein binding.
No regenerable. High background.
Covalent Covalent bonding of the receptor with chemical groups in the matrix or directly on the transducer Chemical active surface: Aldehyde Epoxy Active ester Stable.
High density and strong protein attachment. Random orientation Protein modification. Complexity. Moderate cost. Not regenerable. Affinity Biomolecular specific interaction Biotin Fusion proteins Antibody Oriented proteins. Low background. Strong, specific and high density protein attachment.
Protein modification. Expensive.
Table 2. Advantages and disadvantages of the most common immobilization techniques in the fabrication of biosensors.[10, 24, 25]
I. 3. Transducer
The transducer system is the element that converts into an electrical signal the physical or chemical changes resulting from the interaction between the recognition element and the analyte of interest. The signal generated by the transducer in some cases cannot be interpreted directly and it is necessary to use a software to process it. There are several types of transducers: electrochemical, optical, piezoelectric, acoustic and less common thermal transducers. In this section, we will focus on the main transducers used nowadays.
Introduction 17
17 I. 3. 1. Electrochemical Transducer
This type of transducers transforms the electrochemical signal produced by the interaction between the bioreceptor and the analyte in an electrical current. It provides specific quantitative information. The bioreceptor and the transducer element should be in intimate contact.
There are three main different types of electrochemical biosensors: potentiometric, conductimetric and amperometric. It is generally used with biocatalytic recognition events such as enzymatic reactions generating electroactive substances, leading to changes in pH or potential.
Potentiometric biosensors are system that measures the change in potential generated by ions or chemical and immunoreactions at electrodes. The major advantage of these biosensors lies in the employment of inexpensive equipment and they offer fast/readily response. These devices are highly developed for urea detection (main end-product of protein metabolism). In addition, their use for biomedical analysis (e.g. protein detection) has been investigated. However, other techniques seem to be more promising for this purpose. (for further information the reader is addressed to ref.[26])
Conductimetric devices measure the changes in the conductance of the biological matter occuring between a pair of metal electrodes (such as silver, gold or platinum). One example of conductimetric biosensor based on electrochemical immunoassay was presented by Alocilja et al.[27] They developed a biosensor to detect foodborne pathogens such as Escherichia coli O157:H7 and Salmonella spp., using a sandwich assay. The authors reported that this biosensors showed high selectivity and suitable for yes/no (qualitative) detection.
Amperometric biosensors are related to the current produced during redox processes usually at constant applied potential. Since most proteins cannot intrinsically act as a redox partner in electrochemical reactions molecules such as enzymes (horseradish peroxidase HRP or alkaline phosphatase ALP) are used to label the probe molecules. In 2008, Rao et al.[28] developed an amperometric biosensor to detect Plasmodium falciparum histidine-rich protein 2 (PfHRP-2) in the serum of humans with P. falciparum malaria via a sandwich enzyme-linkedimmunosorbent. They used screen-printed electrodes (SPEs), modified with gold nanoparticles and nanotubes. Rabbit anti-PfHRP-2 antibodies were first immobilized onto modified SPEs and bovine serum albumin (BSA) was then introduced to reduce non-specific interactions. Afterwards, serum sample was added,
18 Introduction
18
followed by rabbit anti-PfHRP-2 antibody and rabbit anti-mouse IgG-ALP congujate. The detection limit was evaluated at 8 ng/ml.
Figure 8. Schematic illustration of the preparation of a modified SPE and steps involved in immunosensor detection. Red diamonds represent PfHRP-2 antigen. BSA, bovine serum albumin.[28]
I. 3. 2. Optical Transducer
The optical devices are related to the measurement of changes occurring in the properties of light when an interaction between the analyte of interest and the bioreceptor takes place. It can be fluorescence, luminescence, scattering or refractive index changes when light is reflected on the surfaces of recognition. The basic measurement system consists of a light source, the sensing element and the detector. Two different methods exist: direct detection in a label-free approach or indirect detection, where it is necessary to tag the molecules. Transducers with optical properties widely vary depending on the properties, including optical fiber sensors, surface plasmon resonance (SPR) and evanescent wave sensors. They show several advantages over electrochemical biosensors. For instance, they can be easily miniaturized such as optical fibers which can be used for in vivo measurements. The signal does not interfere with the presence of ions, or magnetic or electrical fields. The analyte is not consumed during optical measurements. Moreover, they are highly sensitive and more than one analyte can be detected simultaneously. SPR has recently been
Introduction 19
19
used as the basis for the optical signal transduction in biosensor development. A brief description of this signal-transduction mechanism will be discussed.
SPR transducer is constituted by a glass slide support coated with a thin metal film as an interface element (e.g. gold or silver) (see Figure 9). The bioreceptor is immobilized on the surface and the target solution is introduced in a cell.[29] The binding event between the bioreceptor and the analyte is measured by changes in the refractive index of the sensor layer. A wide range of systems can be analyzed, such as cells or small molecules. Nowadays, among several systems available for biomolecular interactions, SPR-based biosensing developed by BiacoreTM is one of the widely used real-time monitoring systems commercially available and it is compatible with a wide range of species.[30] The main advantages of this technique are the non-invasive optical measurements and real-time detection. It involves the possibility to study the interaction kinetics and moreover, enables the determination of the concentration of the bound analyte.
Figure 9. a) Basic SPR biosensor components. A glass slide coated with a gold thin film is located on a prism. The incident light passes through the prism and the slide. The light reflected by the surface plasmon is detected. A flow cell allows solutions above the gold surface to be changed rapidly. Changes in reflectivity versus angle give a signal that is proportional to the concentration of analyte that interacts with the bioreceptor. b) Typical binding cycle observed with an SPR biosensor, showing the optical response versus time. A molecule is immobilized on the sensor surface with appropriate coupling chemistry. Then, a solution of analyte in the running buffer is passed over the receptor. As the analyte binds to the surface, the refractive index of the medium adjacent to the sensor surface increases, which leads to an increase in the resonance signal. The response level at equilibrium is related to the concentration of active analyte in the sample. Finally, the analyte solution is replaced by buffer, and the receptor–analyte complex is allowed to dissociate.[29]
20 Introduction
20
Some examples of protein detected using SPR sensor with MIP as bioreceptor enclose lysozyme[31] and Hepatitis B surface antibody (HBsAb) systems.[32] The latter is a biomarker for hepatitis B virus infection (HBV). Despite the limited number of patient serum samples used, a good relationship was observed between this system and a commercially available immunoassay kit.
I. 3. 3. Piezoelectric Transduction
Piezoelectric transducer systems directly measure mass changes induced by the interaction of the analyte with the bioreceptor at the surface (e.g. antigen-antibody complex formation). There are two main piezoelectric transducers, so-called quartz crystal microbalance (QCM), in which the resonance takes place throughout most of the crystal or surface acoustic wave in which the resonance occurs only at the surface of the crystal. However, QCM will be only discussed hereafter.
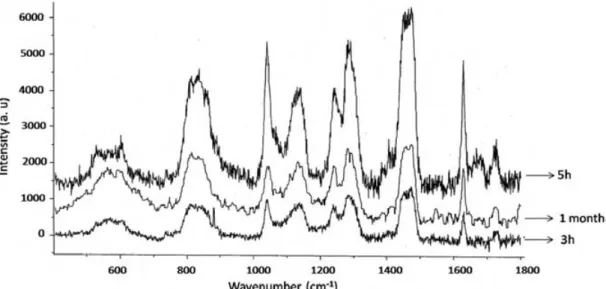
The transducer in quartz crystal microbalance (QCM) is a thin film of quartz, sandwiched between a pair of electrodes usually made of gold. The piezoelectric crystal oscillates at different frequencies by applying an external electric field. The mass of the crystal will increase when the interaction occurs while the resonance frequency of oscillation will decrease proportionally. This technique is widely used with MIPs as bioreceptor for protein detection displaying high sensitivity and selectivity. For instance, the detection of native trypsin showing a detection limit of 100 ng ml-1 has been reported. Moreover, the technique allowed distinguishing denatured trypsin from the native form (see Figure 10).[33] Examples among others of protein analytes detected using QCM coated with MIP bioreceptor include albumin in clinical samples[34] latex allergen protein (Hev b1)[35] with a detection limit of 1µg L-1. β-lactoglobulin protein conformation was also studied by this technique allowing detecting between distinct conformations of the same protein.[36]
Introduction 21
21
Figure 10. QCM differential response of a 10 MHz QCM coated with imprinted polymer using trypsin solution. (a) Denatured and (b) Native trypsin at 100 µg ml-1 in phosphate buffer at pH 5 and a flow rate of 250 µl min-1 (25 ºC).[33]
I. 3. 4. Summary
In order to enclose the differences of each transducer, Table 3 displays its main advantages and disadvantages. As we have mentioned above, the sensitivity of the final biosensor will depend on the intrinsic properties of the transducer, the surface modification technique as well as the chosen recognition receptor element. From a general point of view, optical biosensors seem to offer higher sensitivity than electrochemical ones. Moreover, the employment of optical biosensors avoids the labelling step, and thus reducing (in this aspect) the cost of the material to use.
22 Introduction
22
Transducer Advantages Disadvantages
Potentiometric (electrochemical mechanism)
Easy proceeding Small size
Lower sensitivity than amperometric Detection limits 10-8M-10-11M. Non specific interaction with other ions from the sample
Samples with large amounts of analyte are required
Reference electrode is necessary Electrode fouling
Amperometric (electrochemical mechanism)
Small and robust Simplicity Sensitivity
Detection limit 10-10M Fast
Analyte previously labeleda Reference electrode is necessary Electrode fouling
SPR
(optical mechanism)
Easy to use
Small sensor area (e.g. 5x10⁻³ mm2)
High sensitivity (10-17 mol) Label free detection of the analyte in real-time
Analyte sample can be used without previous purification
High cost
Temperature sensitivityb
Low sample volume used (Pre-enrichment step)
QCM (piezoelectric mechanism)
Easy to use
Low cost technology Label free detection of the analyte in real-time
Good sensitivity (10-14 mol)
Low selectivity
Incubation time relatively long Several steps of washing and drying are required
Difficulties in crystal surface regeneration
Larger sensor than SPR (e.g. 5 mm2)
Crystal calibration is necessary Interference produced in liquid medium
Table 3. Main advantages and disadvantages of the most commonly used transducers.[37-39] a
- In the case where the analyte is not electroactive such as most proteins.b- Depending on the application can be a disadvantage or not.
Introduction 23
23 I. 4. Miniaturization
The miniaturization of biosensors and the ability to simultaneously analyze multiple samples is the driving force in today's sensor research. However, the fabrication of devices at such a small scale is non-trivial due to requirements such as strict arrangement of the recognition element.
Since the development application of photolithography for DNA chip fabrication (see Figure 11) by Fodor et al.[40], technologies such as microfabrication processes, nanotechnology and microelectronics and microfluidic devices have evolved for the production of micro and nano scale biosensors. Different techniques can be used for patterning proteins in arrays depending on the sensor. In the case of immobilizing the bioreceptor element such as proteins directly onto the transducer, photolithography cannot be employed because the protein can be denaturized. Therefore, techniques such as microcontact printing,[41] dip-pen nanolithography,[42] or ink-jet printing are more suitable for protein deposition. In the case of using MIP as a bioreceptor element or polymers as an interface of the bioreceptor, its nanostructuration can be carried out via nanolithography or soft- lithography. The patterning technique developed in this investigation belongs to the nanopatterning of MIP; therefore, we will not give details of direct deposition techniques. The techniques related to polymers nanostructuration will be further described in Chapter II.
Figure 11. a) Light directed oligonucleotide synthesis. Initially, a solid support is derivatized with a covalent linker molecule terminated with a photosensitive group. Light is directed through a mask to deprotect and activate specific sites. It is then possible to proceed to the grafting of a first nucleotide. The process is repeated until the complete synthesis of DNA probes. Sets of masks used at each level define the sequences synthesized on each image point of the chip and (b) schematic representation of the lamp, mask and array.[43]
24 Introduction
24 I. 5. Conclusions
The requirements for biosensor fabrication will depend on the nature of the recognition element, the transducer and the interface between them. Particularly, it will depend on the final application. Hence, the development of the devices can be addressed to achieve fast response time, or a device with high selectivity and sensitivity. In other cases, the reproducibility of the results will be achieved if the surface device can be regenerated without fouling molecules. Albeit the research is making large advances in the technology of biosensors, the study of new elements of molecules recognition that mimic biological systems exhibit a greater stability is needed. Moreover, advances in immobilization procedures should be also investigated in order to minimize or avoid the distortion or any modification of the recognition element during such process. To summarize, in the development of new biosensors, several parameters must be followed:
- Easier production in large numbers.
- Miniaturization of the devices to a micro and nanometer scale. - Design of reusable biosensor.
- Multiple analytes detection. - Easy use.
- Fast response.
II. Motivation
Based in this overview, my thesis focused on the design and development of a biochip prepared via synthetic methods, capable of selectively recognizing proteins, using the molecularly imprinted polymer technique. The aim is to set up robust and cheap materials as a biorecognition element that will bypass the use of antibodies. Such systems should allow the selective recognition and the titration of proteins that will be therefore applicable to medical diagnosis. The MIP will be nanostructured so as to be coupled with the diffracting label-free detection system as a transducer allowing the quantification of the recognition event between the MIP and the protein (see Figure 12). Compared to existing methods, this new biochip will be cheaper by using conventional micro-system technologies and polymers. In addition, the diffraction device is cheaper than the other
Introduction 25
25
transducers owing to instrumental simplicity and the absence of labeling steps by measuring the intensity of a diffracted beam instead of a fluorescence signal. The latter fact makes the used cheaper biomolecules.
Figure 12. General illustration of the project
One of the first limitations on protein imprinted polymers consists in the accessibility of the protein to the imprinted cavities. For instance, due to the size of the proteins, when imprinting is made in bulk (3D-imprinting), this accessibility is highly reduced. Therefore, we will adopt a 2D-imprinting approach in which the 2D-imprinting is located at the surface. The main obstacle when attaching the protein on the surface is related to the preservation of its conformational integrity. Therefore, MIP should be synthesized in conditions close to the natural environment of proteins in order to reduce their deformation, because any conformational change can mismatch both the imprinting process and the recognition event. Based on these facts, we chose to synthesize imprinted hydrogels which seemed to be the most suitable biocompatible candidates to avoid protein denaturation. They are based on methacrylic monomers, including functionalized monomers bearing saccharidic moieties, or other kinds of neutral, anionic or cationic groups. These monomers should provide specific interactions depending on the medium used. Moreover, the saccharidic moieties will provide high density of structured hydrogen bonds which will interact with the protein. The synthesis of the material will be carried out in mild conditions (room temperature and using buffer solution at pH= 7.4) with a maximum processing time of around 15 minutes. These conditions are very attractive for process scale-up in industrial applications. In order to control the
26 Introduction
26
possible penetration of the protein, adjustment of the pore size on MIP hydrogel is therefore an essential parameter. Based on the ultimate objective of this project which involves the detection of the recognition event of MIP for the protein via optical techniques, two other specifications have to be followed. The final material must be transparent and, since MIP has to be nanostructured for detection by diffraction, the material has to be attached on the surface.
Therefore, my work has been arranged in order to fulfill these specifications. The first chapter of this manuscript will describe the synthesis details of the new methacrylate hydrogels and their characterization.
The second chapter is devoted to structuring the hydrogel in nanopatterns. It will focus on setting up the conditions necessary to successfully nanopattern the hydrogel, such as mold choice and patterning technique. The patterned hydrogel surface will be analyzed and monitored with time by AFM spectroscopy.
The third and final chapter includes the first results of protein imprinted hydrogels obtained
Introduction 27
27
Bibliography
[1] R. P. Feynman, reprinted in Journal of Microeleciromechanical Systems 1992, 1, 60-66. [2] V. Balzani, Pure and Applied Chemistry 2008, 80, 1631-1650.
[3] http://www.nano.gov/.
[4] D. J. Lockhart and E. A. Winzeler, Nature 2000, 405, 827-836.
[5] D. R. Thévenot, K. Tóth, R. A. Durst and G. S. Wilson, Pure and Applied Chemistry 1999, 71, 2333-2348.
[6] L. C. Clark and G. Sachs, Annals of the New York Academy of Sciences 1968, 148, 133-153. [7] I. E. Tothill, Computers and Electronics in Agriculture 2001, 30, 205-218.
[8] http://www.polyintell.com/.
[9] Y.-S. Lee and M. Mrksich, Trends in Biotechnology 2002, 20, s14-s18.
[10] H. Zhu and M. Snyder, Current Opinion in Chemical Biology 2003, 7, 55-63.
[11] H. J. Lee, Y. Yan, G. Marriott and R. M. Corn, The Journal of Physiology 2005, 563, 61-71. [12] http://www.affymetrix.com/.
[13] M. Nishikawa, T. Yamamoto, N. Kojima, K. Kikuo, T. Fujii and Y. Sakai, Biotechnology and
Bioengineering 2008, 99, 1472-1481.
[14] J. R. Crowther, Humana, New Jersey 1995, 42.
[15] W.-L. Xing, J. Cheng, M. F. Templin, O. Poetz, J. M. Schwenk, D. Stoll and T. O. Joos in
Miniaturized Multiplexed Protein Binding Assays, Vol. Springer US, 2006, pp. 61-87.
[16] M. F. Templin, D. Stoll, M. Schrenk, P. C. Traub, C. F. Vöhringer and T. O. Joos, Trends in
Biotechnology 2002, 20, 160-166.
[17] N. S. Lipman, L. R. Jackson, L. J. Trudel and F. Weis-Garcia, ILAR 2005, 46, 258-268.
[18] K. L. Brogan, K. N. Wolfe, P. A. Jones and M. H. Schoenfisch, Analytica Chimica Acta 2003,
496, 73-80.
[19] V. Dugas, A. Elaissari and Y. Chevalier in Surface Sensitization Techniques and Recognition
Receptors Immobilization on Biosensors and Microarrays, Vol. (Ed. M. Zourob), Springer, 2010,
pp. 47-134.
[20] M. Leenaars and C. F. M. Hendriksen, ILAR 2005, 46, 269-279.
[21] U. B. Nielsen and B. H. Geierstanger, Journal of Immunological Methods 2004, 290, 107-120. [22] H. Zhu, M. Bilgin, R. Bangham, D. Hall, A. Casamayor, P. Bertone, N. Lan, R. Jansen, S. Bidlingmaier, T. Houfek, T. Mitchell, P. Miller, R. A. Dean, M. Gerstein and M. Snyder, Science 2001, 293, 2101-2105.
[23] P. C. Weber, D. H. Ohlendorf, J. J. Wendoloski and F. R. Salemme, Science 1989, 243, 85-88. [24] C. You, M. Bhagawati, A. Brecht and J. Piehler, Analytical and Bioanalytical Chemistry 2009,
393, 1563-1570.
[25] L. D. Mello and L. T. Kubota, Food Chemistry 2002, 77, 237-256. [26] R. Koncki, Analytica Chimica Acta 2007, 599, 7-15.
28 Introduction
28
[27] Z. Muhammad-Tahir and E. C. Alocilja, Biosensors and Bioelectronics 2003, 18, 813-819. [28] M. K. Sharma, V. K. Rao, G. S. Agarwal, G. P. Rai, N. Gopalan, S. Prakash, S. K. Sharma and R. Vijayaraghavan, J. Clin. Microbiol. 2008, 46, 3759-3765.
[29] M. A. Cooper, Nature Reviews Drug Discovery 2002, 1, 515-528. [30] http://www.biacore.com/lifesciences/index.html.
[31] T. Matsunaga, T. Hishiya and T. Takeuchi, Analytica Chimica Acta 2007, 591, 63-67.
[32] L. Uzun, R. Say, S. Ünal and A. Denizli, Biosensors and Bioelectronics 2009, 24, 2878-2884. [33] O. Hayden, C. Haderspock, S. Krassnig, X. Chen and F. L. Dickert, Analyst 2006, 131, 1044-1050.
[34] T.-Y. Lin, C.-H. Hu and T.-C. Chou, Biosensors and Bioelectronics 2004, 20, 75-81.
[35] C. Sontimuang, R. Suedee, B. Canyuk, N. Phadoongsombut and F. L. Dickert, Analytica
Chimica Acta 2011, 687, 184-192.
[36] N. W. Turner, X. Liu, S. A. Piletsky, V. Hlady and D. W. Britt, Biomacromolecules 2007, 8, 2781-2787.
[37] A. Janshoff, H.-J. Galla and C. Steinem, Angewandte Chemie International Edition 2000, 39, 4004-4032.
[38] D. Grieshaber, R. MacKenzie, J. Vörös and E. Reimhult, Sensors 2008, 8, 1400-1458.
[39] P. Leonard, S. Hearty, J. Brennan, L. Dunne, J. Quinn, T. Chakraborty and R. O'Kennedy,
Enzyme and Microbial Technology 2003, 32, 3-13.
[40] S. P. A. Fodor, J. L. Read, M. C. Pirrung, L. Stryer, A. T. Lu and D. Solas, Science 1991, 251, 767-773.
[41] R. S. Kane, S. Takayama, E. Ostuni, D. E. Ingber and G. M. Whitesides, Biomaterials 1999,
20, 2363-2376.
[42] K.-B. Lee, J.-H. Lim and C. A. Mirkin, Journal of the American Chemical Society 2003, 125, 5588-5589.
[43] R. J. Lipshutz, S. P. A. Fodor, T. R. Gingeras and D. J. Lockhart, nature genetics 1999, 21, 20-24.
RÉSUMÉ
INTRODUCTION
30 Résumé Introduction
![Table 3. Main advantages and disadvantages of the most commonly used transducers. [37-39] a](https://thumb-eu.123doks.com/thumbv2/123doknet/2176039.10300/44.892.89.816.109.974/table-main-advantages-disadvantages-commonly-used-transducers.webp)