HAL Id: hal-01866399
https://hal.archives-ouvertes.fr/hal-01866399
Submitted on 9 Apr 2020HAL is a multi-disciplinary open access
archive for the deposit and dissemination of sci-entific research documents, whether they are pub-lished or not. The documents may come from teaching and research institutions in France or abroad, or from public or private research centers.
L’archive ouverte pluridisciplinaire HAL, est destinée au dépôt et à la diffusion de documents scientifiques de niveau recherche, publiés ou non, émanant des établissements d’enseignement et de recherche français ou étrangers, des laboratoires publics ou privés.
Hydrodynamic effects induced by nanosecond sparks in
air and air/fuel mixtures
Sergey Stepanyan, Jun Hayashi, Christophe Laux, E. Pannier, A. Salmon,
Sara Lovascio, Gabi Stancu
To cite this version:
Sergey Stepanyan, Jun Hayashi, Christophe Laux, E. Pannier, A. Salmon, et al.. Hydrodynamic effects induced by nanosecond sparks in air and air/fuel mixtures. 55th AIAA Aerospace Sciences Meeting, Jan 2017, Grapevine, United States. �10.2514/6.2017-1581�. �hal-01866399�
Hydrodynamic effects induced by nanosecond sparks in air
and air/fuel mixtures
S. Stepanyan1,
EM2C Laboratory, CNRS UPR288, CentraleSupélec, Université Paris Saclay, Grande Voie des Vignes, Chatenay-Malabry, 92290, France
J. Hayashi2
Department of Mechanical Engineering, Osaka University, 1-1 Yamadaoka, Suita, 565-0871, Japan
A. Salmon3, E. Pannier4, S. Lovascio5, G. Stancu6 and C. Laux7
EM2C Laboratory, CNRS UPR288, CentraleSupélec, Université Paris Saclay, Grande Voie des Vignes, Chatenay-Malabry, 92290, France
It was found that short and intense energy release in nanosecond sparks can induce hydrodynamic motion of the gas over a long distance of the order of centimeter. The gas motion induces the transport of active species produced by plasma into the surrounding space. The present work characterizes these mentioned processes for both single and repetitive sparks under various discharge conditions.
I. Introduction
Nanosecond discharges have demonstrated strong potential for different applications such as Plasma-Assisted Ignition (PAI) [1-5], lean flame stabilization [6-8], aerodynamic flow control [9-12] and nanomaterial synthesis [13-15].
The key phenomenon making nanosecond plasma capable for the applications mentioned above is ultrafast gas heating [16]. It occurs in air-containing mixtures mostly due to dissociative quenching reactions between molecular oxygen and electronically excited nitrogen molecules produced by electron impact during the discharge [17,18]. The results of kinetic modeling demonstrate this effect [19-21]. The ultrafast gas heating in atmospheric pressure air plasmas occurs within a few tens of nanoseconds in the discharge afterglow. Nearly full dissociation of molecular oxygen [18,22-24] is another feature of nanosecond plasmas which provides large amounts of reactive chemical species. All this makes Nanosecond Repetitively Pulsed(NRP) discharges attractive for industrial applications. A known consequence of the ultrafast gas heating induced by nanosecond sparks is the formation of shock waves and hydrodynamic effects [25]. The authors of [25] have shown that the gas heated by thin channel of a single spark propagates over a few millimeters within tens of microseconds. More recent work [26] investigated high current (~1.5 kA) sparks of 50-ns duration across long interelectrode gaps (50-60 mm) in air, and observed the onset of strong turbulence attributed to Rayleigh-Taylor instabilities. This effect was also observed in nanosecond sparks with lower current (~100 A). It has been experimentally demonstrated [27-32] for combustible mixtures of propane that the burst of nanosecond sparks can cause wrinkling of the flame and lead to its acceleration. The effect of nanosecond sparks on formation of ignition kernel was also considered by Bane et al [33].
1
Post Doctoral Fellow, sergey.stepanyan@centralesuperlec.fr.
2
Associate Professor, j.hayashi@mech.eng.osaka-u.ac.jp.
3
Ph.D. student, arthur.salmon@centralesupelec.fr.
4
Ph.D. student, erwan.pannier@ecp.fr.
5
Post Doctoral Fellow, s.lovascio@gmail.com.
6
Assistant Professor, gabi-daniel.stancu@centralesupelec.fr.
Topic number:
Downloaded by UNIVERSITY OF COLORADO on January 8, 2017 | http://arc.aiaa.org | DOI: 10.2514/6.2017-1581
55th AIAA Aerospace Sciences Meeting 9 - 13 January 2017, Grapevine, Texas
AIAA 2017-1581 AIAA SciTech Forum
American Institute of Aeronautics and Astronautics 2
The hydrodynamics in the long afterglow of a single nanosecond spark was recently modeled by Castela et al [35]. Comparison of experimental results and numerical modeling has shown, that the hot gas core produced by the spark develops into an expanding torus of reactive hot gas, and that fresh gas recirculates inside the interelectrode region. This was confirmed by Schlieren diagnostics in [27] and recently by PIV (particle image velocimetry) measurements in [36].
The motion of the hot gas after a nanosecond spark occurs at sub millisecond time scale which motivated us to investigate this process. For better understanding of considered phenomena single nanosecond spark should be studied before repetitive discharge. Another objective of this work is the parametric study of the effects of various parameters, namely the number of nanosecond pulses, applied voltage amplitude, shape of the electrodes, and gas composition, on the hydrodynamic effects induced by nanosecond sparks.
II. Experimental setup
Nanosecond Repetitively Pulsed discharges were produced between two metallic pin electrodes separated by a distance of 1 mm. Most experiments reported here were performed with paraboloid pins with tapered 150-µm tip radius, but additional experiments were conducted with conical or cylindrical pins. The NRP discharges were generated with a FID FPG 30-100MC4K generator producing pulses of 10-ns duration, amplitudes up to 42 kV and Pulse Repetition Frequency (PRF) up to 100 kHz. The energy deposited into the plasma was measured with a high voltage probe (Lecroy PPE 20 kV), current probe (Pearson model 6585) and recorded on a LeCroy Wavepro 7100 oscilloscope (1 GHz). A description of technique used for energy measurements can be found elsewhere [16,18]. To characterize the hydrodynamic effects induced by the spark up to 1 ms after the discharge, phase-locked Schlieren measurements were performed with the experimental setup, similar to the one used in [28]. High frequency light source CAVILUX HF was used as a light source for Schlieren diagnostics. The gate of the ICCD PIMAX camera used for the Schlieren measurements was set to 0.1 μs. Fast imaging of spontaneous emission of OH*(308 nm) was recorded with a Photron SA-X2 camera, using a camera gate of 5 μs.
To ensure a complete characterization of the gas density gradients induced by the discharge, the knife-edge of the Schlieren setup was placed either horizontally or vertically. In the horizontal position (i.e. parallel to the interelectrode axis), the knife-edge cuts the light deflected toward the bottom side of the image; in the vertical position (i.e. perpendicular to the interelectrode axis), it cuts the light deflected toward the right side of the image. For most Schlieren images presented here, the knife-edge was set to cut about 90% of the light (perpendicular to the interelectrode axis) in order to increase contrast.
Characterization of spatial distribution of active species produced in the discharge such as OH and NO was performed by monitoring of PLIF intensity from the area corresponding to the discharge afterglow at temporal scale of 200 µs. A frequency-doubled dye laser (Continuum ND6000) with Rhodamine 590 dye was pumped by a Nd:YAG laser (Continuum) at 532 nm was used to excite the Q1(6) transition of OH[(X, v''=1)→ (A, v''=1)] at 282.935 nm. For the LIF of NO* the transition NO(P21+Q1 (2Σ-2Π1/2)) was pumped at 226.287 nm. In this case dye
laser was pumped by combination of 532 nm and fundamental 1064 nm emission of YAG laser. LIF emission was collected through band pass filter centered near 313 nm for OH* LIF emission and near 241 nm for NO* LIF emission. The laser sheet for PLIF was formed by a combination of cylindrical (f=15 cm) and spherical (f=10 cm) lenses. The high of the sheet was 10 mm and the thickness was 0.2 mm. The laser frequency was10 Hz, with a pulse width of 6 ns FWHM. The synchronization of the discharge, laser and cameras was performed by use of gate-and-delay generator (BNC Model 575). Arrangement of the equipment described above is presented in Figure 1. Discharge electrode system was placed vertically (perpendicular to the plane of Figure 1). The passage of the light produced by Schlieren source is shown by a continuous grey line. The light was collimated by a plane-convex lens with 1 m focal distance. After the passage through the area, where the discharge was initiated, partially deviated light reflects on spherical mirror (f=2 m) and then cut by a knife-edge in a focal point. The rest of the light is delivered to the CCD panel of fast camera through the reflection on another spherical mirror (f=2 m). The combination of two spherical mirrors provided magnification factor of 1.6. Fast camera was used either for Schlieren or emission imaging (with removed knife-edge).
III. Experimental results
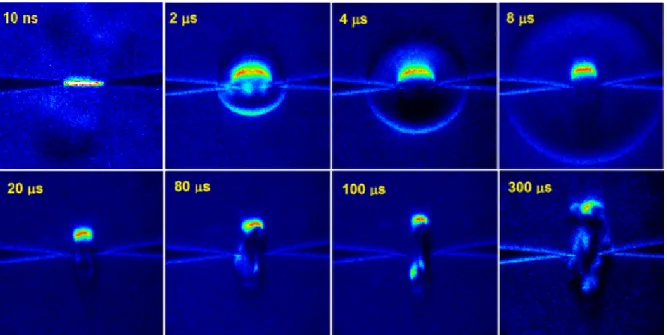
Figure 2 presents a set of Schlieren images obtained with a horizontal knife-edge (placed parallel to the pin electrodes) from 10 µs to 300 µs after a single spark. The discharge was initiated at ambient conditions by a pulse of 10 ns duration and +36 kV amplitude. The distance between the pin tips was 1 mm. It is seen from Figure 2 that the hydrodynamic disturbance occurs within a few microseconds after the discharge. Two main phenomena were observed: shock wave propagates during first 15 µs and the hot gas core expands at the millisecond scale. The propagation of the shock wave induced by nanosecond plasma has been presented before [27,37,38]. However, the expansion of the hot gas has not been analyzed enough for longer time scale. It characterizes the spatial scale of redistribution of the energy deposited in plasma. The Schlieren results show that the shape of the heated gas is symmetrical around the pin axis. It is seen from the Figure 2 that the hot gas expands about 6 mm in 300 µs. This demonstrates that the energy deposited in the discharge redistributes over a large volume during a short period.One can see the phenomenon of gas recirculation between the pin electrodes: after a period of about 30 µs the hot gas between the electrodes is transported outwards while the interelectrode gap is refilled by fresh gas. The heat transport in the discharge afterglow is accompanied by the transport of active species also produced by the discharge. Figures 3a,b present a comparison of the Schlieren image obtained at 20 µs and the results of fast imaging of the distribution of OH* emission intensity. The discharge conditions in Figure 3 are the same as in Figure 2. It is seen that the distribution of the gas density perturbation and of OH* emission intensity have the same shape.
Figure 3c present the evolution of the hot gas core diameter d. The definition of d can be found in Figure 3a. One can see that the hot gas core first expands rapidly (dd/dt~60 m/s) and then slows down after ~100 µs. For the following description of experimental data we define d at t>100 µs as dmax. So, one can say that the energy deposited in the plasma is redistributed inside the volume with characteristic scale dmax in ~100 µs.
The mechanism of hot gas expansion accompanied by recirculation of the hot gas and by transport of active species is described in [17]. It is obvious that the speed of the gas expansion and dmax may be dependent on different parameters such as gas composition, shape of the electrodes, amplitude of the applied pulses, or pulse frequency in the case of repetitive nanosecond sparks.
Figure 4 presents Schlieren images obtained with the horizontal knife-edge after a single nanosecond spark in air (U=+36 kV, P=1 bar, 10 ns pulse) with different electrode systems: a) conic pins of stainless steel with 10 µm tip; b) parabolic pins (30 µm tips) of tungsten; c) cylindrical electrodes of 2 mm diameter made of steel with a cut edge made of tungsten. All images were obtained 300 µs after the discharge. It is seen that the scale and the shape of the expanded hot gas are practically the same for all three cases, i.e. the observed phenomenon does not depend on the electrode shape or material.
The effect of hot gas expansion and recirculation is clearly important for the repetitive spark. The hydrodynamics of the discharge afterglow develop at sub millisecond time scale and are governed by the amount of energy deposited in plasma. This energy strongly depends on the initial gas number density. In the case of a discharge initiated by the burst of pulses, it is reasonable to expect that the gas density before each new pulse is lower than before the previous one because of the gas heating by previous pulses. It is often assumed that the energy released in the plasma in each new pulse slowly diffuses in outwards before the next pulse. In this case the highest gas temperature would always be between the pins. However, we have shown that the energy released in plasma is not confined between the tips, but spatially redistributed by convective gas recirculation. If the period between nanosecond repetitive pulses (NRP) is longer than the recirculation time of the fresh gas, then each new discharge will be triggered at the same conditions that the first one, i.e. in the fresh gas. If the period between the NRPs is shorter than the recirculation time, then all discharges after the first one will be initiated at higher temperature, i.e. at lower gas number density. This means that the energy deposited in each new pulse will reach an optimum at some frequency, since it significantly depends on the gas number density. Reference [39] presents the results on combustion of lean mixtures assisted by repetitive nanosecond sparks at different frequencies. The results demonstrate a significant dependence of the ignition delay on the discharge frequency.
The shape of the expanded hot gas in case of NRP corresponds to a superposition of single discharges. It strongly depends on the number of applied pulses in the burst. Figure 5a,b presents the comparison of a single pulse discharge in air at P=1 bar, U=+36 kV with the sequence of discharges initiated by a burst of 30 pulses at f=70 kHz,
U=+36 kV. Both images were obtained 500 µs after the first pulse. One can see the scale of the hot gas is much
larger for the burst. Figure 5c shows that the spatial scale of the hot gas depends linearly on the number of the pulses in a burst. So dmax can be significantly increased at sub millisecond scale by increasing the number of pulses.
American Institute of Aeronautics and Astronautics 4
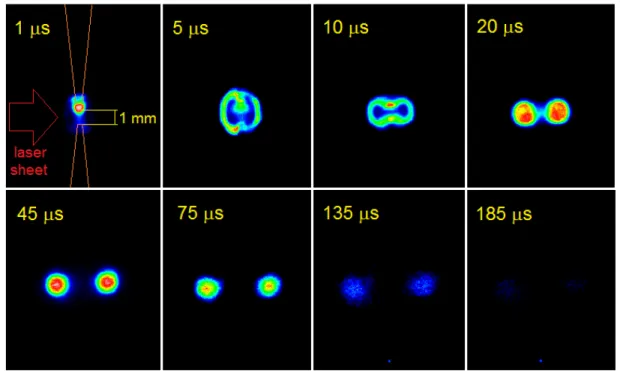
intensity between the pins in Figures 2,3 may be not due to the recirculation of fresh gas (i.e. ambient temperature between the pins) but due to cylindrical symmetry of the hot gas thorus. I.e. the collimated light passing the plane of cylindrical symmetry is not deviated because there is no density gradient in the perpendicular direction. In order to clarify this LIF of OH and NO was observed. Figure 6 presents the PLIF images where the laser sheet passes through the plane containing the pin electrodes. The presented images were obtained at the same temporal scale than Schlieren images in Figures 2,3.It is clearly seen that there is no LIF from the area between the electrodes which confirms the recirculation of the gas in the area between the pins. It also demonstrates the transport of chemically active species with the hot gas in outer region. Figures 7ab present PLIF images of OH* emission at 75 µs for cases of 1 and 2 mm gap between the pins. It is seen that increasing the distance between the pins one can increase the area affected by the discharge. Figure 7c presents the PLIF image of NO (75 µs delay).
Conclusion
We have shown how the energy deposited in a nanosecond spark spatially redistributes during its afterglow at sub millisecond scale. The gas heated by a thin spark channel expands with a speed ~60 m/s for 5 mm scale during the period about 100 µs and then slows down. The expansion of hot gas is driven by convective flows and accompanied by transport of active species produced in the plasma. The convective flows induce gas recirculation around the discharge electrode system. It was demonstrated that gas expansion dynamics are almost independent of the shape of the electrodes and material.
The experiments with repetitive nanosecond sparks demonstrated that the dimension of the expanded hot gas at sub millisecond scale increases linearly with the number of repetitive pulses. This kind of discharge makes it possible to affect a large gas volume (>1cm3) which is promising for ignition of lean mixtures and flow control.
Acknowledgments
We are thankful for the support by FAMAC project (Grant no. ANR-12-VPTT-0002) and PLASMAFLAME project (Grant no.ANR-11-BS09-0025). We would also thank Dr. Denis Packan (ONERA) for lending us the light source for Schlieren measurements.
References
[1] Pancheshnyi S et al 2006 IEEE Transactions on Plasma Science 34 2478-2487 [2] Singleton D et al 2011 J. Phys. D: Appl. Phys. 44 022001
[3] Starikovskiy A et al 2013 Prog. Energy Combust. Sci. 39 61-110 [4] Starikovskaia S 2014 J. Phys. D: Appl.Phys. 47 353001
[5] Ju Y et al 2015 Progress in Energy and Combustion Science 48 21-83 [6] Barbosa S et al 2015 Phil. Trans. R. Soc. A 373 20140335
[7] Pilla G et al 2006 IEEE Transactions on Plasma Science 34 2471- 2477 [8] Hyungrok D et al 2008 IEEE Transactions on Plasma Science 36(6) 2898-2904 [9] Miles R et al 2009 Eur. Phys. J. Appl. Phys. 47 22802
[10] Benard N et al 2008 AIAA Journal 46 (9) 2293-2305
[11] Adamovich I et al 2009 Plasma Sources Sci. Technol. 18 034018 [12] Opaits D 2010 Ph.D. Dissertation, Princeton University
[13] Pai D et al 2013 Scientific Reports 3 1221 [14] Chen Z et al. 2011 Nano Lett. 11 4168-4175 [15] Ostrikov K 2011 J. Phys. D-Appl. Phys. 44 174003
[16] Pai D et al 2010 Plasma Sources Science and Technology 19 065015 [17] Stancu G et al 2010 J. Phys. D: Appl. Phys. 43 124002
[18] Rusterholtz D et al 2013 J. Phys.D: Appl. Phys 46 464010 [19] Popov N 2001 Plasma Physics Reports 27(10) 886-896 [20] Flitti A et al 2009 Eur. Phys. J. Appl. Phys. 45 21001
[21] Aleksandrov 2010 J. Phys. D: Appl. Phys 43 255201 [22] Stancu G et al 2010 J. Phys. D: Appl. Phys.43 124002 [23] Lo A et al 2012 Appl Phys B Lasers O 107(1) 229–242
[24] Klochko et al 2015 Plasma Sources Science and Technology 24(2) 025010 [25] Kono M et al 1989 Symp. (Int.) Combust. 22 1643
[26] Leonov S et al 2007 Physics of Plasmas 14 123504 [27] Xu D et al 2011 Appl. Phys. Lett. 99 121502 [28] Xu D et al 2014 J. Phys. D: Appl. Phys. 47 235202
[29] Lo A et al 2014 Journal of Physics D: Applied Physics 47 115201 [30] Lo A et al 2014 Journal of Physics D: Applied Physics 47 115202 [31] Xu D 2013 PhD thesis December, Ecole Centrale, Paris
[32] Xu D et al 2016 Plasma Chemistry and Plasma Processing 36 (1) 309-327 [33] Bane S et al 2015 Combustion and Flame 162(2) 462-469
[34] Xu D et al 2016 Plasma Chem Plasma Process 36 309-327
[35] Castela M et al 2016 Proceedings of the Combustion Institute 000 1-9
[36] Seydou A et al 2016 18th International Symposium on the Application of Laser and Imaging Techniques to Fluid Mechanics, Lisbon, Portugal, july 4-7
[37] Nagaraja S et al 2014 Combustion and Flame 161 1026-1037
[38] Starikovskii A et al 2009 Plasma Sources Science and Technology 18(3) [39] Lovascio S et al 2017, 36th International Symposium on Combustion, accepted
Figure 1. Scheme of experimental setup. Focal length of the lens is 1 m. Spherical mirrors have 2 m focal distance.
American Institute of Aeronautics and Astronautics 6
, Figure 2. Schlieren images obtained for a single nanosecond spark in air at P=1 bar, U=+36 kV. The distance between the pins is
1 mm. The horizontal knife edge cuts 90 % of light.
(a) Schlieren image (b) OH* emission (c) Evolution of the hot diameter
Figure 3. Comparison of a) Schlieren image and b) distribution of spontaneous OH* emission (308 nm) at 30 µs after a single nanosecond spark in air at P=1 atm, with a 10 ns pulse of amplitude U=36 kV, ε=6 mJ; c) Evolution of the hot core diameter d; Nanosecond spark (blue curve): U=36 kV, 10 ns pulse, deposited energy: ε=6 mJ. Conventional automotive spark (red curve): ε=55 mJ. Distance between pins: 1 mm.
(a) (b) (c)
Figure 4. Schlieren images obtained for a single nanosecond spark in air at P=1 atm, U=36 kV for different electrode systems: a) conic stainless steel pin with 30-µm radius of curvature tips; b) paraboloid tungsten pins with tapered 150-µm tip radius; c) cylindrical tungsten electrodes of diameter 2 mm. The distance between the electrodes is 1 mm. The horizontal knife edge cuts 90 % of the light.
(a) Single pulse (b) Burst of 30 pulses (c) Evolution of hot diameter
Figure 5. Schlieren results obtained at 500 µs after the discharge in air at P=1 atm, U=28 kV and 1 mm distance between the electrodes; a) single pulse; b) burst of 30 pulses at f=70 kHz; c) Dependence of the hot gas core size dmax at 500 µs on the number of pulses at 70 kHz. The red dashed line represents the expansion size for the conventional automotive spark.
Figure 6. Phase-locked OH LIF images obtained in afterglow of a single nanosecond spark in ambient humid air at P=1 bar. The discharge was initiated in pin-to-pin geometry at U=+36 kV, 10 ns pulse duration. The gap between the pins is 1 mm.
Camera gate is 100 ns.
(a) (b) (c)
Figure 7. Phase-locked LIF images obtained in afterglow of a single nanosecond spark (at 75 µs) in ambient humid air at P=1 bar. The discharge was initiated in pin-to-pin geometry at U=+36 kV, 10 ns pulse duration. Camera gate is 100 ns.a) 1 mm
0 5 10 15 20 25 30 4 5 6 7 8 9 10 11 50 mJ 37.5 mJ 25 mJ 12.5 mJ dma x , mm
Number of pulses in the burst
Conventional car spark (54 mJ) 2.5 mJ
62.5 mJ 75 mJ