Serge Sultan, Université de Montréal
How to cite this article:
Leclerc AA, Lippé S, Bertout L, Chapados P, Boulet-Craig A, Drouin S, Krajinovic M,
Laverdière C, Michon B, Robaey P, Rondeau É, Sinnett D, Sultan S. Inconsistencies
between measures of cognitive dysfunction in childhood acute lymphoblastic
leukemia survivors: Description and understanding. Psychooncology. 2020
Jul;29(7):1201-1208. doi: 10.1002/pon.5410. Epub 2020 Jun 1.
DOI:
https://doi.org/10.1002/pon.5410
1
Inconsistencies between measures of cognitive dysfunction in childhood acute lymphoblastic leukemia survivors: description and understanding
Short running title: Cognitive dysfunction in childhood leukemia survivors
Andrée-Anne Leclerc1,2, Sarah Lippé1,2, Laurence Bertout1, Pascale Chapados1,2, Aubrée Boulet-Craig1,2, Simon Drouin1, Maja Krajinovic1,4, Caroline Laverdière1,4, Bruno Michon5,
Philippe Robaey1,3, Émélie Rondeau1, Daniel Sinnett1,4, Serge Sultan1,2,4 1Sainte-Justine University Health Center, (SJUHC), Montréal, Québec, Canada
2Department of Psychology, Université de Montréal, Montréal ,Québec, Canada 3University of Ottawa,Ottawa, Ontario, Canada
4Department of Pediatrics, Université de Montréal, Montréal, Québec, Canada 5Quebec University Health Center (QUHC), Montréal, Québec, Canada
Correspondence
Serge Sultan, Department of Hematology-Oncology, Sainte-Justine SJUHC, 3175 Chemin de la Côte-Sainte-Catherine, Montréal H3T1C5, Québec, Canada.
Email: serge.sultan@umontreal.ca
Abstract
Objectives – The frequency of cognitive difficulties in childhood cancer survivors varies according to the measurement strategy. The goal of this research is to (1) describe agreements and differences between measures of working memory and attention (2) identify contributors of these differences, such as emotional distress, affects, and fatigue.
Methods – We used data available for 138 adults successfully treated for childhood acute lymphoblastic leukemia (ALL) (PETALE cohort). Working memory and attention were assessed using subtests from the WAIS-IV and self-reported questionnaires (BRIEF-SR and CAARS-S:L). Potential contributors included emotional distress, anxiety, depression (BSI-18), affects (PANAS), and fatigue (PedsQL-MFS). We explored measurement agreements and differences using diagnostic indices and multivariate regression models.
Results – The frequencies of working memory and attention deficits were higher when using cognitive tests (15-21%) than with self-reports (10-11%). Self-reported questionnaires showed high specificity (median 0.87) and low sensitivity (median 0.10) suggesting they did not reliably identify positive cases on cognitive tests. We identified negative affectivity as a possible contributor to inconsistencies between self-report and test results.
Conclusions – When measuring working memory and attention in childhood ALL survivors, cognitive test results and self-reports should not be considered equivalent. At best, self-report may be used for screening (high specificity), but not to assess prevalence in large samples. Self-reported difficulties are also probably influenced by negative mood in this population.
Keywords : attention, cancer, childhood leukemia, cognitive test, oncology, self-report, survivors, working memory
2
Background
Therapy advances have led to an increase of the 5-year survival rate of childhood Acute Lymphoblastic Leukemia (ALL) reaching 91%1. However, about half of the ALL survivors develop
at least one clinically significant long-term cognitive sequelae2. In addition to the type and
intensity of treatment, risk factors known to increase the risk of cognitive difficulties include female sex, early age at diagnosis (≤ 5 years), and some genetic characteristics3,4.
Various studies have shown that ALL survivors who received chemotherapy, combined or not with cranial radiotherapy (CRT), have a lower overall intellectual potential (6-8 IQ points lower) than a healthy population5,6. The most commonly observed cognitive deficits in survivors are a limited
attention span, working memory and information processing speed2,5,7. These deficits become
more obvious 2-7 years after the end of treatment5,8 and should be routinely evaluated as they
affect academic performance and quality of life3,9.
It is common practice in oncology research to consider self-reported questionnaires as reliable tools to assess the frequencies of cognitive late-effects10. However, recent studies have reported
limited correlations between tested and self-reported cognitive difficulties11,12. First, cognitive
tests may have limited ecological validity12. Considering that cognitive tests are usually taken in
environments free of distractions and stressors, we could expect that more cognitive difficulties be self-reported than tested. Second, studies have pointed to the tendency to normalize one’s own experience that could downplay the self-report of one’s own difficulties13. Finally, some
studies in adult cancer suggest that intensity of symptoms in self-reported cognitive assessment is associated with negative mood11,12, anxious and depressive symptoms11,14, and fatigue14, but
no such study is yet available in the context of pediatric cancer. It is also widely recognized that depressive and anxious symptoms, depending on their subtype and severity, may negatively impact cognitive performance15,16.
The few studies that have used both types of cognitive measures in pediatric cancer survivors8,17
have found more frequent deficits when tested than when self-reported, on attention (30% vs. 10%) and working memory (59% vs. 28%)8,17, suggesting method concordance issues. Although
these two cognitive domains are key in understanding the cascade of cognitive deficits in this population, no study has yet attempted to explain these differences empirically. In this study, we will refer to two types of concordance or inconsistency: agreement refers to relative agreement
3
measured by correlation, and differences refer to absolute agreement measured by raw difference.
The first aim of the current study was to provide a detailed description of agreements and differences between measurement strategies in the domains of attention and working memory, amongst individuals who were successfully treated for childhood ALL. The second aim was to explore the contributing role of emotional status, characterized by emotional distress, depression and anxiety, positive and negative affects, and fatigue.
Methods
Participants
The sample was composed of individuals who had been successfully treated for ALL (PETALE cohort) at the Sainte-Justine University Health Centre (SJUHC) or Quebec University Health Centre (QUHC). A detailed description of the methodology for cohort recruitment and characterization can be found in another article18. The inclusion criteria were: 1) diagnosis of ALL prior 19 years,
2) treatment per Dana Farber Cancer Institute (DFCI) protocol, 3) more than 5 years post diagnosis and 4) no relapse or transplantation. A total of 374 survivors aged between 13 and 40 were contacted to participate in this study (Flow chart, Figure 1). The sample of the current study consists of 138 survivors aged 19 and older for whom both the cognitive tests and self-reported questionnaires were available (participation 84%, completion 75%) (Table 1). We used data from adult participants only, to warrant that status was not reported by a parent. The study protocol was approved by the Research Ethics Board at both sites (SJUHC: #2013-479; QUHC: #MP-20-2015-2176).When comparing the group completing testing (N=138) with those for whom data was incomplete (N=47), we found the study group to be older at study time (p=0.003), older at diagnosis (p=0.032), treated with less recent DFCI protocols (p=0.033), with higher frequency of high risk status (p=0.013), but no difference on sex, or use of radiotherapy.
Procedure
The data were collected as part of a study on the biomarkers of the long-term effects of the ALL at the SJUHC and QUHC18. Patients were contacted by phone by a research nurse who told them
about the study. They subsequently gave their informed written consent by reading and signing a consent form they received by mail. On site, participants took part in a short neuropsychological
4
assessment (cognitive tests: 30 minutes) followed by self-reported cognitive and affective questionnaires (45 minutes). Tests and self-reports were selected based on previous use in similar populations, suggesting domains overlap8,17. Participants’ detailed clinical history was collected
from their medical records.
Measures
Test-based cognitive measures
The cognitive test battery included subtests from the Weschler Adult Intelligence Scale – 4th
edition – French Canadian version (WAIS-IV)19. To assess working memory, we used the Working
Memory Index (WMI) from the WAIS-IV. As this may be confounded with attention, we also used the Letter-Number Sequencing (LNS) subtest. To assess attention independently of working memory, we used the score of the Digit Span Forward condition (DSF) from the Digit Span subtest20. These were selected on strong theoretical bases, but it must be noted that indices (e.g.
WMI) are aggregate measures generally more reliable than subtests (e.g. LNS) or conditions (e.g. DSF) on cognitive performance tests19.
Self-reported cognitive measures
Standardized self-administered cognitive questionnaires were used. To assess working memory difficulties, we used the Working Memory Scale (WMS) from the adult version of the Behavior Rating Inventory of Executive Function (BRIEF-SR)21. The BRIEF-SR is a standardized questionnaire
evaluating adults’ executive functions and self-regulation in their daily lives over the last six months. The scale measures one’s ability to retain information when performing a task, coding information, or generating goals or plans in a sequential manner (i.e., “Forgets what he/she was
doing,” “When sent to get something, forgets what he/she is supposed to get”). The scale is
composed of 8 items that can be rated from 0 (never) to 2 (often). Its internal consistency was satisfactory (α=.80). To assess self-reported attention difficulties, we used the Inattention Symptoms Scale (ISS) from the self-administered long version of the Conners Adult ADHD Rating Scale (CAARS-S:L)22. The CAARS-S:L is a standardized questionnaire evaluating the presence and
intensity of the symptoms associated with attention deficit with or without hyperactivity. The scale is composed of 9 items rated from 0 (never) to 3 (very often) (α=.88), such as “Inattentive,
easily distracted”. For both self-reported questionnaires, the percentile scale scores were reverse
5 Affective measures
To assess the presence and intensity of general distress, depression, and anxiety symptoms over the last 7 days, the Brief Symptom Inventory (BSI-18) was used. The BSI-18 is composed of 18 items scored on a scale ranging from 0 (not at all) to 4 (very much). We used three scales from the BSI-18. The general distress index consists of 18 items and includes depressive, anxious, and somatic symptoms (α=0.89). The depression index consists of 6 items and refers to feelings of loneliness, anxiety, depreciation, and despair (α=0.81). The anxiety index consists of 6 items and refers to feelings of nervousness, tension, agitation, and fear (α=0.80). We used T scores, and cut-points from the original manual to determine cases on general distress (2 indices ≥63 or total ≥63), anxiety (≥63), and depression (≥63)23. To assess participants’ overall presentation of affects over
the last two weeks, we used the Positive and Negative Affect Schedule (PANAS)24. The PANAS
includes two scores (ranging from 0 to 50), each consisting of 10 items scored on a scale ranging from 1 (not at all) to 5 (extremely). The first score indicates the level of negative affect (i.e., to feel “anxious,” “angry”, α=0.81) whereas the second indicates the level of positive affect (i.e., to feel “interested,” “excited”, α=0.80). Participants’ level of fatigue was determined with the Pediatric Quality of Life Multidimensional Fatigue Scale, Standard version, Young adult report (PedsQL-MFS)25. To avoid spurious overlaps with cognitive complaints, only the general fatigue index
(ranging from 0 to 100) was used. The scale includes physical fatigue and activity level (i.e., “I feel
too tired to do things that I like to do”; α=0.91). This index consists of 6 items scored on a scale
ranging from 0 (not at all a problem) to 4 (a lot of problem) that are then recoded to specific percent values (0=100 to 4=0). The final scores were reverse coded, with higher scores indicating a higher level of general fatigue.
Statistical analyses
Preliminary analyses
Given age variability in the study sample, we used standard and percentile scores to describe cognitive functioning. We sought to optimize the level of concordance between test and self-reported measures by computing sensitivity, specificity, agreement rate using three thresholds
6
commonly used in cognitive functioning measures (-1.0SD, -1.2SD and -1.5SD). To evaluate agreement, we computed Pearson’s correlations between measures.
Main analyses
For the first aim of the study, we computed rank differences based on within sample z scores for both cognitive tested and self-reported elements using the formula: D=(tested z-score)-(self-reported z-score). This difference was calculated for both cognitive domains of interest in this study. From here onwards, the differences observed between these measures will be referred to as, for working memory: WMI-WMS, LNS-WMS, and for attention: DSF-ISS. For the second aim of the study, we first established normality of these differences, and conducted three linear regression models in which each difference was in turn the dependent variable. The independent variables were: general distress, depression, anxiety, positive affects, negative affects, and general fatigue. Models were adjusted for age and gender to account for higher cognitive deficit frequency in older individuals and women. Although socioeconomic status may be an important factor, we could not adjust models as missing information affected 22% of the study sample. Post-hoc bivariate mean comparisons and non-parametric correlations suggested no association between education level and difference scores (ρ=0.13-0.16, p>0.19).
Data availability statement
The data that support the findings of this study are available in the supplementary material of this article.
Results
Cognitive description
On test measures, the sample showed overall working memory or attention deficits with mean percentiles of WMI=29.02 ± 26.16, LNS=32.69 ± 25.76, DSF: 30.62 ± 25.33 (all p values<0.001 when comparing with a median of 50). The sample included a higher proportion of participants with clinically significant deficits (-1.5SD) on working memory (respectively 16% and 15% vs. 9% in norms) and attention (21% vs. 9%). In sharp contrast, on self-report measures,participants did not report greater working memory or attention deficits, with mean percentiles of WMS: M=47.93 ± 27.99 and ISS: M=56.59 ± 31.79 (p>0.53). Clinically significant difficulties in working memory (10.4%) and attention (11.6%) were as frequent as in normative samples (9%; Table S1).
7
Affective description
Compared to the general population (T=50), survivors reported similar general distress (M=49.82 ± 9.17), depressive symptoms (M=48.62 ± 8.72), or anxious symptoms (M=48.70 ± 9.46). They reported more intense positive than negative affect (M=33.77 ± 5.17 vs 18.15 ± 5.50, p<0.001). Participants’ perceived general fatigue was also heterogeneous, with a coefficient of variation SD/M of 89% within the sample (M=23.67 ± 20.98; Table S1).
Preliminary analyses
The most favorable clinical cutpoints optimizing agreement rates between tested and self-reported measures were set at -1.5 SD (WMI-WMS, LNS-WMS et DSF-ISS; Figure 2). The specificity/sensitivity imbalance indicated that self-reported measures reliably identified true negatives (median specificity = 0.87), but did not identify true positives, i.e. participants presenting actual difficulties on cognitive tests (median sensitivity = 0.10). When exploring intercorrelations, we found cognitive test measures to be weakly associated with self-reported cognitive functioning on memory (WMI and WMS: r=0.208, p=0.024; LNS and WMS: r=0.175, p=0.040) but not attention (DSF and ISS: r=0.047, p=0.592). We found cognitive test measures to be basically uncorrelated with emotional distress and affectivity (median r: WMI: -0.033; LNS: 0.001; DSF: -0.066). In contrast, self-reported cognitive measures were largely associated with these domains (median r = WMS: -0.409; CAARS-S:L: -0.539) (Table S2).
Main analyses
Upon analyzing rank differences between tested and self-reported results for the two domains, all distributions appeared unbiased and centered, suggesting an absence of a systematic pattern in favor of “underestimation” or “overestimation” of difficulties, with medians of rank differences of WMI-WMS=0.12, LNS-WMS=-0.50 and DSS-ISS=0.07. For further use in multivariate models, we found a reasonable fit with the normal distribution (Kurtosis = -0.04-0.35, Skewness = 0.19-0.60, Q-Q plots, Kolmogorov-Smirnov tests with p ≥ 0.20 and Shapiro-Wilk tests with p ≥ 0.11) (Figure 3).
When analyzing the potential contributors of the differences between tested and self-reported cognitive abilities, we found a larger negative affectivity to be associated with differences, suggesting an imbalance in favor of larger self-reported than tested difficulties. For working memory (WMI), the differences were not associated with emotional factors. However, using a subtest independent of the attention domain (LNS), the differences were significantly associated
8
with increased negative affects (β=0.066; p=0.023). The results were similar for attention, with a potential contribution of negative affect (β=0.087; p=0.005). For both domains, differences were not associated with age, gender, distress, depression, anxiety, or general fatigue (p>.120; Table S3).
Discussion
In a cross-sectional study involving 138 childhood ALL adult survivors, we found important inconsistencies between working memory and attention measures. We identified negative affect as a probable contributing factor to the imbalance of self-reported over tested difficulties.
With respect to their cognitive profile, participants’ performance on standardized tests assessing working memory and attention appears similar to that found in a recent meta-analysis (M=-0,5 SD)5. The rate of significant deficits 15-21% was twice that of the general population, consistent
with the observation that the two cognitive domains of working memory and attention are particularly affected in childhood ALL survivors5,7. In comparison, self-reported questionnaires
yielded frequencies of around 10%, again similar to previous studies using the same assessment strategy10,26,27. These findings suggest that studies using exclusively self-reported questionnaires,
such as several large-scale studies10,27, could underestimate the frequency of neurocognitive late
effects. Differences in measurement strategy could also explain the large range of frequencies found in the literature. We also found that, in the context of pediatric oncology, cognitive questionnaires were specific but not sensitive28. Consequently, self-reported questionnaires
would not be recommended to assess positive cases, but rather would be recommended to discard negative cases. When used alone, these questionnaires should not be considered as a valid approach to assess the neuropsychological status and should probably not be used to derive prevalence in population-based studies. Because neuropsychological evaluations are long and costly, further research should refine alternative strategies, such as developing online versions of short neuropsychological screening tools29, or improving screening technology using stepwise
approaches30.
One plausible hypothesis to explain such apparent inconsistency between methods calls for a general tendency of normalizing their difficulties among survivors, when describing their own functioning31. Consistent with this, we found that their mean self-reported negative affect was
about half the size of their self-reported positive affect. The rate of participants with significant affective symptoms was also similar to the general population, and the overall portrait of the
9
group was even more positive than in comparable samples31,32. This predominance of positive
affect was observed here in a group of young adults. Previous research have shown that psychological symptoms and negative mood increase during adulthood, as participants face responsibilities, and physical sequelae become more explicit33.
In our study, we did not identify a systematic pattern toward a clear imbalance between self-reported and cognitive-tested issues. Consequently, there was no tendency to “overestimate” or “underestimate” one’s difficulties. In subsequent analyses aiming at explaining differences between measures, we found that only a high level of negative affect, among several other psychological factors (distress, depression, anxiety, and fatigue), could partially explain this phenomenon. Although statistical models only explained a small share of variance, this finding highlights the importance of considering negative affect or mood, when interpreting self-report12.
This observation is consistent with a larger literature on the role of self-reported status in the discrepancy between cognitive tests and questionnaires, across different conditions, in normal controls, and across the lifespan, such as attention disorders, and multiple sclerosis34.
We found that participants’ self-reported cognitive difficulties were more closely related to their self-reported affect than to their results on standardized tests35, suggesting methodological
variance. Similar findings have been observed in other clinical populations, including in neurology or psychiatry36,37, suggesting methodological variance is a robust finding and affect pediatric
oncology in a similar way as other clinical domains. It is probable that the questionnaires assessed less the cognitive status than the individual perception of cognitive abilities and functioning. Sad, tensed, or angry participants would be more likely to focus on their cognitive failures and to perceive their cognitive “impairment” as more severe. This could even increase their feelings of sadness, tension, or anger.38 Finally, whereas frequencies of cognitive difficuties are
systematically higher in girls/women due to cerebral specificities, we did not find that sex was related with differences between test-based and self-reported cognitive difficulties, consistent with previous analyses performed in the PETALE cohort39.
Clinical Implications
Our findings suggest that self-reported cognitive questionnaires should not be used to assess the presence of cognitive deficits and derive frequencies in large-scale studies. Corrective procedures or improved screening tools may be elaborated in the future to address this issue. In addition, cognitive tests and self-reports probably do not measure the same type of cognitive activity12. As
10
cognitive self-report may be vulnerable to deteriorated mood, it could be useful to control for mood in surveys evaluating cognitive deficits with self-reports.
Study limitations
First, our findings reflect the experience of a selected sample of young adult survivors of ALL at a specific time. We must recognize the selection bias of older age at study time and at diagnosis, although it is unclear how this may impact the results, as anteriority was confounded with treatment toxicity and risk status. Thus, the results might not be generalized to any ALL sample or survivors of other types of cancer or participants at other time points along their trajectory. Second, it should be noted that it is hard to find equivalent domains in both types of measures (test and self-reports). For instance it was more difficult to clearly distinguish working memory and attention among self-reported questionnaires than among standardized tests, which could represent a bias in the study. Finally, a large proportion of the observed difference between methods still remain unexplained, as the contributors considered here explained only 14-22% of the inconsistency variance. Future research should include other factors that might influence cognitive assessment in this population, such as socioeconomic status and coping styles40.
Conclusions
In conclusion, our study of 138 adult survivors of childhood ALL suggested that deficits in working memory and attention were more frequent when assessed by standardized tests than self-reports. Yet, we found no systematic tendency to overreport or underreport one’s difficulties. The study identified negative affect as a factor of imbalance between measurement strategies, favoring higher self-reported cognitive difficulties. Future research should recognize that, in survivors of childhood cancer, tested and self-reported cognitive assessments cannot be considered interchangeably. It is likely that the information reported by childhood cancer survivors depends on a variety of factors, including their emotional status.
Acknowledgements
The authors would like to thank all the participants recruited for the study and the clinical research staff.
11
This work was supported by the Institute of Cancer Research of the Canadian Institutes of Health Research, in collaboration with C17 Council, Canadian Cancer Society, Cancer Research Society,
Garron Family Cancer Centre at the Hospital for Sick Children, Ontario Institute for Cancer Research, Fonds de Recherche du Québec-Santé Cancer Grant, and Pediatric Oncology Group of Ontario grant number TCF 118694.
Conflict of Interest
12
References
1. Canadian Cancer Society. Canadian Cancer Statistics. Special topic: Childhood cancer. Toronto, ON: Canadian Cancer Society;2017.
2. Kanellopoulos A, Andersson S, Zeller B, et al. Neurocognitive Outcome in Very Long-Term Survivors of Childhood Acute Lymphoblastic Leukemia After Treatment with Chemotherapy Only. Pediatr Blood Cancer. 2016;63(1):133-138.
3. Conklin HM, Krull KR, Reddick WE, Pei D, Cheng C, Pui CH. Cognitive outcomes following contemporary treatment without cranial irradiation for childhood acute lymphoblastic leukemia. J Natl Cancer Inst. 2012;104(18):1386-1395.
4. Krull KR, Bhojwani D, Conklin HM, et al. Genetic mediators of neurocognitive outcomes in survivors of childhood acute lymphoblastic leukemia. J Clin Oncol. 2013;31(17):2182-2188.
5. Iyer NS, Balsamo LM, Bracken MB, Kadan-Lottick NS. Chemotherapy-only treatment effects on long-term neurocognitive functioning in childhood ALL survivors: a review and meta-analysis. Blood. 2015;126(3):346-353.
6. Lofstad GE, Reinfjell T, Hestad K, Diseth TH. Cognitive outcome in children and adolescents treated for acute lymphoblastic leukaemia with chemotherapy only. Acta
Paediatr. 2009;98(1):180-186.
7. Ashford J, Schoffstall C, Reddick WE, et al. Attention and working memory abilities in children treated for acute lymphoblastic leukemia. Cancer. 2010;116(19):4638-4645. 8. Krull KR, Brinkman TM, Li C, et al. Neurocognitive outcomes decades after treatment for
childhood acute lymphoblastic leukemia: a report from the St Jude lifetime cohort study. Journal of clinical oncology : official journal of the American Society of Clinical
Oncology. 2013;31(35):4407-4415.
9. Kunin-Batson A, Kadan-Lottick N, Neglia JP. The contribution of neurocognitive functioning to quality of life after childhood acute lymphoblastic leukemia.
Psychooncology. 2014;23(6):692-699.
10. Ellenberg L, Liu Q, Gioia G, et al. Neurocognitive status in long-term survivors of childhood CNS malignancies: a report from the Childhood Cancer Survivor Study.
Neuropsychology. 2009;23(6):705-717.
11. Hermelink K, Kuchenhoff H, Untch M, et al. Two different sides of 'chemobrain': determinants and nondeterminants of self-perceived cognitive dysfunction in a prospective, randomized, multicenter study. Psychooncology. 2010;19(12):1321-1328. 12. Pullens MJ, De Vries J, Roukema JA. Subjective cognitive dysfunction in breast cancer
patients: a systematic review. Psychooncology. 2010;19(11):1127-1138.
13. Phipps S, Klosky JL, Long A, et al. Posttraumatic stress and psychological growth in children with cancer: has the traumatic impact of cancer been overestimated? J Clin
Oncol. 2014;32(7):641-646.
14. Schagen SB, Boogerd W, Muller MJ, et al. Cognitive complaints and cognitive
impairment following BEP chemotherapy in patients with testicular cancer. Acta Oncol. 2008;47(1):63-70.
15. Moran TP. Anxiety and working memory capacity: A meta-analysis and narrative review.
Psychol Bull. 2016;142(8):831-864.
16. Snyder HR. Major depressive disorder is associated with broad impairments on
neuropsychological measures of executive function: a meta-analysis and review. Psychol
13
17. Willard VW, Conklin HM, Huang L, Zhang H, Kahalley LS. Concordance of parent-, teacher- and self-report ratings on the Conners 3 in adolescent survivors of cancer.
Psychol Assess. 2016;28(9):1110-1118.
18. Marcoux S, Drouin S, Laverdiere C, et al. The PETALE study: Late adverse effects and biomarkers in childhood acute lymphoblastic leukemia survivors. Pediatr Blood Cancer. 2017;64(6).
19. Wechsler D. Wechsler Adult Intelligence Scale. San Antonio.TX: NCS Pearson;2008:498.2008.
20. Rosenthal EN, Riccio CA, Gsanger KM, Jarratt KP. Digit Span components as predictors of attention problems and executive functioning in children. Arch Clin Neuropsychol. 2006;21(2):131-139.
21. Gioia GA, Isquith PK, Guy SC, Kenworthy L. The behavior rating inventory of executive
function. Lutz, FL: Psychological Assessment Resources. 2000.
22. Conners CK, Erhardt D, Sparrow EP. Conners Adult Attention Rating Scale–Self-Report:
Long Version. North Tonawanda, NY: Multi-Health Systems. 1998.
23. Derogatis LR. The Brief Symptom Inventory–18 (BSI-18): Administration, Scoring and
Procedures Manual. Minneapolis, MN: National Computer Systems. 2000.
24. Watson D, Clark LA, Tellegen A. Development and validation of brief measures of positive and negative affect: the PANAS scales. Journal of personality and social
psychology. 1988;54(6):1063-1070.
25. Varni JW, Katz ER, Seid M, Quiggins DJ, Friedman-Bender A, Castro CM. The Pediatric
Cancer Quality of Life Inventory (PCQL). I. Instrument development, descriptive statistics, and cross-informant variance. Journal of behavioral medicine, 21(2), 179-204. 1998.
26. Kadan-Lottick NS, Zeltzer LK, Liu Q, et al. Neurocognitive functioning in adult survivors of childhood non-central nervous system cancers. Journal of the National Cancer Institute. 2010;102(12):881-893.
27. Prasad PK, Hardy KK, Zhang N, et al. Psychosocial and Neurocognitive Outcomes in Adult Survivors of Adolescent and Early Young Adult Cancer: A Report From the Childhood Cancer Survivor Study. J Clin Oncol. 2015;33(23):2545-2552.
28. Kibiger G, Kirsh KL, Wall JR, Passik SD. My mind is as clear as it used to be: A pilot study illustrating the difficulties of employing a single-item subjective screen to detect cognitive impairment in outpatients with cancer. J Pain Symptom Manage. 2003;26(2):705-715.
29. Boulet-Craig A, Robaey P, Laniel J, et al. DIVERGT screening procedure predicts general cognitive functioning in adult long-term survivors of pediatric acute lymphoblastic leukemia: A PETALE study. Pediatr Blood Cancer. 2018;65(9):e27259.
30. Streiner DL. Diagnosing tests: using and misusing diagnostic and screening tests. Journal
of personality assessment. 2003;81(3):209-219.
31. Bauld C, Anderson V, Arnold J. Psychosocial aspects of adolescent cancer survival. J
Paediatr Child Health. 1998;34(2):120-126.
32. Recklitis CJ, Blackmon JE, Chang G. Screening young adult cancer survivors for distress with the Distress Thermometer: Comparisons with a structured clinical diagnostic interview. Cancer. 2016;122(2):296-303.
33. Brinkman TM, Zhu L, Zeltzer LK, et al. Longitudinal patterns of psychological distress in adult survivors of childhood cancer. Br J Cancer. 2013;109(5):1373-1381.
34. Williams PG, Rau HK, Suchy Y, Thorgusen SR, Smith TW. On the validity of self-report assessment of cognitive abilities: Attentional control scale associations with cognitive
14
performance, emotional adjustment, and personality. Psychological Assessment. 2017;29(5):519-530.
35. Marino SE, Meador KJ, Loring DW, et al. Subjective perception of cognition is related to mood and not performance. Epilepsy Behav. 2009;14(3):459-464.
36. Middleton LS, Denney DR, Lynch SG, Parmenter B. The relationship between perceived and objective cognitive functioning in multiple sclerosis. Arch Clin Neuropsychol. 2006;21(5):487-494.
37. Halari R, Mehrotra R, Sharma T, Kumari V. Does self-perceived mood predict more variance in cognitive performance than clinician-rated symptoms in schizophrenia?
Schizophr Bull. 2006;32(4):751-757.
38. Maor Y, Olmer L, Mozes B. The relation between objective and subjective impairment in cognitive function among multiple sclerosis patients--the role of depression. Mult Scler. 2001;7(2):131-135.
39. Boulet‐Craig A, Robaey P, Laniel J, et al. DIVERGT screening procedure predicts general cognitive functioning in adult long‐term survivors of pediatric acute lymphoblastic leukemia: A PETALE study. Pediatric blood & cancer. 2018;65(9):e27259.
40. Patenaude AF, Kupst MJ. Psychosocial functioning in pediatric cancer. J Pediatr Psychol. 2005;30(1):9-27.
15
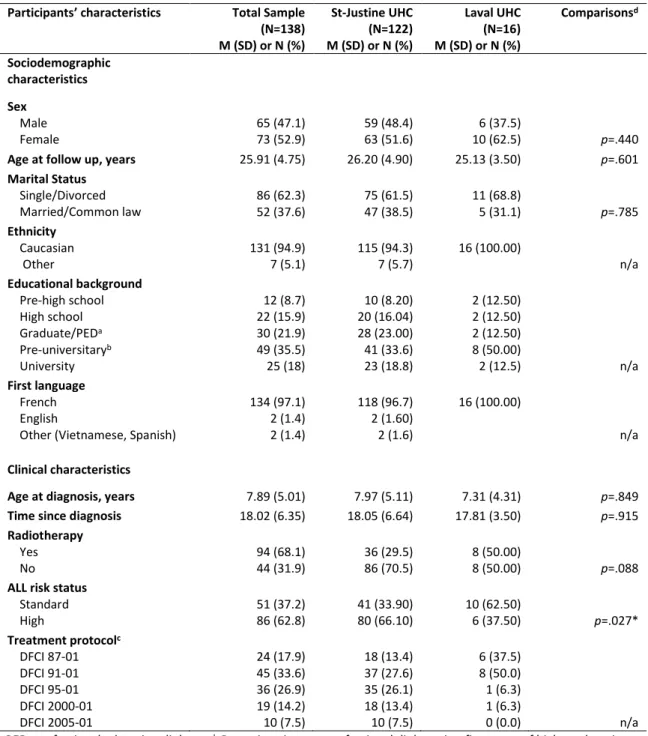
Table 1. Sample description of 138 pediatric ALL adult survivors (> 19 years) from two DFCI sites in Quebec, Canada
Participants’ characteristics Total Sample
(N=138) M (SD) or N (%) St-Justine UHC (N=122) M (SD) or N (%) Laval UHC (N=16) M (SD) or N (%) Comparisonsd Sociodemographic characteristics Sex Male Female 65 (47.1) 73 (52.9) 59 (48.4) 63 (51.6) 6 (37.5) 10 (62.5) p=.440
Age at follow up, years 25.91 (4.75) 26.20 (4.90) 25.13 (3.50) p=.601
Marital Status Single/Divorced Married/Common law 86 (62.3) 52 (37.6) 75 (61.5) 47 (38.5) 11 (68.8) 5 (31.1) p=.785 Ethnicity Caucasian Other 131 (94.9) 7 (5.1) 115 (94.3) 7 (5.7) 16 (100.00) n/a Educational background Pre-high school High school Graduate/PEDa Pre-universitaryb University 12 (8.7) 22 (15.9) 30 (21.9) 49 (35.5) 25 (18) 10 (8.20) 20 (16.04) 28 (23.00) 41 (33.6) 23 (18.8) 2 (12.50) 2 (12.50) 2 (12.50) 8 (50.00) 2 (12.5) n/a First language French English
Other (Vietnamese, Spanish)
134 (97.1) 2 (1.4) 2 (1.4) 118 (96.7) 2 (1.60) 2 (1.6) 16 (100.00) n/a Clinical characteristics
Age at diagnosis, years 7.89 (5.01) 7.97 (5.11) 7.31 (4.31) p=.849
Time since diagnosis 18.02 (6.35) 18.05 (6.64) 17.81 (3.50) p=.915
Radiotherapy Yes No 94 (68.1) 44 (31.9) 36 (29.5) 86 (70.5) 8 (50.00) 8 (50.00) p=.088
ALL risk status
Standard High 51 (37.2) 86 (62.8) 41 (33.90) 80 (66.10) 10 (62.50) 6 (37.50) p=.027* Treatment protocolc DFCI 87-01 DFCI 91-01 DFCI 95-01 DFCI 2000-01 DFCI 2005-01 24 (17.9) 45 (33.6) 36 (26.9) 19 (14.2) 10 (7.5) 18 (13.4) 37 (27.6) 35 (26.1) 18 (13.4) 10 (7.5) 6 (37.5) 8 (50.0) 1 (6.3) 1 (6.3) 0 (0.0) n/a
a PED, professional education diploma. b Pre-universitary or professional diploma is a first stage of higher education
specific to the province of Quebec, Canada, and lasts 2 or 3 years. c Description of treatment protocol strategy
available in: Silverman et al. Leukemia. 2010;24(2):320-334. d Due to the small sample at Laval UHC, comparisons
16
Figure legend
Figure 1.Figure 2.
Red line = -1.5 SD, Green line= -1.2 SD, Blue line= -1.0 SD
Note. Panel A Test measure of working memory is WMI (WAIS-IV) and self-report measure of working memory is WMS (BRIEF-SR). Panel B Test measure of working memory is L-N (WAIS-IV) and self-report measure of working memory is WMS (BRIEF-SR). Panel C Test measure of attention is DSF (WAIS-IV) and self-report measure of attention is ISS (CAARS-S:L). Agreement = TP+TN/total, Sensitivity = TP/(TP+FN), and Specificity = TN/(TN+FP), where TP=true positives, FP=false positives, TN=true negatives and FN=false negatives.
Figure 3.
Note. Distribution A describes the differences between sample Z scores of WMI (WAIS-IV) and WMS (BRIEF-A), Distribution B between L-N (WAIS-IV) and WMS (BRIEF-A), Distribution C between DSF (WAIS-IV) and ISS (CAARS-S:L). Differences are computed using the formula: D=Z(test measure)-Z(self-report measure).
Figure 1.
Flow chart for cognitive and psychosocial description of ALL survivors
374 ALL survivors contacted
Neuropsychological assessment Psychosocial assessment
58 declined to participate 7 excluded (exclusion
criteria) (Do not meet the criteria)
( 309 ALL survivors agreed to participate
(
124 excluded from study on age criteria
(8-18 years)
( 185 ALL adult survivors (19+ years)
138 ALL adult survivors study sample
47 missing data - 43 did not return self-report - 4 did not complete cognitive tests
Figure 2. Diagnostic performances of self-reported measures to identify working memory and attentional difficulties from cognitive testing in a population of 138 pediatric ALL adults survivors
C
B
A
-1 .0 SD -1 .2 SD -1 .5 SD -1.0 SD -1.2 SD -1.5 SD True positives True negatives Optimal cut-points Test measure -1.5 SD Self-report measure -1.5 SD Se = 0.16 (0.02-0.30) Sp = 0.88 (0.82-0.95) Agreement = 0.73 Optimal cut-points Test measure -1.5 SD Self-report measure -1.5 SD Se = 0.10 (-0.03-0.22) Sp = 0.88 (0.10-0.88) Agreement = 0.76 Optimal cut-points Test measure -1.5 SD Self-report measure -1.5 SD Se = 0.05 (-0.04-0.13) Sp = 0.88 (0.82-0.94) Agreement = 0.75Figure 3. Box plot display of inconsistencies between test measures and self-report measures on working memory and attention difficulties in a sample of 138 pediatric ALL adult survivors
A
B
C
Z
sc
or
e
di
ff
er
ence
s
Supplementary Table S1.
Description of working memory and attention difficulties evaluated by cognitive test and self-report measures, and affective status in a sample of 138 pediatric ALL adult survivors
Measures Mean (SD) Frequency below
cutpoint N (%)†
Cognitive measures
WAIS-IV percentile
Working Memory Index 30.62 (25.33) 22 (16.1)a
Letter-Number Sequencing 32.69 (25.76) 21 (15.3)a
Digit Span Forward 29.02 (26.16) 25 (21.1)a
BRIEF-SR percentile
Working Memory Scale 56.59 (31.79) 14 (10.4)a
CAARS-S:L percentile
Inattention Symptoms Scale 47.93 (27.99) 16 (11.6)a
Affective measures BSI-18 T-score General distress 49.82 (9.17) 14 (10.15)b Depression 48.62 (8.72) 13 (9.42)c Anxiety 48.70 (9.46) 12 (8.69)c Somatization 50.95 (8.89) 21 (15.30)c
PANAS (raw score)
Positive affects 33.77 (5.17)
Negative affects 18.15 (5.50)
PedsQL-MFS (raw score)
General fatigue 23.67 (20.98)
Note. †The frequency in a normative sample is approximately 9% (normal distribution)
a
Cut-point = -1.5 SD
b Standard algorithm for determining positivity from the BSI-18 manual c Cut-point = 63T score for Depression, Anxiety and Somatization
WAIS-IV: Wechsler Adult Intelligence Scale Fourth Edition; BRIEF-SR: Behavior Rating Inventory of Executive Function, Adult version; CAARS-S:L: Conners Adult ADHD Rating Scale, Self-report, Long version; PANAS: Positive and Negative affect Schedule; PedsQL: Pediatric Quality of Life Multidimensional Fatigue Scale, Standard version, Young adult report; BSI-18: Brief Symptom Inventory.
Supplementary Table S2.
Pearson correlations between cognitive test measures, cognitive self-report measures, and self-report affective status in a sample of 138 pediatric ALL adult survivors
*p<0.05, **p<0.01, ***p<0.001
1 2 3 4 5 6 7 8 9 10 11
1. Working Memory Index (WAIS-IV)
1.00
2. Letter-Number (WAIS-IV) 0.899*** 1.00
3. DigitSpan Forward (WAIS-IV)
0.737*** 0.518*** 1.00
4. Workig Memory Scale (BRIEF-SR)
0.208* 0.175* 0.116 1.00
5. Inattention Symptom Scale (CAARS:S-L)
0.125 0.044 0.047 0.735*** 1.00
6. General Distress, (BSI-18) -0.084 -0.064 -0.085 -0.430*** -0.575*** 1.00
7. Anxiety (BSI-18) -0.027 0.017 -0.043 -0.399*** -0.515*** 0.830*** 1.00
8. Depression (BSI-18) -0.039 -0.015 -0.090 -0.310*** -0.512*** 0.779*** 0.779*** 1.00
9. Negative Affect (PANAS) -0.026 -0.045 -0.009 -0.418*** -0.589*** 0.672*** 0.651*** 0.618*** 1.00
10. Positive Affect (PANAS) -0.005 0.045 -0.046 0.161 0.312*** -0.267** -0.135 -0.321*** -0.189* 1.00
Supplementary Table S3.
Summary of multiple regression models predicting inconsistencies between cognitive test measures and self-report measures in domains of working memory and attention difficulties in a sample of 138 pediatric ALL adult survivors
Models B Std Error
A. Inconsistency on working memory
Block 1 Age Sex Block 2
Positive affect (PANAS) Negative affect (PANAS) General distress (BSI-18) Depression (BSI-18) Anxiety (BSI-18)
General Fatigue (PedsQL)
-.003 .232 -.027 .058 -.015 -.003 .021 .005 .025 .242 .024 .031 .026 .033 .025 .009 -.009 .091 -.110 .256 -.022 .156 -.111 .090
B. Inconsistency on working memory
Block 1 Age Sex Block 2
Positive affect (PANAS) Negative affect (PANAS) General distress (BSI-18) Depression (BSI-18) Anxiety (BSI-18)
General Fatigue (PedsQL)
-.022 .368 -.017 .066 -.018 .001 .012 .010 .022 .223 .022 .029 .023 .031 .022 .008 -.081 .145 -.070 .287* .007 .090 -.128 .169 C. Inconsistency on attention Block 1 Age Sex Block 2
Positive affect (PANAS) Negative affect (PANAS) General distress (BSI-18) Depression (BSI-18) Anxiety (BSI-18)
General Fatigue (PedsQL)
-.022 .371 -.044 .087 .009 -.010 .007 .002 .025 .237 .023 .031 .024 .033 .024 .008 -.074 .135 -.167 .352* -.063 .051 .057 .027 Note. Inconsistencies are measured as differences between z-scores in tested and self-reported measures. For Model A we used the inconsistency between WMI (WAIS-IV) and WMS (BRIEF-A). For Model B we used the inconsistency between L-N (WAIS-IV) and WMS (BRIEF-SR). For Model C we used the inconsistency between DSF (WAIS-IV) and ISS (CAARS-S:L).
For model A, contribution ΔR2 were: Block 1= .002, Block 2= .143. Total model F= 2.278* R2= .081
For model B, contribution ΔR2 were: Block 1=.012, Block 2= .164. Total model F= 3.406* R2= .125
For model C, contribution ΔR2 were: Block 1= .015, Block 2= .217. Total model F= 4.628** R2= .181
*p < 0.05 **p < 0.01