HAL Id: hal-00125062
https://hal.archives-ouvertes.fr/hal-00125062
Submitted on 17 Jan 2007HAL is a multi-disciplinary open access archive for the deposit and dissemination of sci-entific research documents, whether they are pub-lished or not. The documents may come from teaching and research institutions in France or abroad, or from public or private research centers.
L’archive ouverte pluridisciplinaire HAL, est destinée au dépôt et à la diffusion de documents scientifiques de niveau recherche, publiés ou non, émanant des établissements d’enseignement et de recherche français ou étrangers, des laboratoires publics ou privés.
Rheological characterization and modelling of hydrates
slurries during crystallization under laminar flowing
Annie Fidel-Dufour, Frédéric Gruy, Jean-Michel Herri
To cite this version:
Annie Fidel-Dufour, Frédéric Gruy, Jean-Michel Herri. Rheological characterization and modelling of hydrates slurries during crystallization under laminar flowing. Fifth International Conference on Gas Hydrates (ICGH 5), Norvège, 13 au 16 juin 2005, Jun 2005, Tromdheim, Norway. �hal-00125062�
RHEOLOGICAL CHARACTERISATION AND MODELLING OF
HYDRATE SLURRIES DURING CRISTALLIZATION UNDER
LAMINAR FLOWING
A. Fidel-Dufour, F. Gruy, J.M. Herri(*)
Centre SPIN, Ecole des Mines de Saint Etienne, 158 Cours Fauriel, 42023 Saint Etienne Cedex 2
Abstract
An original experimental set-up was developed and used for studying crystallization and rheology of methane hydrate/water/dodecane system under laminar flowing. Dynamic viscosity and conversion of water and gas into gas hydrate crystals were measured during the process for various water contents. Experimental results were explained by means of a model including nucleation, growth and agglomeration. Due to the high value of crystal and drop concentrations, agglomeration takes place through three-bodies collisions between one water drop and two already formed agglomerates. Resulting agglomerates were considered as fractal-like ones. During crystallization and agglomeration, the effective volume fraction of drops and porous agglomerates is increased, then suspension viscosity increases. When all water drops are crystallized, agglomeration stops and viscosity do not change.
Keywords: rheology, cristallisation, agglomeration, laminar flowing NOMENCLATURE.
A area of the Taylor bubble [m2]
a volume area of water droplets [m-1]
c concentration in solute [mole.m-3]
ceq concentration in solute at interphase
equilibrium [mole.m-3]
D internal diameter of the stream section [m]
D1 internal diameter of riser and descending
pipe [m]
Df fractal dimension
F friction coefficient
G acceleration of gravity [m.s-2]
kG kinetic constant of crystallization [s-1]
kagg kinetic constant of agglomeration
kL mass transfer coefficient [m.s-1]
Ki,j agglomeration kernel [m3.s-1]
L equivalent rheological length of the stream section (38.5 m )
Li length of section i [m]
hi height of section i [m]
Ni number concentration in i-agglomerate [m-3]
N0 number concentration in water drop [m-3]
.(*) Corresponding author : Phone +33 4 77 42 02
92 Fax +33 4 77 49 96 94 E-mail : herri@emse.fr
0 0
N number concentration in water drop at
initial time [m-3]
Ni number concentration in i-agglomerate [m-3]
P pressure [Pa]
Q volumetric flow rate of the flowing phase
(without gas phase)[m3.s-1]
QG volumetric flow rate of gas in the riser
[m3.s-1]
Ri radius of i-agglomerate [m]
Re Reynolds Number
S structure factor of agglomerate T temperature [K]
t time [s]
UL liquid superficial velocity [m.s-1]
VSL liquid volume in a slug unit [m3]
x conversion ∈[0,1]
Z compressibility factor Greek letters
αi,j agglomeration efficiency
γ
shear rate [s-1]P
∆ pressure drop [Pa]
ε average distance between surfaces of
two drops [m]
µ dynamic viscosity [Pa.s]
µs dynamic viscosity of suspension [Pa.s]
µ0 dynamic viscosity of dodecane [Pa.s]
φ
volume fraction in dispersed phase ∈[0,1]eff
φ
effective volume fraction in dispersedphase ∈[0,1]
max
φ
volume fraction corresponding to closepacking ∈[0,1]
2
H O
φ
initial volumic water content of the waterin oil emulsion ∈[0,1]
ρ
mass density of the flowing phase (withoutgas phase) [kg.m-3]
L
ρ
mass density of the flowing phase [kg.m-3]G
ρ
mass density of the gas phase [kg.m-3]GL
ρ
mass density of the gas lift [kg.m-3]σ deviation
INTRODUCTION
A way to prevent agglomeration of hydrate particles in deep see pipelines deals with the use of low dosage hydrate inhibitors (LDHI) which can act on the crystallization kinetics while delaying nucleation, modifying growth, or preventing agglomeration. The advantage of this approach is the poor quantity of additives to be used : about 1% mass of the water phase (see reviewing of Kini et al [1])
The nature of the kinetic additive effect is rarely well understood, mostly because of the difficulty to interpret microscopic events from observation at the macroscopic scale. Attempts to model gas hydrate crystallization have been achieved on simple systems (water plus gas), and simple geometry (batch stirred reactors) using particle sizers [2-5]. Generalization to real systems (water in oil emulsion) and real flowing has never been achieved, due to the complexity of the task. In the practice, qualification of additive efficiency on real fluids is performed experimentally, firstly at the laboratory scale on batch systems or mini loop systems (for a first screening), then at the pilot scale and finally at the field scale (for instance, see review of Sinquin et al [5]). Procedures can considerably vary between the laboratories and do not ensure possibilities of comparison or fundamental understanding.
In the open literature, the only tentative to connect rheology, crystallization, oil chemistry and additive influence has been performed by Camargo et al [6,7]. In these works, the
authors studied an asphaltenic crude oil which exhibits a natural anti agglomerant effect and they compared this behaviour to that of a condensate which needs synthetic additives to prevent agglomeration. The experimental
analysis consisted of a rheological
characterization after complete crystallization, first at the laboratory scale and then at the pilot scale.
The approach which is developed in this paper is inspired from the work of Camargo et al from which we retain in particular the viscosity model based on Mills approach [8]. Here, we have a special attention for early steps of the crystallization process during which particle formation consumes gas and modifies the fluid viscosity. This paper is organized as follows : - Description of the new flow loop reactor in which the suspension is flowing without any pump or mechanical machine. The objective is to minimize the high shear stress encountered in classical pumps which can deeply modify the nature and the way of crystallisation. This section includes the modelling of the global behaviour of the apparatus.
- Experimental results concerning the rheology of water in dodecane emulsion before and after hydrate crystallization, in the presence of an anti-agglomerant additive.
- Modelling of the emulsion crystallization and of the evolution of suspension rheology. - Discussion and conclusion.
EXPERIMENTAL SET-UP
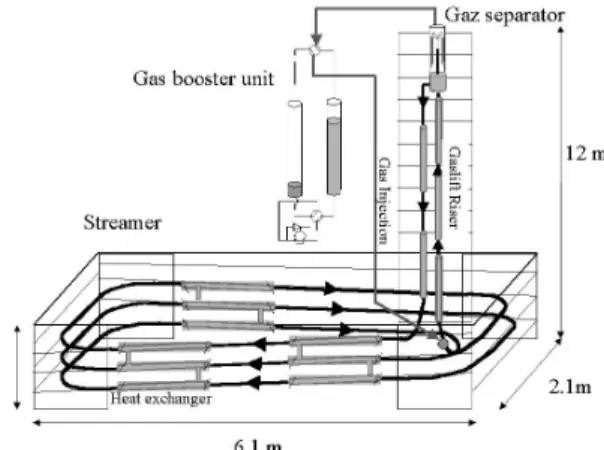
The experimental set up (Figure 1) is a flow loop reactor simulating some of the conditions of the oil flow in deep sea pipelines : pressure in the range of [1-10 MPa] and temperature in the range of [0-10°C].
The different parts of this apparatus are : - the flow section is a large streamer of 36.1 m long, 1.02 cm internal diameter and constant slope of 4°. The streamer is composed of 3 identical levels. Each level is composed of 2 long straight pipes of 4 m long, 2 short sections of 0.3 m long, and four elbows of 0.5 m radius. The pipes are maintained at constant temperature by means of 9 external cooling jackets of 1.5 m long built on the 1shell-and-1tube principle. On the three levels constituting the streamer, 7 temperature probes monitor the fluid temperature profile. A global pressure
drop measurement is performed between the entry and the exit.
- A parallel one meter pipe of ¼ inch diameter is mounted on an elbow of the loop. It is temperature controlled down to –20°C and it acts as a cold point to initiate crystals nucleation.
- The exit of the flow section is connected to a gas lift riser (10.6 m long and 1.73 cm internal diameter) in which gas coming from a separator located at the top of the column is re-injected. The gas lift temperature is controlled using 3 heat exchangers of 2 m long. A differential pressure transmitter monitors the pressure drop along this section. A temperature probe is mounted at the exit of the gas lift. The gas lift ensures both the flow driving force and the gas absorption.
Figure 1. Schematic of the flow loop reactor - The input of the flow section is connected to the descending pipe (downcomer) (8.3 m height, 9.1 m long and internal diameter of 1.73 cm, plus a section of 0.39 m in internal diameter of 1.02 cm) coming from the separator and transporting the fluid after gas separation. The downcomer pipe is equipped with two heat exchangers of 2 m long, a temperature probe and a pressure drop sensor. A Coriolis mass-flow-meter is mounted on the downcomer pipe (Micro Motion R050)
- The gas separator is a tube of 2 inches external diameter and 2 m height. The gas lift tube enters into it on an height of 1.5 m. The geyser exiting the gas lift column is separated into its different phases : gas phase goes up whereas liquid and solid phases go down and enter the downcomer pipe. Gas is then flowed to a gas booster unit.
- The gas booster unit consists of two ballasts in which liquid water is flowing from one to the other and inversely. One of the ballast acts as a sucker (sucking gas from the top of the separator) and the other one as a pusher (pushing gas at the bottom of the gas lift riser). Finally, this gas lift is able to move the emulsion or the suspension without any pump or mechanical system. The driving force is the
pressure difference ∆P between the bottom
parts of the gas lift riser and downcomer pipe.
EXPERIMENTAL PROTOCAL
The experimental results which are presented in this paper are relative to the influence of additives on the rheology of the water in oil emulsion before crystallisation and of the hydrate suspension during crystallisation. The system under study is composed of water, dodecane and an additive. Dodecane is 99.9 % pure dodecane from V3 CHIMIE. Methane is pure 99.99% from AIR LIQUIDE. The additive is an anti-agglomerant solution (IPE 202) patented by IFP (Institut Français du Pétrole). The total volume of the solution is 7.9 L. The water mass fraction varies in the range [5-30%]. The additive is added in various proportions to stabilize the suspension during crystallisation. The additive mass fraction varies in the range [0-0.5 %] of the oil mass. The emulsion is prepared in a batch reactor under stirring and then introduced in the loop. After introduction, the flow is forced by air injection at the bottom of the gas lift. Once operating temperature reached [2-4°C], the rheological characterization of the emulsion can be performed by varying the air injection rate.
Then, air injection is stopped and the gas separator is connected to the ballasts of the gas booster unit. The system is filled with methane gas up to a pressure of 7 MPa (first pressurisation in Figure 2). The pump between the two ballasts of the gas booster unit is started and methane gas is injected at the bottom of the gas lift. Loop flow starts and pressure strongly decreases due to gas consumption in the gas lift. After 10 min, the gas injection is stopped and system is filled again up to 7 MPa. Gas injection is re-started and loop flow starts again. Total pressure decreases slightly and liquid saturation is reached. During this saturation phase, we can observe that
temperature is not perfectly controlled (still maintained in the range [2-5°C]). The reason for is that the loop needs to flow to be normally cooled because the 14 heat exchangers ensure a heat insulation on only one half of the loop.
Figure 2. Temperature and pressure in the loop versus time
After a while (60 min in Figure 2), gas hydrate crystallisation occurs and a sudden temperature drop is detected in relation to a pressure decrease : crystallisation is exothermic and consumes methane gas which is incorporated in the hydrate phase. As a consequence of crystallisation, pressure finally reaches a plateau from which we can determine the water conversion into hydrates. Except during the first instants of crystallisation, temperature is correctly controlled in the range [2.5-3.5°C].
EXPERIMENTAL RESULTS
Figure 3. (Q,∆P) plots for 7% volumic water in
dodecane emulsion and influence of IPE 202 additive mass concentration (temperature of
4°C, atmospheric pressure)
Water in oil emulsion characterization
In Figure 3 are plotted the experimental points (Q,∆P) for 7 % (volumic) water content in oil
emulsion, at various additive concentration,
temperature of 4 °C and pressure of 0.1 MPa. From this curve, we can clearly deduce that the water in oil emulsion presents a Newtonian behaviour. The additive concentration does not affect the emulsion viscosity. This has been observed at different water content in the range [3.5-18% vol.]. Thomas law [9] gives a good interpolation for experimental viscosities as a function of the water content.
2 16.6
0
1 2.5 10.05 0.00273e φ
µ
φ
φ
µ
= + + +Characterization during crystallisation
The precise description of crystallisation is performed from the presentation of two types of graphs. The first ones show the evolution of (Q,∆P) and second ones show the time
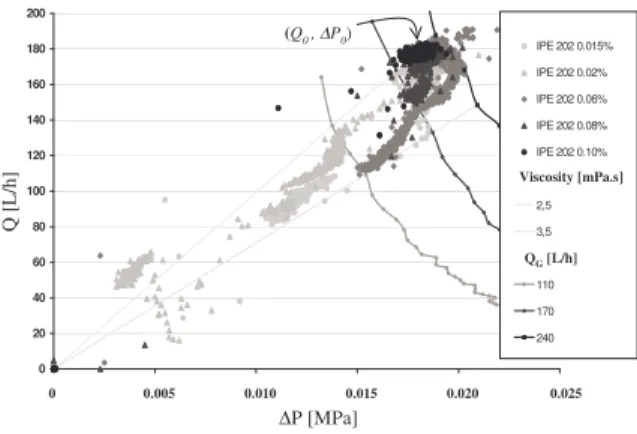
evolution of viscosity and water conversion. Figure 4 presents the influence of additive
concentration on (Q, ∆P) evolution for a water
content of 7%. At high concentration (0.10 %), (Q, ∆P) remains constant (noted (Q0, ∆P0)) during the overall crystallisation : the viscosity is not modified as the water converts into hydrate. For smaller additive concentrations,
we can see that (Q, ∆P) point starts from
(Q0, ∆P0) and then moves towards to the origin.
This means that the gas injection rate is decreased independently of the operator whereas the viscosity remains globally constant, in the range [2.5-3.5 mPa.s]. This effect can be attributed to a blockage, or a plugging at the level of the gas injector.
Figure 4. (Q,∆P) during crystallisation of an
7 % water content emulsion at pressure of 7.5 MPa and temperature of 4°C : influence of
additive concentration
Figure 5 shows the influence of the water content at a constant additive concentration of 7% eau 0 50 100 150 200 250 0 0.005 0.01 0.015 0.02 0.025 0.03 0.035
pression différentielle [Pa.s]
dé bi t[ L/ h] IPE 202 0.01% IPE 202 0.015% IPE 202 0.02% IPE 202 0.04% IPE 202 0.06% IPE 202 0.08% IPE 202 0.10% ∆P [MPa] Q [L /h ] 0 1 2 3 4 5 6 7 8 0 30 60 90 120 150 180 210 240 270 temps [minutes] te m pé ra tu re [° C ] 0 10 20 30 40 50 60 70 80 90 pr es si on [b ar s] Température Pression Première pressurisation Seconde pressurisation Formation des hydrates Diminution de pression due à la formation Augmentation de température due à la formation Raccordement des ballasts
à la boucle
Augmentations de température dues aux pressurisations et à la solubilisation
du méthane Pressure Temperature P [M Pa ] T [° C ] Hydrate formation Loop to gas booster unit connection
Exothermic crystallization Gas consumption by hydrate formation Time [min] Second pressurisation First pressurisation
Temperature increase due to gas compression and gas dissolution
0 20 40 60 80 100 120 140 160 180 200 0,00 0,05 0,10 0,15 0,20 0,25 pertes de charges [bars]
dé bi t [ L/ h] données expérimentales IPE 202 0.015% IPE 202 0.02% IPE 202 0.06% IPE 202 0.08% IPE 202 0.10% viscosité [mPa.s] 2,5 3,5 débit gaz [L/h] 110 170 240 ∆P [MPa] Q [L /h ] Viscosity [mPa.s] QG[L/h] (Q0 , ∆P0) 0 0.005 0.010 0.015 0.020 0.025
0.10 %. As above mentioned, this concentration is enough to stabilise the emulsion at water content of 7% and to maintain a constant viscosity during crystallisation.
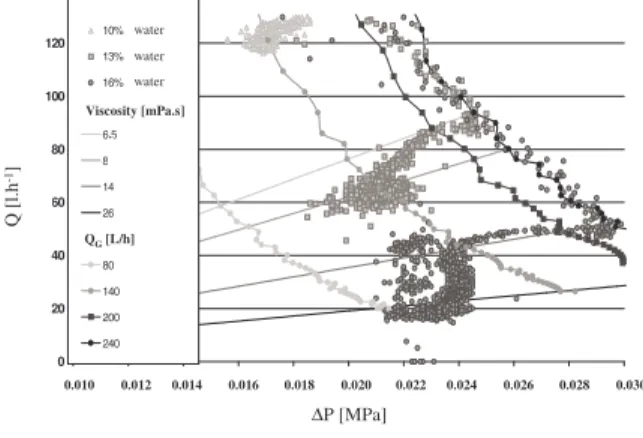
Figure 5. (Q,∆P) during crystallisation of 10,
13 and 16 % water content emulsions at pressure of 7.5 MPa ,temperature of 4°C and
additive concentration of 0.1%
This effect is conserved for a water content of 10%. For water content of 13% and 16%, the (Q, ∆P) evolution is different. Firstly an
increase of the viscosity at constant gas injection rate QG=200-240 l/h is observed. Secondly a decrease of the gas injection at constant viscosity is observed. And finally, the
experimental point (Q, ∆P) stabilizes. So,
crystallization results in a double effect : fluid viscosity is increased, and gas injector is partially plugged after a while.
The period during which viscosity increases and gas injection rate maintains constant is presented in Figures (6,7).
Figure 6. Time evolution of the relative viscosity of hydrate slurries crystallizing in water in oil emulsion at pressure of 7.5 MPa, temperature of 4°C and additive concentration
of 0.1% : influence of the water content Figure (7) shows that viscosity of 7 % water emulsion remains constant during all the
experiment while viscosity of 10 % water emulsion increases slightly to reach a constant value.
At water content of 13% and 16%, the behaviour is similar. Firstly the viscosity increases strongly to reach a maximum. Then, it decreases to reach a constant value. Finally, the viscosity increases again. In Figure (6), the last viscosity increase corresponds to the moment at which the gas injection rate begins to decrease.
At water content of 18%, the viscosity increases rapidly but the flow stops suddenly due to a plug formation.
Figure 7. Time evolution of the conversion in hydrate slurries crystallizing in a water in oil emulsion at pressure of 7.5 MPa, temperature of 4°C and additive concentration of 0.1% :
influence of the water content
Figure (7) shows the time evolution of the conversion. There is no clear relation between the water content and the kinetics of gas absorption during crystallisation. It can be noted that the maximum conversion is 50%. Surely, due to the hydrate formation, the left liquid water in the hydrate particles becomes inaccessible to methane and the crystallisation stops.
MODELLING
The following work is an attempt to quantitatively interpret the experimental results expressed as
µ
= f t(
,φ
H O2)
(figure6) and x= f t
(
,φ
H O2)
(figure 7, x :conversion).
Conversion evolution
After the initial absorption, the pressure decrease corresponds to methane consumption
1 2 3 4 5 6 7 0.0 0.5 1.0 1.5 2.0 2.5 3.0 3.5 4.0 4.5 5.0 time [h] R el at iv e vi sc os it y 7% 10% 13% 16% 18% model experiments Volumic Water content 7% 10% 13% 16% 18% model experiments Volumic Water content 0 20 40 60 80 100 120 0,10 0,12 0,14 0,16 0,18 0,20 0,22 0,24 0,26 0,28 0,30 pertes de charges [bars]
dé bi t [ L/ h] données expérimentales 10% eau 13% eau 16% eau viscosité [mPa.s] 6,5 8,0 14,0 26,0 débit gaz [L/h] 80 140 200 240 Viscosity [mPa.s] QG[L/h] Q [l .h -1] ∆P [MPa] water water water 0.010 0.012 0.014 0.016 0.018 0.020 0.022 0.024 0.026 0.028 0.030 . 0 10 20 30 40 50 60 70 0 0.5 1 1.5 2 2.5 3 3.5 4 4.5 5 Time [h] co nv er si on Volumic Water content 7% 10% 13% 16% 18%
by crystallization (Figure 7). The total quantity of consumed gas increases with the water
content
φ
H O2 . The conversion which is notdependent on
φ
H O2 (x<0.35) is a quasi-linearfunction of time. The consumption of methane takes place in the slugs. A mass balance for methane in a slug unit, consisting in a Taylor bubble (TB) and liquid slug, can be written :
(
1 2)
( ) ( ) ( )(
)
SL H O L TB SL L droplets eq dc V k A HP c V k a c c dt φ − = − − −c : methane concentration in dodecane phase
ceq : methane concentration in dodecane at gas
hydrate/liquid water equilibrium
VSL : liquid volume in a slug unit
kL : mass transfer coefficient
A : area of the Taylor bubble a : specific surface of water droplets assuming steady state, dc/dt=0 gives :
( )
( )
( )
( )
L TB SL L droplets eq L TB SL L droplets k A HP V k a c c k A V k a + = + and( )
( )
( )
L TB SL( )
L droplets(
)
consumption eq L TB SL L droplets k A V k a V HP c k A V k a = − + if( )
k AL TB >>VSL( )
k aL dropletsthen( )
(
)
consumption SL L droplets eq V =V k a HP c−As the droplet diameter is approximately not
dependent on
φ
H O2 , the volume area of waterdroplets is proportional to
φ
H O2 . Then, we canwrite :
(
)
2 consumption H O eq V ∝φ
HP c− or x∝(
HP c t− eq)
This equation, which expresses the
experimental results, is based on the following hypothesis : the mass transfer in the vicinity of water droplets and within them is the rate determining step for methane consumption.
Dynamic viscosity evolution
After an increase, the dynamic viscosity reaches a plateau. This one is short in the case of high water content. Dynamic viscosity evolution is very sensitive to the water content value. Dynamic viscosity keeps a constant
value for
φ
H O2 =0.07 whereas it stronglyincreases with time for
φ
H O2 =0.18.In the case of
φ
H O2 =0.07, dynamic viscosityis constant while the conversion in methane hydrate occurs. We can conclude that crystallization, or equivalently conversion of water droplets into crystals, does not modify the dynamic viscosity. Its increase for higher water content values can be explained by agglomeration : agglomerates, which are probably porous, occupy a larger volume than the corresponding dispersed suspension ; as the dynamic viscosity increases with the volume fraction in discrete phase, agglomeration leads to an increase in dynamic viscosity.
Agglomeration in a laminar flow is due to particle encounters which result themselves from velocity gradients thus shear. Generally, agglomeration can be represented by a quasi-chemical reaction between two agglomerates consisting respectively of i and j primary particles : ( ) ( )i + j → +(i j) with , i j i j i j dN K N N dt + = i
N is the number concentration of agglomerate
consisting in i primary particles.
Kinetic constant (Ki,j agglomeration kernel) can
be expressed as [10]:
(
)
3 , 4 3 i j i j K =γ
R R+where
γ
is the shear rate, the mean value ofwhich is in a duct : D UL 3 16 =
γ
LU
is the liquid superficial velocity in the duct.Then, one deduces the characteristic time of agglomeration :
( )
O H L L U D N R D U N K 2 1283 8 9 64 . 1 3 1φ
π
τ
= = = − − so, for UL =0.5ms−1, D=0.0102m, 2 0.1 H Oφ
= , the agglomeration characteristictime is equal to about 0.015s, which we have to compare to the experiment duration (3h). Thus classical agglomeration is very fast. In fact we have to take into account the agglomeration
(
)
3 , , 4 3 i j i j i j K =γ
R R+α
Agglomeration efficiency contains different contributions [11]: hydrodynamic resistance (leading to a weakly repulsive interaction), physico-chemical forces (attractive Van der Waals interaction) and adsorbed polymer effect. Only the presence of certain additive can lead to an agglomeration efficiency value close to 0. Indeed, this is observed for experiments
with
φ
H O2 =0.07, thus agglomeration forsuspension with
φ
H O2 >0.07 occurs thanks toanother mechanism.
The average distance between surfaces of two drops (made dimensionless by dividing by the drop diameter) of the emulsion checks the expression : 2 1/3 1 6 H O
π
ε
φ
= − This spacing allows the passage of a third drop if : 1
ε
> or 2 0.066 48 H Oπ
φ
< =It is thus understood that the crystallized drops
are in a great proximity when
φ
H O2 >0.07.The agglomeration must benefit from it. The characteristics of the flow seem secondary compared to the geometrical characteristics of the suspension.
Thus, we suggest the following mechanism : Three populations coexist in the suspension : - water drops (index 0),
- crystallized water drops called primary particles (index 1)
- agglomerates with i primary particles
Number concentrations are respectively
denotedN N N0, ,1 i
The primary particles are formed in the low temperature (-20°C) derivation loop : the formation rate is proportional to the number concentration in drop : 1 0 G dN k N dt =
The formation includes at the same time nucleation and growth of crystals in the drop. The result is a sufficiently solid crystallized
drop. These crystallized drops are then transported along the loop of circulation. The crystallized drops agglomerate by the following mechanism. Let us consider two agglomerates respectively containing i and j primary particles. Their agglomeration will be done by the intermediary of a not yet crystallized drop. This is represented by the following quasi-chemical equation :
( ) (0) ( )i + + j → + +(i j 1)
The result is an agglomerate with i+j+1 crystallized primary particles, including the drop (0). This mechanism requires a favoured ternary collision by the already evoked proximity of the drops or particles
(
φ
H O2 >0.07). It explains the strong sensitivityof the agglomeration to water content. It associates the size limits reached by agglomerates to an impoverishment in drops (0). One can also expect the formation of very porous agglomerates because the bonds are done by lonely drops (0).
The conversion of water into gas hydrate occurs parallel to agglomeration. So, methane consumption appears during :
- the transformation of water drops into partially crystallized drops
- the internal growth of partially crystallized drops
- the completion of crystallization in agglomerates
so, methane consumption goes on whereas agglomeration stops because of lack of water drops.
In order to simplify the equation setting, we modify the attribution of an index to an agglomerate. Previously, the agglomerates were identified by their number of primary particles. In fact, one notes that the above-mentioned quasi chemical reaction leads to agglomerates containing j initially crystallized drops and j-1 initially non crystallized drops : (1)+(0)+(1) (1-0-1) (1-1-1)=3
(1-1-1)+(0)+(1) (1-1-1-0-1) (1-1-1-1-1)=5 ……
Then, the agglomerates contain an odd number of primary particles. One characterizes an
agglomerate with i=2j−1 primary particles
by the integer j.
So, Three populations coexist in the suspension :
- water drops (index 0),
- crystallized water drops called primary particles (index 1)
- agglomerates with i primary particles (index j
with i=2j−1 and j≥2) .
The population balance can be written (the
agglomeration kernel kagg will be kept
constant, even if its dependence (unknown)
with ε is strong around
φ
H2O=0.07):1 0 0 1 1 G agg j j dN k N k N N N dt ∞ = = −
∑
1 0 0 1, 1 1 2 k k agg i j agg k j i i j k j dN k N N N k N N N dt − ∞ = + = = =∑
−∑
1 k >The total number of elementary entities (initial concentration of water drops) is constant :
(
)
0 0 1 0 2 2 1 k k N N ∞ k N N = + +∑
− = where 0 0N is the drop concentration before
crystallization (proportional to
φ
H O2 ).One can make dimensionless this equations set by means of new variables :
0 0 ' k k N N N = and t'=tkG
New equations system is as follows (the prime were removed to make more readable the equations): 2 * 2 1 0 0 1 1 agg H O j j dN N k N N N dt
φ
∞ = = −∑
(eq. 1) 2 2 1 * 2 * 2 0 0 1, 1 1 2 k k agg H O i j agg H O k j i i j k j dN k N N N k N N N dt φ φ − ∞ = + = = =∑
−∑
(eq.1’)(
)
0 1 2 2 1 k 1 k N N ∞ k N = + +∑
− = (eq. 2)The dimensionless agglomeration kernel k*agg
is the new kernel corresponding to the dimensionless equations.
Initial conditions are : 0
0 1 k 0 0
t = N = N = k> (eq.3)
Numerical solutions are obtained by classical ordinary differential equations solver for
1< <k 3000. kagg is a fitting parameter. It is
taken independent of
φ
H O2 .The dynamic viscosity is obtained from the expression (following Mills [8]):
2 0 max 1 1
µ
φ
µ
φ
φ
− = − (eq. 4) 0,µ φ
are respectively the dynamic viscosity ofthe continuous phase and the volume fraction in
dispersed phase.
φ
maxis the volume fractioncorresponding to close packing, the value of which is taken equal to 4/7.
For the emulsion :
2 2 2 0 max 1 1 H O e H O
φ
µ
µ
φ
φ
− = − (eq.5)For the suspension during crystallisation : 2 0 max 1 1 eff s eff
φ
µ
µ
φ
φ
− = − (eq.6) effφ
is the effective volume fraction in dispersedphase. It takes into account the compactness or porosity of agglomerates.
As we are only interested by the effect of crystallisation on the suspension dynamic
viscosity, we calculate the ratio s
e
µ
µ
.Following Mills, the effective volume fraction contains contributions of all the agglomerates. We assume that they have a fractal morphology
(Df : fractal dimension). Their outer radius
satisfies the equation : 1 1 Df i R i R S = (eq.7)
The structure factor S is deduced from Gmachowski [12]:
0.42 f 0.22
S = D − (eq.8)
then, the effective volume fraction can be
written (i=2k−1) : 2 3 0 1 2 2 1 Df eff H O k k k N N N S φ φ ∞ = − = + +
∑
(eq.9)° The above dimensionless concentrations are derived from the numerical solving of the previous system [equations 1-3]. So, we candraw s
(
, 2)
H O e f tµ
φ
µ
= with 3 fittingparameters k*agg, kGet Df. kG is directly
related to the time scale.
A sensitivity study of equations system
[1-3,5,6,9] to the parameters k*agget Dfshows
that they have a strong effect on relative viscosity value at the plateau (Figure 6) and a
little effect on the time to reach the plateau.
Higher the fractal dimension or lower k*agg,
lower the relative viscosity value at the plateau. Optimisation (by a least square method) on
(
, 2)
s H O e f tµ
φ
µ
= data based on minimizationof the standard deviation value σ leads to the
results presented in Table 1. Parameter σ is
defined by : 2 2 ,exp, , , 1 2 ,exp, 1 nH O r i r th i i H O r i n
µ
µ
σ
µ
= − = ∑
2 H On is the number (=5) of case studies
(
φ
H O2 =0.07, 0.10, 0.13, 0.16, 0.18).This shows (Table 1) that the fractal dimension is probably smaller than 2. In this case the curves have a sigmoid-shape, the relative
viscosity evolution for
φ
H O2 =0.07, 0.10, 0.16,0.18 are well represented. On the contrary, the
relative viscosity evolution for
φ
H O2 =0.13 isless representative. The figure 6 compares experiments and modelling with the following
parameters set : k*agg=41, kG =3.1410−4s-1 et
1.8
f
D = . So, in this range of water content,
modelling shows that the suspension at the plateau contains yet 50 mass percent crystallized drops, 49% agglomerates (i=3 and i=5) and 1% agglomerates with i>5.
f D 1.6 1.9 2.2 2.5 3 agg k 15 68 480 12000 σ 0.03 0.03 0.036 0.054 Table 1.
deviation parameter for different (Df, kagg)
RESULTS AND DISCUSSIONS
Camargo [7] compares the rheological properties of hydrate suspensions in an asphaltenic crude oil and in a condensate. Two experimental devices are used : a double coaxial cylinders rheometer and a flow loop. Asphaltenic crude oil is an high viscosity fluid compared to the condensate. Camargo shows that the corresponding hydrate suspensions
exhibited shear-thinning behavior and
thixotropy which can be interpreted as the
result of a weak reversible flocculation process between hydrate particles. His modelling uses the following relations :
- between viscosity and effective volume fraction (Eq. 6)
- between effective volume fraction and agglomerate size (Eq. 7)
- between agglomerate size, shear stress and interaction forces [7]
Asphaltene molecules are adsorbed on the surface of hydrates. Then, interaction forces consist of repulsive steric, attractive interchain and bridging forces between asphaltene-covered surfaces. The agglomerate size is coming from a force balance between cohesion strength and shear stress, which is proportional to the shear rate.
Condensate chosen by Camargo is similar to dodecane. The behaviours of emulsion and suspensions (same ranges of temperature and pressure, rheology studied in a flow loop) are very close [6] :
- Newtonian behaviour for emulsions and suspensions
- Same decrease of dynamic viscosity with methane pressure (condensate without water) - Similar effect of water content on dynamic
viscosity for emulsions and suspensions For Camargo, the explanation of the condensate behaviour is different from the one developed for asphaltene crude oil. In the case of condensate, agglomeration occurs during hydrate formation : due to the hydrophilic character of the hydrate surface, it is believed that capillary forces play an important role : there is formation of water bridges between two hydrate particles. Water bridges may be converted into hydrate bridges, resulting in non-reversible agglomeration process. The presence of additive stabilizing the emulsion does not change this behavior. The importance of capillary forces in agglomeration of hydrate particles has been pointed out by Yang et al.[13] by means of simulations by discrete element method.
The qualitative interpretation of Camargo, early suggested by Austvik et al [14] is in total agreement with our experiments and modelling. Most of agglomerates contain less than 20 primary particles. Agglomeration stops rapidly by lack of liquid drops. In fact, it is not correct to consider small agglomerates as fractal-like. However, it is always possible to define the size of porous agglomerates [11] by means of a power law (Eq. 29). The value of the exponent
(Df = 1.8) proves that these small agglomerates are very porous, i.e. with linear or flat shapes. It is remarkable that Yang [13] also found small agglomerates (i< 20) after shear induced agglomeration in the same range of shear rate
(133 s-1 for Yang and 188s-1 for this work).
CONCLUSION
Rheology of gas hydrate-water in dodecane system was examined during crystallization process in a loop gas-lift reactor. Emulsion and suspension are Newtonian fluids. The determining-rate step for crystallisation seems to be the methane transfer from dodecane to water drops. At the same time viscosity increases before reaching a constant value and finally increases again. This behaviour is strongly dependent on the water content. It can be explained by considering a mechanism based on an irreversible three-particles agglomeration. It allows us to understand the occurrence of the plateau on viscosity-time plots. Primary particles of agglomerates are coming from water drops which react with methane to form gas hydrate –water drops (crystallized drops). Modelling shows that the aggregates are very porous and contain a few primary particles. These conclusions are in agreement with results coming from literature. The final increase of suspension viscosity is probably connected to an accumulation of gas hydrate crystals in the bottom of riser. The duration of the viscosity steadiness is a decreasing function of water content ; it is probably linked to the hydrate crystal mass accumulated in the riser
BIBLIOGRAPHY
[1] R.A. Kini, Z. Huo, M.D. Jager, P. Bollavaram, A.L. Ballard, S.F. Dec, , E.D. Sloan, Importance of Hydrate Phase Measurements in Flow Insurance and Energy Storage, Proceedings of the Fourth International Conference of Gas Hydrates, Yokohama, 19-23 May 2002, pp. 867-872 [2] Herri, J.M., F. Gruy, J.S. Pic, Cournil M.,
Methane Hydrate Crystallization
Mechanism from in-situ Particle Sizing, AIChE. J.,1999, 45 (3), 590-602
[3] Pic, J.-S., Herri, J.M, Cournil, M.,
Experimental influence of kinetic
inhibitors on methane hydrate particle size distribution during batch crystallization,
Canadian Journal of Chemical
Engineering, 2001, 79, 374-383
[4] Clarke M.A., Bishnoi, P.R., Determination of the intrinsic kinetics of CO2 gas hydrate formation using in situ particle size analysis, Chemical Engineering Science, 2005, Vol. 60, Pages 695-709
[5] Sinquin, A., Palermo, T., Peysson, Y., Rheological and Flow Properties of Gas Hydrate Suspension, Oil & Gas Science Technology – Rev. IFP, 2004, 59, 41-57 [6] Camargo, R., Propriétés Rhéologiques de
suspensions d’hydrate dans des bruts asphalténiques, P.D. Thesis, 2001, Université Paris VI, France.
[7] Camargo, R., Palermo, T. Rheological Properties of Hydrate Suspensions in an Asphaltenic Crude Oil, Proceedings of the Fourth International Conference of Gas Hydrates, Yokohama, May 19-23 2002, 880-885
[8] Mills, P., Non Newtonian behaviour of flocculated suspensions, Journal de Physique – Lettres, 1985, 46, L301-L309 [9] Thomas, D.G., Transport characteristics of
suspensions : VII. A note on the viscosity of Newtonian suspensions of uniform spherical particles, Journal of Colloid Science, 1965, 20, 267-277
[10] Elimelech, M., Gregory, J., Jia, X., Willimas, R., Particle Deposition and
Aggregation, Butterworth-Heinemann,
Oxford, 1995
[11] Gruy, F. (2001). Formation of small silice aggregates by turbulent aggregation, J. Colloid and Interface Science, 237, 28-39 [12] Gmachovski, L., Hydrodynamics of
aggregated media, J. Colloid and Interface Science, 1996, 178, 80-86
[13] Yang Sung-Oh, Graham Mustoe, Sloan,
A.D., Simulation of Hydrate
Agglomeration by Discrete Element
Method, 15th Symposium on
Thermophysical Properties, June 22-27 2003, Boulder, USA
[14] Austvik, T., Xiaoyun, L., Gjertsen, L.H., Hydrate plug properties : formation and removal of plugs, Annals of the New York Academy of Sciences, 2000, 912, 294-303