UNIVERSITÉ DE MONTRÉAL
DEVELOPMENT OF POLYMER NANOCOMPOSITE FILMS AND THEIR
POTENTIAL FOR PHOTOVOLTAIC CELL APPLICATIONS
AHMAD ZOHRE VAND
DÉPARTEMENT DE GÉNIE CHIMIQUE ÉCOLE POLYTECHNIQUE DE MONTRÉAL
THÈSE PRÉSENTÉE EN VUE DE L’OBTENTION DU DIPLÔME DE PHILOSOPHIAE DOCTOR
(GÉNIE CHIMIQUE) FÉVRIER 2014
UNIVERSITÉ DE MONTRÉAL
ÉCOLE POLYTECHNIQUE DE MONTRÉAL
Cette thèse intitulée:
DEVELOPMENT OF POLYMER NANOCOMPOSITE FILMS AND THEIR POTENTIAL FOR PHOTOVOLTAIC CELL APPLICATIONS
présentée par : ZOHRE VAND Ahmad
en vue de l’obtention du diplôme de : Philosophiae Doctor a été dûment acceptée par le jury d’examen constitué de : M. CARREAU Pierre, Ph. D., président
M. AJJI Abdellah, Ph. D., membre et directeur de recherche M. MIGHRI Frej, Ph. D., membre et codirecteur de recherche Mme HEUZEY Marie-Claude, Ph. D., membre
DEDICATION
they placed in me. Success of this project was impossible without their extensive supports, encouragements, knowledge, and experiences.
A sincere appreciation goes to Professor Pierre J. Carreau, Professor Marie-Claude Heuzey, and all the student members of the Rheology Group who have organized the group meetings and generously shared their knowledge and experiences with me during the productive discussions. I would like to thank all the technical and administrative staffs of Chemical Engineering
Department of Ecole Polytechnique de Montreal, CREPEC, and 3SPack. Specially, I
acknowledge Ms. Mélina Hamdine, Ms. Claire Cerclé, Mr. Guillaume Lessard, and Dr. Babak
Esmaeili for their kind cooperation during my works in different labs.
I am also thankful to Professor Eric David, Mr. Cyril Daran-Daneau, and Mr. Bouchaib Zazoum from CREPEC in ÈTS Montreal for their help in electrical conductivity measurements.
Many thanks to Ms. Sylvie St-Amour and Ms. Sylvie Sauriol from FPInnovations (Pointe-Claire, Canada) for their help in MIP measurements.
My sincere thanks to Professor Oumarou Savadogo, Mr. Ali Seifitokaldani, and Mr. Mohammad
Shahrestani from LANOMAT for their help in photo-electrochemical measurements.
I would like to thank Ms. Marie Matet for her kind help in translating abstract of this thesis from English to French.
I would like to thank all my professors in Amirkabir University of Technology (Polytechnic of Tehran) and Ecole Polytechnique de Montreal who have taught me from basic to advanced levels. I would like to convey my heartfelt thanks to all my friends and colleagues who have supported and helped me during my PhD studies particularly Mr. Ali Seifitokaldani, Mr. Nima Khadem
Mohtaram, Mr. Shahir Karami, Mr. Ali Khadem Mohtaram, Mrs. Hadis Yarahmadi, and Mr. Omid Ebrahimpour.
Definitely, my accomplishments in my studies would not have been possible without unconditional love and support of my beloved family and my lovely wife. My deepest gratitude
goes to my beloved parents, Zahra & Reza, my sisters & brother, and my lovely wife, friend, and classmate, Maryam.
l’environnement nécessite de trouver les nouvelles sources d’énergie. En attendant, le développement de dispositifs rentables et efficaces afin de produire des énergies bon marché, renouvelables et propres est un sujet intéressant qui a retenu l’attention à la fois de la recherche industrielle et de la recherche académique. L’énergie solaire est une des sources d’énergie renouvelable la plus disponible et qui peut être convertie en électricité par l’intermédiaire des cellules solaires. Parmi les différents types de cellules solaires, les cellules solaires à pigments photosensibles (DSSC de l’anglais dye-sensitized solar cell), qui sont des matériels à bas coût, ont un grand potentiel pour produire de l’électricité solaire rentable.
L’objectif de ce travail est de développer une photoélectrode flexible pour DSSC via un procédé rentable de mise en forme d’un polymère à température relativement basse. Des nanocomposites de polypropylène isotactique (iPP) et de dioxyde de titane (TiO2) contenant jusqu’à 15 % volumique (45,5 % massique) de TiO2 ont été produits par plusieurs passages en extrusion bi-vis à l’état fondu. L’effet de la quantité de particules de TiO2 et de la présence de PP modifié par de l’anhydride (AMPP), en tant que compatibilisant, sur la microstructure des nanocomposites a été étudié. Pour une quantité inférieure à 5 % volumique des nanoparticules, la dispersion de ces dernières dans le nanocomposite est améliorée par l’addition du AMPP. Cependant, pour une quantité supérieure à 5 % volumique des nanoparticules, le nombre et la taille des agrégats de TiO2, à la fois dans les nanocomposites compatibilisés ainsi que dans les non-compatibilisés, ont augmenté jusqu’à atteindre un réseau interconnecté de TiO2. Une analyse micromécanique des nanocomposites a montré que la résistance interfaciale entre la matrice polymérique et les particules de TiO2 était plus grande dans le système compatibilisé que dans le système non-compatibilisé.
Puisque la conductivité électrique des nanocomposites iPP/TiO2 est une propriété importante exigée pour l’utilisation dans la photoélectrode, la corrélation entre la microstructure et la conductivité électrique des nanocomposites iPP/TiO2 a été étudiée dans la partie suivante de cette recherche. Des mesures en courant continu (DC) de la conductivité électrique ont montré que les échantillons non-compatibilisés avaient un seuil de percolation électrique inférieur aux
échantillons compatibilisés. De plus, les propriétés rhéologiques des nanocomposites ont conclu à un seuil de percolation rhéologique plus faible pour les systèmes non-compatibilisés, ce qui est en accordance avec les propriétés électriques. Quantitativement, les seuils de percolation rhéologique (5-7 % en volume) des nanocomposites compatibilisés ou non étaient inférieurs aux seuils de percolation électrique (5,3-7,5 % en volume). Il a été montré que le seuil de percolation élevé des nanocomposites compatibilisés a été obtenu grâce à une meilleure dispersion des nanoparticules de TiO2 en comparaison avec les systèmes non-compatibilisés. Cependant, en raison de la séparation des phases partielles de l’iPP et de l’AMPP et de la viscosité inférieure de la matrice polymérique dans le cas des nanocomposites compatibilisés contenant au minimum 7,5 % en volume de TiO2, les agrégats de TiO2 étaient plus denses dans ces systèmes que dans les nanocomposites non-compatibilisés. Des mesures rhéologiques non-linéaires ont aussi été effectuées afin d’étudier la microstructure des nanocomposites en-dessous et au-dessus de leur seuil de percolation. Des analyses échelonnées de tests de balayage en déformation ont montré une dimension fractale plus grande pour les systèmes compatibilisés que pour ceux non-compatibilisés, en concordance avec les observations morphologiques.
Après avoir déterminé les caractéristiques morphologiques, électriques et rhéologiques des nanocomposites à base de iPP et TiO2 pour différentes compositions, des films nanocomposites basés sur les échantillons se situant au-dessus du seuil de percolation ont été préparés par extrusion de film. Ils ont été uniaxialement étirés pour préparer des films nanocomposites poreux. Les effets de la composition et des différents paramètres d’étirage pendant le procédé, comme la température d’étirage, le taux d’extension et le rapport d’étirage, sur la microstructure finale et les propriétés des films étirés ont été étudiés. Les observations au microscope électronique à balayage (MEB) ont montré que les pores été formés à cause du décollement interfacial entre le PP et les particules de TiO2. La porosité et la taille des pores augmentent lorsque la température d’étirage diminue et lorsque le rapport d’étirage augmente. La surface des pores augmente avec la porosité, fournissant une surface plus grande pour l’adsorption d’un colorant photosensible.
Finalement, la fonctionnalité des films nanocomposites poreux comme électrodes pour DSSC a été examinée. Les films ont été sensibilisés avec un colorant inorganique (N719) et utilisés comme photoélectrode dans une structure sandwich DSSC. Les propriétés photo-électrochimiques des cellules ont été analysées par photocourant-tension (J-V) et par spectroscopie d’impédance électrochimique (SIE). Le photocourant de court-circuit (JSC) ainsi
ABSTRACT
High demand for energy due to continuous growth of population, rapid industrial development, depletion of conventional sources of energy, and their environmental impacts necessitate finding new sources of energy. Meanwhile, developing cost-effective and efficient devices to produce cheap, renewable, and clean energies is an interesting topic which has attracted great attention from both industrial and academic researchers. Solar energy is one of the most available sources of renewable energies that can be converted to electricity by solar cell. Among different types of solar cells, Die-Sensitized Solar Cell (DSSC), which consists of low cost materials, has a great potential to produce cost effective solar electricity.
The objective of this work is to develop a flexible photoelectrode for DSSC via a cost-effective polymer processing method at relatively low temperatures. Nanocomposites of isotactic polypropylene (iPP) and titanium dioxide (TiO2) containing up to 15 vol% (45.5 wt%) of TiO2 were prepared by multi-pass melt twin-screw extrusion process. Effect of TiO2 nanoparticle content and presence of anhydride modified PP (AMPP), as a compatibilizer, on microstructure of the nanocomposites were investigated. Adding AMPP improved dispersion of the nanoparticles at volume contents less than 5 vol%. However, number and size of TiO2 aggregates in both compatibilized and uncompatibilized nanocomposites containing more than 5 vol% of TiO2 increased enough to result in an interconnected network of TiO2. A micromechanical analysis on the nanocomposites showed that interfacial strength between polymer matrix and TiO2 nanoparticles in the compatibilized nanocomposites were stronger than in the uncompatibilized nanocomposites.
Since electrical conductivity of the iPP/TiO2 nanocomposites is an important property required for the photoelectrode application, correlation between microstructure and electrical conductivity of the iPP/TiO2 nanocomposites were studied in the other part of this research. DC electrical conductivity measurements showed lower electrical percolation threshold for the uncompatibilized samples compared to the compatibilized ones. In additional, rheological properties of the nanocomposites resulted in lower rheological percolation threshold for the uncompatibilized system. It was in a qualitative agreement with the results of electrical properties. Quantitatively, rheological percolation thresholds (5-7 vol%) of both uncompatibilized and compatibilized nanocomposites were lower than the electrical percolation
uncompatibilized nanocomposites. It was due to partial phase separation of iPP and AMPP and lower viscosity of the polymer matrices of the nanocomposites. Nonlinear rheological measurements were also performed to investigate microstructure of the nanocomposites below and over their percolation thresholds. Scaling analysis of strain sweep tests resulted in larger fractal dimension for the compatibilized samples confirming the morphological observations.
After identifying morphological, electrical, and rheological characteristics of the iPP/TiO2 nanocomposites with different compositions, nanocomposite films based on the samples above the percolation threshold were prepared by film extrusion. They were uniaxially stretched to prepare porous nanocomposite films. Effects of composition and different stretching process parameters such as drawing temperature, extension rate, and stretching ratio on the final microstructure and properties of the stretched films were studied. SEM observation showed that the pores were formed due to interfacial debonding between PP and TiO2. Porosity and average pore size increased by decreasing drawing temperature and increasing stretching ratio. Pore surface area increased with porosity, providing larger area for adsorption of a photosensitive dye.
Finally, functionality of the porous nanocomposite films as photoelectrodes for DSSC was examined. The films were sensitized with an inorganic dye (N719) and used as a photoelectrode in a sandwich-like DSSC. Photo-electrochemical properties of the cells were analyzed by photocurrent-voltage (J-V) and electrochemical impedance spectroscopy (EIS). Both short circuit photocurrent (Jsc) and open circuit voltage (Voc) increased with stretching ratio of the nanocomposite films. Jsc and Voc of the DSSC based on 200 % stretched nanocomposite films were around 0.7 μA/cm2 and 126 mV respectively and, fill factor (FF) of the system was around 32 %.
TABLE OF CONTENTS
DEDICATION ... III ACKNOWLEDGMENTS ... IV RÉSUMÉ ... VI ABSTRACT ... IX TABLE OF CONTENTS ... XI LIST OF FIGURES ... XVIIIINTRODUCTION ... 1
CHAPTER 1 LITERATURE REVIEW ... 3
1.1 Introduction to Photovoltaic and Solar Cell Technology ... 3
1.1.1 General Structure of Solar cells ... 4
1.1.2 Different Types of Solar Cells ... 5
1.1.2.5.1 Operational principles ... 8
1.1.2.5.2 Fabrication ... 9
1.1.2.5.3 Morphology ... 9
1.1.2.5.4 Important Components of DSSCs ... 10
1.1.2.5.5 Electrodes on Plastic Substrates for DSSC ... 12
1.2 Conductive Porous Polymer Film ... 16
1.2.1 Stretching Filled Composites ... 18
1.2.2 Dispersed Phase Extraction ... 19
1.3 Alternative Approach for the Porous Electrode of DSSCs ... 21
1.4 Filled Membranes ... 22
1.4.1 Pore Formation ... 22
1.5 Melt-Blended Thermoplastic/Titanium Dioxide Nanocomposites ... 28
1.5.1 Dispersion Mechanisms of Titanium Dioxide in Polymer Melts ... 31
1.5.2 Processing Conditions ... 31
1.5.3 Compatibilizers and Surface Treatments ... 34
1.5.4 Concentrated nanocomposites ... 38
1.5.5 Rheology of Polymer/TiO2 Micro- and Nano-Composite ... 40
1.6 Electrical Properties of TiO2 Filled Composites ... 43
1.7 Stretching the nanocomposites ... 44
1.8 Problem Identification and Originality of the Work ... 46
1.9 Objectives ... 46
CHAPTER 2 ORGANIZATION OF ARTICLES AND THESIS STRUCTURE ... 48
CHAPTER 3 ARTICLE 1: MORPHOLOGY AND PROPERTIES OF HIGHLY FILLED IPP/TIO2 NANOCOMPOSITES ... 50
3.1 Introduction ... 52
3.2 Experimental ... 55
3.2.1 Materials ... 55
3.2.2 Nanocomposite preparation by twin-screw extrusion process ... 55
3.2.3 Sample Characterization ... 57
3.3 Results and Discussion ... 59
3.3.1 Dispersion Characterization in Uncompatibilized and Compatibilized Nanocomposites ... 59
3.3.2 Thermal Characterization of Compatibilized and Uncompatibilized Nanocomposites .
... 61
3.3.3 Crystalline Structure of PP/TiO2 Nanocomposites ... 63
3.3.4 Mechanical Characterization of Uncompatibilized and Compatibilized Nanocomposites ... 74
3.4 Conclusion ... 76
3.5 References ... 78
3.6 Supporting Information ... 82
3.6.1 DSC Thermograms of the Second Heating Run ... 82
3.6.2 Schematic showing how to determine different parameter used in Equations 3.3-3.5: . ... 82
CHAPTER 4 ARTICLE 2: RELATIONSHIP BETWEEN RHEOLOGICAL AND ELECTRICAL PERCOLATION IN A POLYMER NANOCOMPOSITE WITH SEMICONDUCTOR INCLUSIONS ... 84 4.1 Introduction ... 86 4.2 Experimental ... 91 4.2.1 Materials ... 91 4.2.2 Sample Preparation ... 92 4.2.3 Morphological Characterization ... 94 4.2.4 Rheological Measurements ... 94
4.2.5 Electrical Resistivity Measurements ... 95
4.3 Results and Discussion ... 95
4.3.1 Electrical Properties ... 95
4.3.2 Morphology ... 99
CHAPTER 5 ARTICLE 3: MICROSTRUCTURE AND PROPERTIES OF POROUS NANOCOMPOSITE FILMS: EFFECTS OF COMPOSITION AND PROCESS PARAMETERS
... 133
5.1 INTRODUCTION ... 135
5.2 EXPERIMENTAL ... 137
5.2.1 Materials ... 137
5.2.2 Preparation of base nanocomposite films by twin-screw extrusion process ... 138
5.2.3 Post extrusion stretching and porous film preparation ... 140
5.2.4 Nanocomposite Sample Characterization ... 140
5.3 Results and Discussion ... 142
5.3.1 Particle Size and Particle Size Distribution ... 142
5.3.2 Dispersion of the Nanoparticles in the Base Films ... 143
5.3.3 Effect of drawing temperature and extension rate ... 144
5.3.4 Effect of draw ratio ... 150
5.3.5 Effect of TiO2 content and compatibilizer ... 154
5.3.6 Dye adsorption ... 156
5.4 CONCLUSION ... 157
5.5 REFERENCES ... 158
CHAPTER 6 ARTICLE 4: DEVELOPMENT OF POROUS POLYMER NANOCOMPOSITE FILM BASED FLEXIBLE PHOTOELECTRODE FOR DYE-SENSITIZED SOLAR CELL ... 161
6.2 Experimental ... 164
6.2.1 Materials ... 164
6.2.2 Preparation of the Porous PP/TiO2 Nanocomposite Films ... 164
6.2.3 Characterization of the Porous Nanocomposite ... 165
6.2.4 DSSC Fabrication ... 165
6.2.5 Photovoltaic Cell Measurements ... 165
6.3 Results and Discussion ... 165
6.4 Conclusions ... 169
6.5 References ... 169
CHAPTER 7 GENERAL DISCUSSION ... 171
CONCLUSION AND RECOMMENDATIONS ... 175
7.1 Conclusion ... 175
7.2 Recommendations ... 177
Table 1.2: Dye content and photocurrents from electrospun cells corrected for light scattering
[34] ... 15
Table 1.3: Important typical features of a TiO2 photoelectrode of a DSSC [2, 14] ... 17
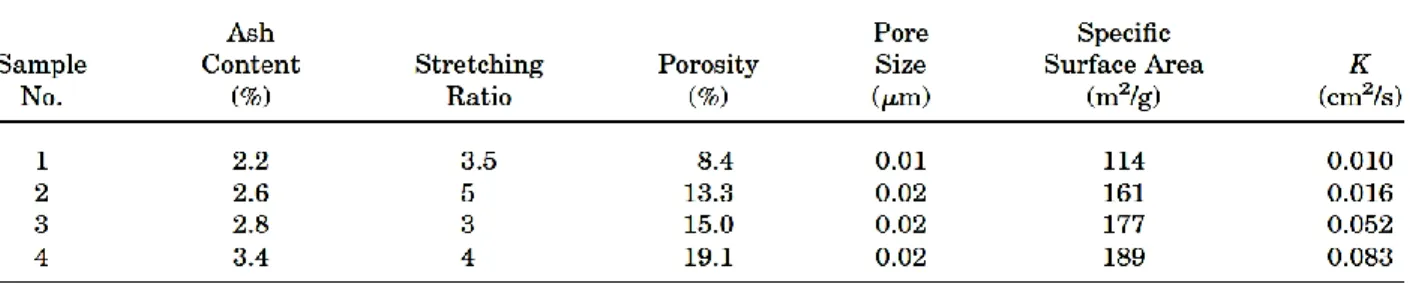
Table 1.4: Effect of the ash content on the structure of microporous PP film ... 26
Table 1.5: Summary of the recent works on melt-processed polymer/TiO2 micro- and nano-composites ... 29
Table 1.6: Effect of surfactants on anatase 15 nm TiO2 agglomerate size [64] ... 36
Table 3.1: Main characteristics of the resins ... 55
Table 3.2: Composition of the prepared PP/TiO2 nanocomposites ... 58
Table 3.3: Summary of DSC characterization results ... 66
Table 3.4: Summary of DSC characterization results and the values calculated using Eqs. 1-5 for the samples PP-T-1 and PP-AM-T-1 ... 69
Table 3.5: β-form index (K value) and crystalline contents (XXRD) of the uncompatibilized nanocomposites and PP-AM-T-1 sample calculated based on XRD results ... 72
Table 4.1: Characteristics of the polymeric materials ... 91
Table 4.2: Compositions of the samples in solid and melt states ... 93
Table 4.3: Slope of rheological properties (Figure 4-7) at low frequencies and 0* from Equation 4.6 ... 107
Table 4.4: Angular frequencies and values of the cross-over points where Gʹ = G″ ... 109
Table 4.5: Rheological percolation thresholds and fitting parameters of Eq. 4.7 based on the values of different rheological properties ... 113
Table 4.6: Key characteristics of the neat polymers and the nanocomposite samples obtained from strain sweep tests at ω = 1 rad/s and the elastic characteristic time λ ... 115
Table 4.7: Values of complex viscosity (η*) and η* ω for the neat polymers and polymer matrices of different compatibilized samples at 205 °C and ω = 58 rad/s ... 120 Table 5.1: Main characteristics of the resins ... 137 Table 5.2. Composition of the nanocomposite samples ... 140 Table 5.3: Summary of pore size distribution obtained from MIP measurement for PPT125
Figure 1-3: Illustration of the photoinduced charge transfer with (b) a sketch of the energy level. After excitation in PPV polymer as an organic semiconductor, the electron is transferred to fullerene (C60) [8] ... 7 Figure 1-4: Schematic drawing of principal operation of DSSC [13] ... 8 Figure 1-5: Schematic construction of a DSSC [15, 17] ... 10 Figure 1-6: (a) Three-dimensional surface image and (b) cross-sectional SEM image of a TiO2
film coated on a conducting glass [19], (c) scanning electron micrograph of the surface of a mesoporous anatase film prepared from a hydrothermally processed TiO2 colloid [20] ... 10 Figure 1-7: Schematic mechanism and molecular structure of Ruthenium-based dyes [13] ... 11 Figure 1-8: Molecular structure of coumarin derivative dyes and their absorption spectrum [25] 12 Figure 1-9: Cross sectional SEM pictures of TiO2 samples sintered at (A) 100 (B) 450 °C and (C)
comparison of IPCE of sintered at 100 °C (▼) and 450 °C (●) [27] ... 13 Figure 1-10: I-V characteristics for dye-sensitized solar cells fabricated with a laser-sintered TiO2
(-□-), a non-laser-sintered TiO2 electrode (control cell) (-▲-), and a high-temperature-sintered TiO2 electrode (standard cell) (-●-) [32] ... 14 Figure 1-11: (a) Photocurrent response for sample 3, representative of all electro spun cells, (b)
photocurrent response for a representative of all spin-coated cells [34] ... 15 Figure 1-12: SEM images from cross-section of TiO2/PMMA composite film with different
PMMA concentrations; (a) 0 wt%, (b) 1 wt% and (c) 5 wt%, where the scale bar denotes a length of 100 nm [36] ... 16 Figure 1-13: (a) Spray-assisted electrospinning system. SEM images of (b) as-spun PVDF
nanofibers, (c) as-prepared PVDF/TiO2 composite film, and (d) cross section of a compressed PVDF/TiO2 composite film, that is, of the fiber-reinforced composite structure ... 17
Figure 1-14: Apparent viscosity as a function of shear rate for PP/CB/GR blends at 230°C (a) CB/GR 70/30 wt%, (b) CB/GR 50/50 and 70/30 wt% [38] ... 19 Figure 1-15: TEM of films made from 50 wt-% PP/25 wt-% CB/25 wt-% GR blend. (a) before
stretching and (b) after stretching [38] ... 19 Figure 1-16: Schematic representation of microcracks upon stretching. (a) PP/CB/GR
morphology before stretching; (b) initiation of microcraks upon stretching at room temperature; (c) growth of microcracks upon stretching at elevated temperature (≈160 °C) [38] ... 20 Figure 1-17: In-plane and through-plane film resistivities and their corresponding blend
viscosities (at a shear rate of 500 s-1 and T=230 °C) as a function of CB/GR phase concentration [40] ... 20 Figure 1-18: Resistivity and BET surface area of porous uncompressed films as a function of
initial PS concentration [40] ... 21 Figure 1-19: Schematic diagram of formulation and processing of microporous polypropylene
sheets containing CaCO3 [43] ... 22 Figure 1-20: (a) Schematic structure of microporous sheet [43], (b) schematic mechanism of
micropore formation [44] ... 23 Figure 1-21: SEM micrograph of PP sheets containing CaCO3 (0.08 μm); (a) surface after
stretching in MD, (b) cross section after stretching in MD [46], (c) surface after biaxial stretching and (d) cross section after biaxial stretching [43] ... 24 Figure 1-22: (a) relationship of permeability coefficient (K0) to the mean particle size of fillers;
(b) dependence of effective porosity (ε/q2) and tortuosity factor (q) on mean particle size of fillers [43] ... 25 Figure 1-23: (a) Relations between filler content and Dmax. Stretching temperature, 110 (MD) and
140 °C (TD). Stretching degree, 250 % in MD and 160 % in TD. Filler: ○, CaCO3; □, SiO2; ∆, diatomaceous SiO2. (b) Pore size distribution of biaxially stretched microporous PP sheets containing CaCO3 with different mean particle size; 1) 3.0, 2) 1.7, 3) 0.8 and 4) 0.08 μm [44] ... 25
treatment [46] ... 27 Figure 1-26: Structural models for high- and low-porosity TiO2 agglomerates [66] ... 32 Figure 1-27: Mechanical properties of PP/TiO2 (130 nm) at various concentration and different
screw speeds of mixing; (a) tensile strength, (b) Young’s modulus and (c) stress at break [51] ... 32 Figure 1-28: Screw configuration used during melt compounding (FF= forward feed, RF= reverse
flight, CK= cross kneader, FK= forward kneader, BK= back kneader, PK= paddle kneader) [64] ... 33 Figure 1-29: Polystyrene/anatase 15 nm TiO2 processed using the high shear configuration
without the reverse flight element taken at different locations [64] ... 34 Figure 1-30: Change of microhardness at various concentrations of filler for both EM and ECM
samples [52] ... 34 Figure 1-31: SEM micrographs of PBT/TiO2 containing; (a) pristine and (b) the titante surface
modified particles [50] ... 35 Figure 1-32: Possible chemical reactions between PP, PP-g-MAH, PA6 and TDI-functionalized
TiO2 nanoparticles [68] ... 37 Figure 1-33: Possible chemical reactions between (a) PET and coated TiO2 nanoparticles, (b) PP-g-MA and coated TiO2 nanoparticles [70] ... 37 Figure 1-34: TEM images of PET(dispersed)/PP(continuous)/TiO2(2 %wt) nanocomposites; (a)
without PP-g-MAH, with (b) 3 %wt and (c) 6 %wt PP-g-MAH [70] ... 38 Figure 1-35: SEM images of PMMA-TiO2 nano-composites and PMMA/TiO2 (15 %wt) micro-composite (scale bar is 2 μm) [57] ... 39
Figure 1-36: Shear viscosity as a function of real shear rate of the neat iPP melt and the iPP melt that had been filled with various contents of (a) uncoated, (b) SiO2-coated, and (c) stearic-coated TiO2 nanoparticles (i.e., CYU201, CYU202, and CYU203, respectively) [59] ... 39 Figure 1-37: Stress relaxation moduli of PP45Micro (diamond), PP45Nano before (triangle) and
after (circles) a two-hours thermal annealing, and neat polymer (solid line) [63] ... 40 Figure 1-38: TEM images of the PP/TiO2 nanocomposite before (a) and after (b) the annealing
[63] ... 41 Figure 1-39: Time-dependant behavior of L071L and L0009 with 70 wt % contents [65] ... 42 Figure 1-40: Effect of TiO2 content on the time-dependent behavior [65] ... 42 Figure 1-41: Variations of rheological properties of PP/CaCO3 microcomposite with time
measured at 200°C (0.01 Hz) [72] ... 43 Figure 1-42: Variation of electrical resistivity with filler content at different temperatures: (a) 25
°C, (b) 50 °C, (c) 75 °C and (d) 100 °C [52] ... 44 Figure 1-43: Schematic representation of (a) slightly drawn PET/PP/TiO2 and (b) PET/PP/TiO2
drawn strand [69] ... 45 Figure 1-44: SEM images of drawn strands and slightly drawn extrudates: (a) PET/PP/2T300
drawn atrand, (b) PET/PP/C/2T300 slightly drawn extrudate, (c) PET/PP/C/2T300 drawn strand, (d) PET/PP/2T15 drawn strand, (e) PET/PP/2T15 drawn strand at low magnification [69] ... 45 Figure 3-1: TEM image of the used TiO2 nanoparticles ... 56 Figure 3-2: Schematic view of the screw configuration and the temperature profile used in the
compounding process (GFA: co-rotating conveying free-meshing elements, KB: kneading blocks) ... 57 Figure 3-3: SEM micrographs of uncompatibilized (PP-T) and compatibilized (PP-AM-T)
nanocomposite samples containing 3 and 5 vol% of TiO2: (a) PP-T-3, (b) PP-AM-T-3, (c) PP-T-5, and (d) PP-AM-T-5 ... 60 Figure 3-4: TGA graphs of uncompatibilized nanocomposites under (a) oxidative atmosphere and
Figure 3-7: DSC thermograms of uncompatibilized (PP-T) and compatibilized (PP-AM-T) nanocomposites recorded during first heating (a),(c) and cooling (b),(d) ... 65 Figure 3-8: XRD patterns of the TiO2 nanoparticle, the neat PP and PP-T nanocomposites with 1,
3 and 5 vol% of TiO2 nanoparticles. ... 71 Figure 3-9: Mechanical properties of the nanocomposites; (a) Young’s modulus E, (b) Tensile
strain at break b, (c) Tensile stress at yield σy (inset: representative tensile stress-strain curve of PP-T samples) and (d) results of ln (σyc/ σyp)+ ln[(1+2.5f)/(1-f)] versus f .... 74 Figure 3-10: DSC thermograms of the uncompatibilized (PP-T) and the compatibilized (PP-AM-T) nanocomposites recorded during the second heating ... 82 Figure 3-11: Melting curve of PP-T-1, recorded in the first heating run of DSC, to illustrate the
method of determination of the different parameters, used in Eqs. 3-5, to calculate enthalpy of fusion for α- and β-phase of the samples. ... 83 Figure 4-1: TEM image of the TiO2 nanoparticles used in this work ... 92 Figure 4-2: (a) Variation of electrical current with time through PPT5; after applying different
voltages, (Ich), after cessation of the voltages (Idch), and the neat current (Ich-Idch), (b) variation of the neat current with time in the neat polymers, the uncompatibilized samples containing different TiO2 contents, and undried PPT10 ... 96 Figure 4-3: Electrical conductivity as a function of TiO2 content. The lines are the best fits using
Equation 4.5 ... 98 Figure 4-4: (a) SEM and (b) AFM images of PPT1, (c) SEM and (d) AFM images of PPAMT1.
AFM images show higher magnification. Arrows indicate the TiO2 nanoparticles ... 100 Figure 4-5: SEM micrographs of the nanocomposite samples containing different TiO2 contents:
Figure 4-6: Results of image analysis of SEM micrographs (Figures 4-4 and 4-5) in the format of; (a) number fraction of the aggregate with a given range surface area, and (b) contribution to total area ... 104 Figure 4-7: Complex viscosity (η*) and elastic modulus (Gꞌ) versus angular frequency of the
nanocomposites samples: (a), (c) PPT, and PPAMT (b), (d). Insets in (c) and (d) show variation normalized values of Gꞌ and η* (Gꞌ/ Gꞌt=0 and η*/ η*t=0) during the time sweep tests for the neat PP and the nanocomposites containing 4 and 7.5 vol% of TiO2 ... 105 Figure 4-8: Variation of elastic modulus with nanoparticle content at different frequencies for (a)
uncompatibilized and (b) compatibilized samples ... 108 Figure 4-9: Cole-Cole diagrams of the samples with TiO2 content of 4 ≤ ϕ ≤ 7.5 vol% ... 109 Figure 4-10: tan versus angular frequency for the samples containing 4-7.5 vol% of TiO2 ... 110 Figure 4-11: Plots of η* versus G* for the samples undergoing liquid-solid transition ... 111 Figure 4-12: Reduced values of (a) η* and (b) Gʹ, as functions of TiO2 content. The lines are the
best fits using Equation 4.7 ... 113 Figure 4-13: (a) variation of Gʹ versus strain amplitude for neat PP and PPT samples at ω = 1
rad/s, (b) normalized values of Gʹ to value of elastic modulus at the linear plateau (Gʹ/Gʹp) ... 114 Figure 4-14: (a) critical strain as a function of TiO2 volume fraction lower than the percolation
thresholds of the samples. The lines are the best fits using Equation 4.8. (b) Variation of critical strain and elastic modulus at plateau with TiO2 contents above the percolation threshold. The lines are results of fitting using Equation 4.2 and 4.3 ... 117 Figure 4-15: Experimental values of Gʹ at ω = 0.126 rad/s (circles) for PPT nanocomposites and
the best fit using the combination of Eq. 4.9 and Eq. 4.10 (dashed line) ... 119 Figure 4-16: AFM images of the PP/AMPP blends with the same composition as in the matrices
of the compatibilized nanocomposite samples; (a) PPAMT3, (b) PPAMT5, (c) PPAMT10, and (d) PPAMT10 (lower magnification) ... 122 Figure 4-17: Schematic illustration of nanoparticle distribution in the PPT and PPAMT
Figure 5-2: TEM micrographs of the TiO2 nanoparticles used in this work (Inset: Particle size distribution of an aqueous dispersion of the TiO2 nanoparticle) ... 138 Figure 5-3: Schematic view of the screw configuration and the temperature profile used in the
compounding process (GFA: co-rotating conveying free-meshing elements, KB: kneading blocks) ... 139 Figure 5-4: SEM micrographs from cross-section of the base nanocomposite film samples
containing different TiO2 contents and AMPP as the compatibilizer: (a) PPT10, (b) PPT125, and (c) PPAMT125 in two magnifications ... 144 Figure 5-5: Variation of BET surface area (left axis) and the apparent porosity Pa (right axis) with
stretching temperature for the porous films based on PPT125 for a draw ratio of 100 % stretched at 200 mm/min ... 145 Figure 5-6: Water vapor transmission rate (WVTR) versus extension rate of 100% stretched for
PPT125 nanocomposite films at different stretching temperatures ... 146 Figure 5-7: SEM images from cross-section and surface of the PPT125 film samples stretch up to
100 % at 200 mm/min and different stretching temperatures (a) 60, (b) 90, and (c) 120 °C (images number 1 are from cross-section and number 2 are from surface of the samples) . 147 Figure 5-8: Pore size distribution of the samples stretched at different stretching temperatures
(PPT125, 200 mm/min, 100 %) obtained from the MIP measurements ... 148 Figure 5-9: (a) stress-strain curves recorded during stretching at 200 mm/min and different
stretching temperatures, (b) storage modulus Eꞌ and tan δ versus temperature for neat PP 150 Figure 5-10: Water vapor transmission rate (WVTR) versus draw ratio for 100% stretched
PPT125 nanocomposite films at 60 °C and different extension rates ... 151 Figure 5-11: SEM images from surface of the PPT125 film samples stretched at 60 °C and 200
image of the samples stretched at 60 °C and 200 mm/min with different draw ratios (d) 50, (e) 100, and (f) 200 % ... 152 Figure 5-12: Variation of BET surface area (left axis) and the apparent porosity Pa (right axis)
with draw ratio for the porous films based on PPT125 at stretching temperature of 60 °C stretched at 200 mm/min ... 153 Figure 5-13: Pore size distribution of the samples stretched at different draw ratio (PPT125, 200
mm/min, 60 °C) obtained from the MIP measurements ... 154 Figure 5-14: Comparison of WVTR in the porous film based on the uncompatibilized
nanocomposite films PPT10, PPT125 with different TiO2 contents, and the compatibilized nanocomposite film PPAMT125 containing AMPP and 12.5 %Vol. of TiO2 (All the samples were stretched to draw ratio of 100 % at 60 °C) ... 155 Figure 5-15: SEM images from cross-section of PPAMT125 film samples stretched at 60 °C and
200 mm/min 100 % ... 156 Figure 5-16: UV-Vis spectrums of the desorbed dye from stretched nanocomposite to 0.1 N
solution of NaOH ... 157 Figure 6-1: SEM image from cross section of the uniaxially stretched porous nanocomposite
films up to; (a) 50%, (b) 100% and (c) 200% ... 166 Figure 6-2: Pore size distribution for porous nanocomposites stretched to 100% and 200%. The
inset shows BET surface area of the samples versus stretching ratio ... 167 Figure 6-3: UV-Vis spectrum of the desorbed dye from the porous nanocomposites with different
stretch ratio. The inset shows a typical absorption spectrum and chemical structure of N719 dye) ... 168 Figure 6-4: Photocurrent-voltage curves of the DSSC based on the nanocomposite
a sustainable development, it is necessary to use renewable energies. Solar energy is one the most interesting type of the renewable energies that is widely available all over the world. Developing efficient and cost-effective solar cells is one of the most important topics in solar technology. Meanwhile, making light and flexible solar cells is an interesting way to increase applications of solar cells on different surfaces of buildings and vehicles.
Among different types of solar cells, die-sensitized solar cell (DSSC) which is composed of cheap materials has a great potential for being manufactured in large scale. However, there is a high-temperature (>450 °C) sintering process in making photoelectrode of DSSC from titanium dioxide (TiO2). In order to make flexible DSSCs, it is needed to find a method to make the photoelectrode at a suitable temperature that does not damage the plastic substrates.
The main objective of this Ph.D. dissertation is to develop a novel method for making flexible photoelectrode of DSSC. To achieve this objective, an approach based on making nanocomposites via polymer melt processing method was used. One of the most important microstructure characteristics of the nanocomposites is presence of an interconnected network of TiO2 nanoparticles through the blend of polymer and TiO2. Moreover, porosity of the film is another important requirement of the photoelectrode of DSSC.
In the first part of this project, polymer nanocomposites based on polypropylene (PP) and TiO2 with different concentration were prepared and, evolution of their microstructure and properties were studied. Effect of adding anhydride-modified PP (AMPP), as a macromolecular compatibilizer, on dispersion and electrical properties of the nanocomposites was investigated. In the other part of the work, rheology was utilized as a tool to study the microstructure of the nanocomposites and, attempts were made to compare electrical percolation threshold with rheological percolation threshold. Porous nanocomposite films were prepared by stretching nanocomposite film and, effect of different process conditions on microstructure of the porous film were examined. At the last part, functionality of the porous nanocomposite films as photoelectrodes of DSSC was analyzed.
Accordingly, this Ph.D. thesis consists of the following sections:
Chapter 1: A literature review which summarize main points about photovoltaic properties, different type of solar cell and, specially, DSSCs. It also presents a summary about thermoplastic nanocomposites containing TiO2 particles and developing porous film by stretching filled polymer films.
Chapter 2: is on organization of the articles.
Chapter 3, 4, 5, and 6: are presenting main findings of this project in the format of four journal articles.
Chapter 7: is on general conclusions and recommendations
Importance of energy in the life of human being is completely obvious. Extraordinary consumption of conventional sources of energy, such as coal, oil and natural gas, has led to depletion of the fossil energy sources and also environmental pollutions. Large demands of energy, limitation in the sources, and environmental considerations force all the stakeholders (companies, government, etc.) to find renewable and clean alternatives [1, 2]. Figure 1-1 depicts a perspective of the growth in using renewable energies in next 25 years in comparison with other kinds of energies. Table 1.1 reports that electricity generation from solar sources has the highest average annual percent change in the next 25 years compared to the other types of renewable electricity.
The sun provides a continuous energy current around 1.7×10¹⁷ W (1.5×10¹⁸ kWh/year) which is four order of magnitude larger than the current annual global energy consumption (1014 kWh/year) [3]. Therefore, different aspects of energy production from sun light has attracted
Table 1.1: World net renewable electricity generation by energy source, 2010-2040 (billion kilowatthours) [4]
great attention of scientific and governmental research centers [5]. One of the most important sectors of this research area is focused on producing electricity from sun light energy using solar cells. Solar cells or photovoltaic (PV) cells are devices which convert sunlight to electricity by means of photoelectric effect [6].
1.1.1 General Structure of Solar cells
Mostly, solar cells are made from semiconductor materials. In a crystal structure of an atom, different energy levels of electrons form a continuous energy band. The energy difference between the lower band, valence, and upper band, conduction, is called band gap, Eg, which is an important parameter in a semiconductor. Semiconductor materials have a band gap between 0.5-3 eV [2]. There are organic and inorganic semiconductors, e.g. Silicon (Si) and Germanium (Ge) are two widely used inorganic semiconductors [1].
The energy of a photon is
hc h h
E (1.1)
where h andh are Planck’s constant and Diarc constant (h h 2 ), ν, c, ω and λ are frequency, speed, angular frequency and wavelength of the light, respectively. Average energy of solar photons is about 1.35 eV [1].
When a photon of the light is absorbed by a photosensitive (semiconductor) material, its energy overcomes the band gap energy, excites an electron from the highest occupied molecular
type layer) and works as a hole carrier, while the later one works as electron carrier and has negative charge (n-type) [8].
Conversion of light into electricity can be summarized in the following steps [8]: I. Photon absorption,
II. Exciton formation,
III. Exciton diffusion to the interface, IV. Charge separation,
V. Charge transport to the electrodes.
Limitations and losses in each one of these steps result in reduction of cell performance.
In a general view, the basic structure and common parts of the solar cells can be explained by four main parts: two metallic electrodes and a layer composed of the photosensitive material (consist of two main sub-layers) enclosed between the electrodes. All of these parts are supported by a substrate, usually glass or plastics (see Figure 1-2). Practically, based on components of the active layer and its fabrication method, thickness of the layers varies and, some other (sub) layers are added to the system.
1.1.2 Different Types of Solar Cells
There are different methods of classification of the photovoltaic cells based on their semiconductor materials, morphology and fabrication technique.
1.1.2.1 Silicon-based Solar Cells
The most produced semiconductor-based solar cells are made from crystalline silicon (c-Si) (Eg=1.1 eV). The initial models are self-supporting films with a typical thickness around 200-300
Figure 1-2: General view of a (heterojunction) solar cell
μm [2]. Because there is just one type of semiconductor material (Silicon with p and n doping), they are homojunction solar cells [5].
1.1.2.2 Thin Film Solar Cells
Reducing consumption of the expensive materials and developing an energy-efficient way led to development of thin film solar cells. For example, low temperature deposition of silicon from SiH4 gas results in a thin film silicon solar cell that has a great potential to capture a large market of PV cells. These thin films are usually supported by a cheap substrate such as glass, steel or plastic. It is also possible to use different structures of silicon (e.g. amorphous, microcrystalline and single crystal) with different band gaps by thin film technology to make a wide range of light absorption [2]. The thickness range of such a film layer varies from a few nanometers to tens of micrometers.
1.1.2.3 Heterojunction Solar Cells
Thin film technology makes it possible to use different semiconductors, with different band gap energies, in the form of thin layer structures [2, 9]. Photovoltaic devices based on cadmium sulfide (CdS), copper indium diselenide (CuInSe2 or CIS) and cadmium telluride (CdTe) are
1.1.2.4 Organic Solar Cells
Due to presence of highly polarizable π-systems, conjugated polymers which have carbon-carbon double-bound in their molecular structure backbone, are electrically active (see Figure 1-3). Hybridization of the orbital and π-π* optical transition take place in the visible region of light spectral [7]. Hence, materials which have delocalized π electron systems can absorb energy of sunlight photons, create photogenerated charge carriers and transport the charges. Generally, organic semiconductors have wide band gap (~1.4 eV) [2, 7, 8].
1.1.2.5 Dye-sensitized solar cell (DSSC)
Dye-Sensitized Solar Cell (DSSC, DSC or DYSC) is a new class of solar cells which was first introduced by Michael Grätzel et al. in 1991 [11]. DSSC is composed of a dye-sensitized
Figure 1-3: Illustration of the photoinduced charge transfer with (b) a sketch of the energy level. After excitation in PPV polymer as an organic semiconductor, the electron is transferred to fullerene (C60) [8]
nanoporous TiO2 electrode on a transparent conductive oxide (TCO) electrode, a platinum counter electrode placed on the top of the TiO2 electrode and an electrolyte containing I-/I3- redox couple filling the pore of the electrode [2]. Its low cost materials and manufacturing process, and mechanical robustness are attractive, but its low efficiency (about 11%) is still a problem which is a concern in relation to price-performance ratio [12]. Separation of the function of light absorption from charge carrier transport is the main difference in DSSCs from the conventional solar cell devices [11].
1.1.2.5.1 Operational principles
The principal operation of DSSC is schematically presented in Figure 1-4. The mesoporous oxide layer composed of nanometer-sized particles of anatase TiO2 (or alternative wide band gap semiconductor oxide such as ZnO) is at the heart of the system. It is a high surface area electrically conductive network covered by a photosensitive chemical compound (dye). Photoexcitation of the monolayer of photosensitive dye (attached on the surface of TiO2 layer) leads to the injection of an electron into the conduction band of the oxide. Subsequently, the dye
1.1.2.5.2 Fabrication
Preparation of the TiO2 mesoporous layer and fabrication of the whole cell involve the following steps [2, 15, 16];
Preparation of conductive transparent substrate (e.g. fluorinated tin oxide (FTO) SnO2:F coated glass),
Paste processing (applying the colloidal paste of the TiO2 nanoparticles and a binder using processes such as doctor blading or screen printing)
Drying and firing; the deposited layer is dried in air and then is fired (sintered) at around 450°C to burn the organic binder, pore formation and to connect the TiO2 particle to each other and the support as well
Sensitizing; typically by soaking the porous TiO2 layer in a solution of a photosensitive dye for several hours followed by rinsing
Applying a Pt-sputtered conducting glass as the counter electrode, sealing and filling the cell with an electrolyte
Schematically, Figure 1-5 shows a typical structure of a dye-sensitized solar cell (DSSC).
1.1.2.5.3 Morphology
Figure 1-6 shows microscopic images of the TiO2 layer of a DSSC. Usually, it has a thickness around 5-20 μm. The porosity of layer is 50-65 % with the average pore size around 15 nm, area density of 1-4 mg/cm2, and surface area of 50 m2g-1 [2, 14]. Roughness factor, defined as the ratio between the real and the projected surface of the films, of the surface of these films for a 10 μm thick TiO2 film was estimated about 1000 [17].
Figure 1-5: Schematic construction of a DSSC [15, 17]
1.1.2.5.4 Important Components of DSSCs
1.1.2.5.4.1 Titanium Dioxide (TiO2)
Titanium dioxide (titanium oxide, titania) is a wide band gap (Eg=3.2 eV) semiconductor. Because of its high refractive index (~ 2.55-2.73 [18]), UV absorption, low cost, and availability, it is widely used as a white pigment in paint and plastic industries. TiO2 has three forms of crystalline structures; rutile, anatase and brookite. Thermodynamically, rutile is the most stable
Figure 1-6: (a) Three-dimensional surface image and (b) cross-sectional SEM image of a TiO2 film coated on a conducting glass [19], (c) scanning electron micrograph of the surface of a mesoporous anatase film prepared from a hydrothermally processed TiO2 colloid [20]
1.1.2.5.4.2 Sensitizing Dyes
Generally, two main types of sensitizers are used for DSSCs; inorganic (metal-based) and organic (metal free). A series of metal complex dyes based on Ruthenium polypyridyl (Ru) are currently highly efficient (11-11.3%) [22]. Figure 1-7 demonstrates the molecular structure of a group of these dyes. As can be seen, they have a metal center (ruthenium: Ru) which is responsible for light absorption and charge production. It injects the charge to organic ligand. Then the electrons are transferred to the semiconductor by hydroxyl groups (Figure 1-7). Stability, light absorption range and charge transfer rate are the most important characteristics that should be considered [2]. Ru is a rare and expensive metal. Hence, the need of cheap and available dyes encouraged developing less costly, but relatively less efficient organic dyes (8-9%) [2, 22]. Organic coumarin and indoline are examples of this group of dyes [23]. Error! Reference source not found. depicts other examples. Quantum sized (Quantum dot) particles such as PbS, CdS and Ag2S are also used as photosensitizer [24].
Figure 1-8: Molecular structure of coumarin derivative dyes and their absorption spectrum [25]
Up to here, some basic principles of solar cell technology and a brief introduction about DSSCs were presented. In the next section, works done on DSSCs based on flexible substrates and endeavors done toward mass production of PV cells will be reviewed. It is to be mentioned that the sintering operation of the TiO2 layer at high-temperatures is the main part of the cell fabrication process that is addressed in the next section.
1.1.2.5.5 Electrodes on Plastic Substrates for DSSC
Lower weight, increased flexibility, higher impact resistance, lower cost, possibility of the roll-to-roll process are some of the advantages of using plastic substrates instead of the glass ones for DSSC. However, the main concern is the step of TiO2 film deposition which includes an annealing process at high temperature (450 °C) that is responsible for removing the organic binder and forming an electrically connected network of TiO2 particles. Because of thermal degradation of plastic substrates, mostly Poly(ethylene-terephthalate) (PET) coated with indium doped tin oxide (ITO-PET), the thermal treatment is limited to 150 °C [26].
Pichot et al. [27] prepared the TiO2 electrodes from surfactant-free TiO2 colloidal suspensions sintered at 100 °C. They compared their performances with regular electrodes.
developed a new method to prepare an interconnected network of TiO2 nanoparticles on plastic substrates using static and dynamic mechanical compression. They deposited 20-25 %wt suspensions of nanoparticles in ethanol on the conductive PET substrates and applied a pressure around 1000 kg/cm2 using a static press and a roller mill. Because of relatively higher applied pressure, the samples prepared by static pressure had better performance. The mentioned researchers claimed cell efficiency around 5.2 % at 0.1 sun.
Kim et al. [31, 32], used laser sintering as a technique to eliminate organic additives at lower temperatures. Although they obtained better results compared to unsintered samples, they were far from the cells prepared via the standard method. Figure 1-10 compares the characteristic photocurrent density-voltage (I-V) curves of the cells prepared via the standard method and the laser sintering. In another work [26], UV treatment was applied as an assistant for removing the organic additives in low temperatures.
Figure 1-9: Cross sectional SEM pictures of TiO2 samples sintered at (A) 100 (B) 450 °C and (C) comparison of IPCE of sintered at 100 °C (▼) and 450 °C (●) [27]
Figure 1-10: I-V characteristics for dye-sensitized solar cells fabricated with a laser-sintered TiO2 (-□-), a non-laser-sintered TiO2 electrode (control cell) (-▲-), and a high-temperature-sintered TiO2 electrode (standard cell) (-●-) [32]
Drew et al. [33-35] reported an interesting work on using the electrospinning process to develop a porous structure from a mixture containing a polymer (PAN), a solvent (DMF), an azo-dye (congo red) and TiO2 nanoparticles (Degusa P25). They measured the photocurrent response of the solar cells based on these electrospun electrodes. Table 1.2 summarizes the composition and properties of the samples based on polyacrylonitrile. Noteworthy, efficiency or efficiency range of the cells was not discussed. The intensity of UV absorption spectrum was used as a criterion to obtain the concentration of the absorbed dye. Figure 1-11 compares the photocurrent response of a cell based on electrospun electrode with one based on a spin coated film electrode. It is noticeable that the measured current of the cells are in the range of nanoampere. A current 294.43 nA per mol was measured for electrospun electrode while, it was 118.49 nA per mol for spin coated one. The authors did not report any significant effect for the presence of TiO2 nanoparticles. In another work, they used PEO but did not report any morphological (porosity) details [35].
Recently, concept of polymer-inorganic composite was utilized to fabricate flexible photoelectrode of DSSC [36, 37]. In one approach, TiO2/PMMA composite paste was prepared by solution blending and sintered at 150 °C followed by mechanical compression [36]. Figure 1-12 shows cross-sectional SEM images of the TiO2/PMMA composite film with different
PMMA contents. Although adding PMMA improved flexibility of the photoelectrode, it resulted in reducing pore size and electric contact between nanoparticles. It was shown that short circuit current (Jsc) and efficiency of the cells decreased with PMMA concentration. However, open circuit voltage (Voc) increased with PMMA content and fill factor (FF) remained unchanged. In
Figure 1-11: (a) Photocurrent response for sample 3, representative of all electro spun cells, (b) photocurrent response for a representative of all spin-coated cells [34]
Figure 1-12: SEM images from cross-section of TiO2/PMMA composite film with different PMMA concentrations; (a) 0 wt%, (b) 1 wt% and (c) 5 wt%, where the scale bar denotes a length of 100 nm [36]
another approach, composite photoelectrode based on PVDF nanofiber/TiO2 was prepared by a spray-assisted electrospinning method (Figure 1-13a) [37]. Due to its structure, the photoelectrode prepared from this method had outstanding bending stability. In addition, its efficiency was comparable to the conventional DSSC.
1.2 Conductive Porous Polymer Film
In the previous sections, some basic points about the photovoltaic technology and a review on different kinds of solar cells were presented. Then, an interesting area of research regarding the development of cheap and efficient solar cells based on flexible plastic substrates was introduced. On the way of cost-effective production of electricity from solar energy, reducing production costs is as important as improving the efficiencies of the devices.
Since DSSCs are composed of relatively inexpensive materials, they have a great potential for large scale production on flexible substrates. But it depends on the development of a low-temperature process for TiO2 deposition. The TiO2 thin layer is a porous conductive network composed of interconnected TiO2 nanoparticles. This kind of structure provides a large surface area for deposition of the dye compound and its pores are filled with a liquid electrolyte. Table 1.3 summarizes the typical morphological features and properties of a TiO2 photoelectrode in the conventional method of preparation [2, 14].
Figure 1-13: (a) Spray-assisted electrospinning system. SEM images of (b) as-spun PVDF nanofibers, (c) as-prepared PVDF/TiO2 composite film, and (d) cross section of a compressed PVDF/TiO2 composite film, that is, of the fiber-reinforced composite structure
Accordingly, in the present project, we are focusing on the development of an electrically conductive porous polymer film via melt processing to be used instead of pure TiO2 photoelectrodes. Eliminating the high-temperature process, flexibility of the film and cost
Table 1.3: Important typical features of a TiO2 photoelectrode of a DSSC [2, 14]
Feature Value
Thickness 5-20 μm
Porosity 50-65 %
Average Pore Size 15 nm
Specific Surface Area (BET) 50 m2.g-1 Electrical Resistivity 1012 ohm.cm
effective mass production of the solar cells are some of the advantages of this process. In fact, we are investigating the possibility of making a percolated structure of TiO2 nanoparticles in a thermoplastic porous matrix with morphological and electrical properties near to those presented in Table 1.3. Some similar works done on replacing porous conductive films with polymer nanocomposites structures will be reviewed.
1.2.1 Stretching Filled Composites
Yakisir et al. [38] made attempts to develop a continuous process for producing highly conductive microporous films to be used in different parts of fuel cells. They compounded polypropylene (PP) with different combinations of carbon black (CB) and graphite (GR) as two conductive fillers. Using a twin screw extruder, highly loaded blends containing up to 60 wt% of the fillers were prepared. Although they used a high melt flow rate resin (MFR=100 dg.min-1), due to poor wetting of high surface filler by the polymer melt, it was not possible to incorporate more than 35 wt% of filler in a continuous mixing process.
Practically, obtaining a balance between processability of the compound and conductivity of the final product is a main challenge in such investigations because processability limits the final level of electrical conductivity. Rheological properties of the compounds were studied to find a suitable processable formulation for a film extrusion process. Figure 1-14 shows the apparent viscosity of the PP/CB/GR blends, with different concentrations, as a function of the imposed shear rate. Obviously, viscosity of the blend increases upon increasing the filler content and shows a power-law behavior.
In a post-extrusion stretching process, the prepared films were stretched up to 8-10 % at room temperature to create microvoids. As it can be seen in TEM images of Figure 1-15, the filler and polymer matrix were debonded at their interface. Then, a second stretching step at 160 °C was responsible for enlargement of the pores. Figure 1-16 demonstrates the proposed mechanism of the microporous structure formation during the two-stage stretching process. No significant reduction in electrical conductivity was observed due to stretching.
Figure 1-14: Apparent viscosity as a function of shear rate for PP/CB/GR blends at 230°C (a) CB/GR 70/30 wt%, (b) CB/GR 50/50 and 70/30 wt% [38]
1.2.2 Dispersed Phase Extraction
The previous researchers applied a polymer blending concept to achieve their goal in creating micropores in a conductive composite film [39]. They used blends of PP and PS, two immiscible polymers, as the polymer matrix. The PS phase was extracted after melt blending to prepare a porous structure. Figure 1-17 represents the changes of in-plane and through-plane film
Figure 1-15: TEM of films made from 50 wt-% PP/25 wt-% CB/25 wt-% GR blend. (a) before stretching and (b) after stretching [38]
Figure 1-16: Schematic representation of microcracks upon stretching. (a) PP/CB/GR morphology before stretching; (b) initiation of microcraks upon stretching at room temperature; (c) growth of microcracks upon stretching at elevated temperature (≈160 °C) [38]
resistivity with CB/GR phase concentration and their corresponding blend viscosities. The difference between these quantities was attributed to orientation of asymmetric filler along the extrusion axis. A little change in resistivity of the samples after the extraction of PS dispersed phase is a good evident of proper filler incorporation into the PP matrix phase.
Figure 1-17: In-plane and through-plane film resistivities and their corresponding blend viscosities (at a shear rate of 500 s-1 and T=230 °C) as a function of CB/GR phase concentration [40]
droplet size of the PS dispersed phase.
1.3 Alternative Approach for the Porous Electrode of DSSCs
According to what is required for development of porous layer of TiO2 in DSSCs, we need the presence of pores around the network of TiO2 particles. Therefore, creating pores by stretching the filled polymer film is a possible method among the discussed approaches in the previous sections, because it yields the creation of pores at the polymer-filler interface. Hence, the next section reviews studies performed on producing porous films via stretching of filled polymer composites.
Figure 1-18: Resistivity and BET surface area of porous uncompressed films as a function of initial PS concentration [40]
1.4 Filled Membranes
One of the well-known methods of producing porous flexible thin films/sheets is based on stretching polymeric composite sheets containing rigid fillers. This kind of microporous films is made of a thermoplastic that is filled (40-70 %wt) with organic or inorganic fillers [42].
1.4.1 Pore Formation
Figure 1-19 shows a diagram of typical formulation and process steps of producing microporous polypropylene sheets containing CaCO3 filler. The biaxial stretching of polymer composite sheets containing a fine dispersion of the filler causes to detachment of the two phases from the interface, due to stress concentration, and results in pore formation in the polymer sheet/film. Structural characteristics of the three dimensional network of interconnected pores, which is schematically depicted in Figure 1-20, is responsible for permeability of the films [43]. In the
Figure 1-19: Schematic diagram of formulation and processing of microporous polypropylene sheets containing CaCO3 [43]
Figure 1-20: (a) Schematic structure of microporous sheet [43], (b) schematic mechanism of micropore formation [44]
step of machine direction (MD) stretching, initial voids are formed at the periphery of filler particles. Then, these initial voids are widened by stretching in transverse direction (TD) (Figure 1-20b). The SEM micrographs of surface and cross section of a filled porous sheet are illustrated in Figure 1-21. Whereas the biaxial stretching yields to the circular/elliptical voids on the surface of the films, a layered structure of polymer matrix formed in parallel to the extension plane.
1.4.2 Effect of Particle Size
The final properties of the porous films are affected by material properties (e.g. characteristics of polymer matrix, filler nature, filler particle size etc.) and process conditions (such as mixing conditions, extension rate and temperature) [42, 44, 45]. Nago et al. [43] studied the effect of CaCO3 particle size on the structure of biaxially stretched microporous PP sheets. They reported that using smaller particles leads to higher porosity and effective porosity. In addition, samples containing the smaller particles had lower tortuosities and smaller equivalent pore sizes (Figure 1-22b). It is to be mentioned that porosity is defined as ratio of the void volume to volume of the porous sample, while effective porosity is the density, or distribution per space unit, of the open pores that extend from wall to wall of the film [42]. At a constant filler concentration, the smaller the particle size, the higher the number of filler particles. Therefore, the number of stretch-
Figure 1-21: SEM micrograph of PP sheets containing CaCO3 (0.08 μm); (a) surface after stretching in MD, (b) cross section after stretching in MD [46], (c) surface after biaxial stretching and (d) cross section after biaxial stretching [43]
induced pores and their interconnectivity increase [43].
1.4.3 Effect of Filler Type and Filler Concentration
Mizutani and coworkers reviewed the effects of different parameters on the properties of microporous polypropylene sheets [44]. They prepared PP-based composites containing different compositions of various inorganic fillers (CaCO3, SiO2 and diatomaceous SiO2). Figure 1-23a represents the effect of filler type and filler concentration on maximum pore size (Dmax). As can be seen, higher concentrations of filler result in relatively larger Dmax. The difference among these dependencies for the different fillers was attributed to the particle shape as well as affinity of filler surface with the polymer matrix. One of the interesting points that should be mentioned is the effect of small particle aggregation on the structure of the pores. Figure 1-23b elucidates that aggregation of the smallest CaCO3 particles leads to a broad particle size distribution and consequently broad distribution of pore size of the membranes.
Figure 1-22: (a) relationship of permeability coefficient (K0) to the mean particle size of fillers; (b) dependence of effective porosity (ε/q2) and tortuosity factor (q) on mean particle size of fillers [43]
Figure 1-23: (a) Relations between filler content and Dmax. Stretching temperature, 110 (MD) and 140 °C (TD). Stretching degree, 250 % in MD and 160 % in TD. Filler: ○, CaCO3; □, SiO2; ∆, diatomaceous SiO2. (b) Pore size distribution of biaxially stretched microporous PP sheets containing CaCO3 with different mean particle size; 1) 3.0, 2) 1.7, 3) 0.8 and 4) 0.08 μm [44]
In order to overcome the aggregation of small particles and to reach to a fine dispersion of the filler in the polymer matrix, Mizutani and Nago prepared composites of PP/SiO2 using a sol-gel reaction of tetraethoxysilane (TES) in molten PP using an extruder [47]. Table 1.4 summarizes the structural properties of the obtained porous films. The ash content was used as a measure of SiO2 content. As can be seen, the obtained pore sizes were in the range of few nanometers.
1.4.4 Effect of Stretching Ratio
Nago and Mizutani, in another work [48], studied the structure, permeability and mechanical properties of microporous sheets containing polymethylsilsesquioxane particles. They also investigated the effects of transverse direction (TD) stretching on structure and properties of PP sheets containing CaCO3 [46, 49]. Effect of extracting the CaCO3 particles by HCl treatment was also studied. The term “stretching ratio” was defined as total length after stretching divided by the original length before stretching. Figure 1-24 indicates that porosity (ε) and maximum pore size (Dmax) increase with stretch ratio because of pores widening. Figure 1-25 shows the effects of stretching ratio on the effective porosity (ε/q2), tortusity (q), and the equivalent pore size (m) of porous sheets containing particles with 0.08 μm average particle size. Although the tortusity factor slightly decreases with stretching ratio, its values are pretty large. On the other hand, small values of effective porosity imply complicated structure of fibrous texture of the polymer matrix.
Figure 1-24: Effect of stretching ratio (DTD) on some properties of the microporous sheets. ●:
samples containing CaCO3 (average particle size 3 μm). ○: samples after removing CaCO3 [49]
1.4.5 Other Parameters
Stretching temperature is another important process parameter. Extension at elevated
Figure 1-25: ε/q2, q, and m versus TD stretching ratio: (○) before HCl treatment; (●) after HCl treatment [46]
temperatures does not result in an efficient pore structures. Typically, the optimum stretching temperature is between Tg and Vicat softening temperature. Deformation rate and film thickness also affect permeability properties [45]. In addition, rheological properties of the polymer matrix should provide an acceptable level of processability and extrudate stability as well [42].
1.5 Melt-Blended Thermoplastic/Titanium Dioxide Nanocomposites
According to the previous sections and the aim to develop a composite structure containing TiO2 nanoparticles, a review on the works focused on melt-blending of thermoplastic polymers and TiO2 are presented in this section.Table 1.5 summarizes some of the recent works about polymer/TiO2 micro- and nanocomposites prepared via melt processing. As can be seen, among the different thermoplastic resins which have been used for different applications, polyolefins are widely used. Polypropylene is the most utilized one. In the case of nanocomposites, it is difficult to find highly concentrated blends. However, some of most important aspects of this kind of filled polymer systems will be reviewed in the following sections.
![Figure 1-7: Schematic mechanism and molecular structure of Ruthenium-based dyes [13]](https://thumb-eu.123doks.com/thumbv2/123doknet/2352999.36686/36.918.210.742.732.999/figure-schematic-mechanism-molecular-structure-ruthenium-based-dyes.webp)
![Figure 1-9: Cross sectional SEM pictures of TiO2 samples sintered at (A) 100 (B) 450 °C and (C) comparison of IPCE of sintered at 100 °C (▼) and 450 °C (●) [27]](https://thumb-eu.123doks.com/thumbv2/123doknet/2352999.36686/38.918.218.741.656.935/figure-cross-sectional-pictures-samples-sintered-comparison-sintered.webp)
![Figure 1-10: I-V characteristics for dye-sensitized solar cells fabricated with a laser-sintered TiO2 (-□-), a non-laser-sintered TiO2 electrode (control cell) (-▲-), and a high-temperature-sintered TiO2 electrode (standard cell) (-●-) [32]](https://thumb-eu.123doks.com/thumbv2/123doknet/2352999.36686/39.918.285.633.101.389/characteristics-sensitized-fabricated-sintered-electrode-temperature-electrode-standard.webp)
![Figure 1-12: SEM images from cross-section of TiO2/PMMA composite film with different PMMA concentrations; (a) 0 wt%, (b) 1 wt% and (c) 5 wt%, where the scale bar denotes a length of 100 nm [36]](https://thumb-eu.123doks.com/thumbv2/123doknet/2352999.36686/41.918.119.811.103.284/figure-images-section-composite-different-concentrations-denotes-length.webp)
![Figure 1-17: In-plane and through-plane film resistivities and their corresponding blend viscosities (at a shear rate of 500 s-1 and T=230 °C) as a function of CB/GR phase concentration [40]](https://thumb-eu.123doks.com/thumbv2/123doknet/2352999.36686/45.918.247.674.654.935/figure-plane-resistivities-corresponding-blend-viscosities-function-concentration.webp)
![Figure 1-18: Resistivity and BET surface area of porous uncompressed films as a function of initial PS concentration [40]](https://thumb-eu.123doks.com/thumbv2/123doknet/2352999.36686/46.918.261.660.604.874/figure-resistivity-surface-porous-uncompressed-function-initial-concentration.webp)
![Figure 1-30: Change of microhardness at various concentrations of filler for both EM and ECM samples [52]](https://thumb-eu.123doks.com/thumbv2/123doknet/2352999.36686/59.918.256.663.632.956/figure-change-microhardness-various-concentrations-filler-ecm-samples.webp)
![Table 1.6: Effect of surfactants on anatase 15 nm TiO2 agglomerate size [64]](https://thumb-eu.123doks.com/thumbv2/123doknet/2352999.36686/61.918.244.675.149.330/table-effect-surfactants-anatase-nm-tio-agglomerate-size.webp)
![Figure 1-32: Possible chemical reactions between PP, PP-g-MAH, PA6 and TDI-functionalized TiO2 nanoparticles [68]](https://thumb-eu.123doks.com/thumbv2/123doknet/2352999.36686/62.918.276.645.137.594/figure-possible-chemical-reactions-mah-tdi-functionalized-nanoparticles.webp)
