ROAD TRAFFIC CONGESTION ANALYSIS VIA CONNECTED VEHICLES
RANWA AL-MALLAH
DÉPARTEMENT DE GÉNIE INFORMATIQUE ET GÉNIE LOGICIEL ÉCOLE POLYTECHNIQUE DE MONTRÉAL
THÈSE PRÉSENTÉE EN VUE DE L’OBTENTION DU DIPLÔME DE PHILOSOPHIÆ DOCTOR
(GÉNIE INFORMATIQUE) AOÛT 2018
c
ÉCOLE POLYTECHNIQUE DE MONTRÉAL
Cette thèse intitulée :
ROAD TRAFFIC CONGESTION ANALYSIS VIA CONNECTED VEHICLES
présentée par : AL-MALLAH Ranwa
en vue de l’obtention du diplôme de : Philosophiæ Doctor a été dûment acceptée par le jury d’examen constitué de :
M. PIERRE Samuel, Ph. D., président
M. QUINTERO Alejandro, Doctorat, membre et directeur de recherche M. FAROOQ Bilal, Ph. D., membre et codirecteur de recherche
Mme BELLAÏCHE Martine, Ph. D., membre M. ST-HILAIRE Marc, Ph. D., membre
DEDICATION
To my best friend, you know who you are...
ACKNOWLEDGMENTS
Firstly, Prof. Alejandro Quintero, thank you for believing in me, whitout your support and guidance none of this would have been possible. You were my advisor, my friend. You are a man of few words. This thaught me a lifetime lesson. I learned alot from you. I admire your professionalism and I hope I can be half the teacher you are.
I would like to express my sincere gratitude to Prof. Bilal Farooq for the continuous support of my Ph.D study. You are a genius. You gave me the confidence I need to get to where I am today as a researcher.
I would also like to thank Prof. Martine Bellaïche. You are my idol. I verbally expressed my admiration to you many times and I will do it again here. I will never forget you.
My sincere thanks also go to Prof. Samuel Pierre for being my mentor, not only during my studies, but throughout my career. Every advice you had for me I tried to follow because your words are gold and everyone knows that. Prof. Marc St-Hilaire thank you for showing interest in my work and accepting to participate in this jury.
I also thank my fellow lab colleagues. I honestly wasn’t in the lab the person I really am because often times, the thesis required from me to get in my own bubble. I thank you for understanding me.
Last but not the least, I would like to thank mama, baba, Ahmed, Ashraf and Rola. Mama, you raised me and you raised my kids for me. You are madrasti. Baba, I did this for you. I was going to dedicate this to you but you know my best friend and even you, agree that this is dedicated to him. Ahmed, Ashraf, I’m lucky to have you in my life and I am looking forward to enjoy the rest of my life with you. Rola, I love you so much, but this you already know.
RÉSUMÉ
La congestion routière est un état particulier de mobilité où les temps de déplacement aug-mentent et de plus en plus de temps est passé dans le véhicule. En plus d’être une expérience très stressante pour les conducteurs, la congestion a également un impact négatif sur l’en-vironnement et l’économie. Dans ce contexte, des pressions sont exercées sur les autorités afin qu’elles prennent des mesures décisives pour améliorer le flot du trafic sur le réseau routier. En améliorant le flot, la congestion est réduite et la durée totale de déplacement des véhicules est réduite. D’une part, la congestion routière peut être récurrente, faisant ré-férence à la congestion qui se produit régulièrement. La congestion non récurrente (NRC), quant à elle, dans un réseau urbain, est principalement causée par des incidents, des zones de construction, des événements spéciaux ou des conditions météorologiques défavorables. Les opérateurs d’infrastructure surveillent le trafic sur le réseau mais sont contraints à utiliser le moins de ressources possibles. Cette contrainte implique que l’état du trafic ne peut pas être mesuré partout car il n’est pas réaliste de déployer des équipements sophistiqués pour assurer la collecte précise des données de trafic et la détection en temps réel des événements partout sur le réseau routier. Alors certains emplacements où le flot de trafic doit être amélioré ne sont pas surveillés car ces emplacements varient beaucoup. D’un autre côté, de nombreuses études sur la congestion routière ont été consacrées aux autoroutes plutôt qu’aux régions urbaines, qui sont pourtant beaucoup plus susceptibles d’être surveillées par les autorités de la circulation. De plus, les systèmes actuels de collecte de données de trafic n’incluent pas la possibilité d’enregistrer des informations détaillées sur les événements qui surviennent sur la route, tels que les collisions, les conditions météorologiques défavorables, etc. Aussi, les études proposées dans la littérature ne font que détecter la congestion ; mais ce n’est pas suffisant, nous devrions être en mesure de mieux caractériser l’événement qui en est la cause. Les agences doivent comprendre quelle est la cause qui affecte la variabilité de flot sur leurs installations et dans quelle mesure elles peuvent prendre les actions appropriées pour atté-nuer la congestion.
Dans cette thèse, nous proposons la collecte de données de trafic via les réseaux ad hoc de véhicules ou VANET. Cette technologie de surveillance avancée est capable d’agréger des variables de trafic microscopiques et macroscopiques à divers niveaux de granularité. Nous avons conçu un algorithme pour la détection et l’évaluation en temps réel de l’état du trafic routier. Nous proposons des modèles de classification basés sur les caractéristiques de trafic collectées pour l’inférence sur la cause de la congestion dans un réseau routier urbain. Nous mettons en place un processus de coopération pour augmenter la précision des estimations
car d’un côté, le trafic est multiforme et aussi pour dissimuler le fait que les véhicules ont une connaissance partielle de l’état de la route. Si les véhicules connectés peuvent détecter la congestion et en attribuer une cause potentielle, nous croyons qu’ils peuvent alors transférer cette connaissance en temps réel à une entité située sur un segment de route en aval pour que cette dernière puisse prédire avec précision le flot sur ce segment. Nous proposons une méthodologie de prédiction de flot de trafic prenant en compte les flots historiques sur le segment en question ainsi que des attributs, tels que les données obtenues en temps réel par les véhicules connectés et les indices de temps de parcours sur les trajectoires des véhicules. Nous montrons comment cette nouvelle approche dans ce domaine améliore la précision de la prédiction. Pour valider les modèles nous simulons des scénarios élaborés à partir de traces réelles de mouvement de véhicules dans un milieu urbain afin de construire un jeu de don-nées synthétique pour le processus d’apprentissage que doivent effectuer les modèles proposés. Nous décrivons dans ce qui suit les trois phases de cette thèse.
La première phase de la thèse affine les approches proposées dans la littérature quant à la détection de la congestion via les réseaux ad hoc de véhicules qui regroupent la congestion non récurrente et la congestion récurrente. Nous soutenons que détecter la congestion ne suffit pas, et nous prévoyons estimer la cause de la congestion, soit étant une congestion ré-currente ou non réré-currente. Et plus particulièrement dans ce dernier cas, nous estimerons si la cause est due à un incident, zones de construction, événement spécial dans les environs ou à des conditions météorologiques défavorables. Pour ce faire, nous proposons un problème de classification et nous appliquons des méthodes d’apprentissage automatique pour résoudre le problème de classification de la congestion en ses composants en prenant en compte les ca-ractéristiques de trafic collectées à partir des véhicules connectés pour l’inférence sur la cause de la congestion. En particulier, nous considérons un ensemble de caractéristiques uniques pour chaque type de NRC et extrayons ces caractéristiques à partir des données collectées pour déduire la NRC. Plus précisément, les incidents et les zones de construction sont es-sentiellement caractérisés par des points problématiques sur le segment de route. Pour les conditions météorologiques défavorables, nous évaluons le temps de parcours, la vitesse et la distance inter-véhiculaire tout au long de la trajectoire du véhicule. Et les événements spé-ciaux sont caractérisés par leur région d’impact et l’accroissement de la demande autour de cette région. Nous intégrons des mécanismes d’apprentissage automatique et des politiques compilées dans les véhicules qui effectuent une détection locale en temps réel pour déduire la cause réelle de la congestion non récurrente. Le classificateur bayésien naïf proposé (NB), l’arbre de décision (CT), la forêt aléatoire (RF) et une technique d’amplification classent avec une grande précision les causes de la congestion détectée. Cette méthodologie peut aider les organismes de transport à réduire la congestion urbaine car sachant les causes sous-jacentes
de la congestion détectée, ils peuvent élaborer des stratégies efficaces pour l’atténuer. Dans la deuxième phase, afin d’améliorer davantage la précision des estimations de la cause de la congestion obtenue à la phase précédente et d’obtenir des informations en temps réel plus approfondies sur l’état de la circulation, nous présentons des méthodes faisant appel à la coopération décentralisée entre les véhicules connectés. Une méthodologie distribuée basée sur l’exploration de données pour élaborer collectivement une décision concernant la cause de la congestion du trafic sur un réseau routier via les technologies émergentes des véhicules connectés a été développée. Dans l’état actuel, si un événement reçu par un véhicule est une fausse alarme, l’algorithme à bord du véhicule fusionne cette information avec d’autres re-çues sur le même segment de route et propage l’incertitude entre les véhicules. Cela pourrait engendrer une congestion encore plus importante. Un processus d’évaluation doit avoir lieu après la détection et avant la fusion des données. Nous ajoutons cette couche pour remédier à la vulnérabilité des algorithmes de fusion et pour réduire les effets secondaires des fausses alarmes car les approches proposées dans la littérature ne traitent pas les données avant de les fusionner. Elles représentent ainsi une menace de sécurité pour le réseau routier. En outre, nous explorons les données collectées à des fins d’apprentissage en construisant des modèles capables d’apprentissage automatique. Nos méthodes d’exploration de données consistent en une procédure de vote, des fonctions de Croyance et une technique d’association de données pour une inférence efficace sur la cause de la congestion du trafic via la technologie des ré-seaux ah hoc de véhicules. L’évaluation des performances de nos méthodes montre qu’elles améliorent la précision de l’estimation de la cause de la congestion, réduisent le temps de détection et diminuent les fausses alarmes déclenchées dans le réseau. Ceci certifie que les phénomènes complexes de trafic routier sont mieux observés à travers les interactions entre les véhicules échangeant des messages entre eux. Enfin, les simulations démontrent que les méthodes requiert seulement 63% de taux de pénétration de la technologie des véhicules connectés pour obtenir tous les avantages des communications entre les véhicules.
Dans la dernière phase de la thèse, nous abordons le problème de la prédiction du flot de véhicules sur un segment de route donné. Nous intégrons à la prédiction du flot, le fait que les véhicules peuvent détecter une congestion excessive tout au long de leur trajectoire et en attribuer collectivement une cause. Particulièrement, nous incorporons l’impact de divers événements survenant sur la route dans la prédiction du flot de trafic. Nous proposons un réseau de neurones profonds (DNN) et abordons le problème en apprenant le DNN cible dans une technique d’apprentissage multitâche. Les entrées du DNN prennent en compte à la fois les variables macroscopiques et microscopiques du trafic. En effet, en plus des données de flots historiquement observés sur le segment, les données provenant des réseaux ad hoc
de véhicules, tel que l’indice sommaire de temps de parcours éprouvé au long de la trajec-toire et les évènements en temps réel vécus sur le réseau urbain sont utilisées par la modèle pour l’apprentissage. Le modèle apprend une représentation prenant en compte les différents événements rencontrés sur les différents segments de sa trajectoire. Les résultats montrent que notre approche surpasse significativement les approches existantes qui ne s’adaptent pas à des situations changeantes de trafic. Le modèle DNN a appris des similitudes historiques entre les différents segments, contrairement à l’utilisation des tendances historiques directes dans la mesure elle-même, car parfois les tendances peuvent ne pas exister dans la mesure, mais le sont dans les similitudes.
En somme, un système de transport est un réseau fortement corrélé. Les caractéristiques des systèmes de transport, tels les grandes quantités de données et les dimensions élevées des variables de la circulation, font de l’apprentissage automatique une approche prometteuse pour la recherche sur les problématiques dans ce domaine. Particulièrement, la prédiction du flot de véhicules permet une modélisation avancée, car la connaissance du volume de trafic allant vers une destination donnera plus d’informations sur les demandes attendues dans un proche avenir. Les techniques proposées pour la collecte de données via la technologie des véhicules connectés, la classification coopérative de la cause de la congestion et la méthodo-logie développée pour la prédiction du flot aideront les autorités à améliorer le flot de trafic du réseau routier et ainsi réduire la congestion.
ABSTRACT
Road traffic congestion is a particular state of mobility where travel times increase and more and more time is spent in vehicles. Apart from being a quite-stressful experience for drivers, congestion also has a negative impact on the environment and the economy. In this context, there is pressure on the authorities to take decisive actions to improve the network traffic flow. By improving network flow, congestion is reduced and the total travel time of vehicles is decreased. In fact, congestion can be classified as recurrent and non-recurrent (NRC). Recurrent congestion refers to congestion that happens on a regular basis. Non-recurrent congestion in an urban network is mainly caused by incidents, workzones, special events and adverse weather. Infrastructure operators monitor traffic on the network while using the least possible resources. Thus, traffic state cannot be directly measured everywhere on the traffic road network. But the location where traffic flow needs to be improved varies highly and certainly, deploying highly sophisticated equipment to ensure the accurate estimation of traffic flows and timely detection of events everywhere on the road network is not feasi-ble. Also, many studies have been devoted to highways rather than highly congested urban regions which are intricate, complex networks and far more likely to be monitored by the traffic authorities. Moreover, current traffic data collection systems do not incorporate the ability of registring detailed information on the altering events happening on the road, such as vehicle crashes, adverse weather, etc. Operators require external data sources to retireve this information in real time. Current methods only detect congestion but it’s not enough, we should be able to better characterize the event causing it. Agencies need to understand what is the cause affecting variability on their facilities and to what degree so that they can take the appropriate action to mitigate congestion.
In this thesis, to optimize the traffic flow in the transportation system in order to mitigate congestion, we propose the collection of measurable traffic features extracted by an advanced monitoring technology, Vehicular Ad hoc NETworks (VANET), capable of aggregating mi-croscopic and mami-croscopic traffic variables at various levels of granularity. We designed an algorithm for the real-time assessment and evaluation of road traffic condition. We pro-pose classification models based on the traffic features collected for inference on the cause of congestion in an urban road network. We implement a cooperation process to increase estimation accuracy because traffic is multifaceted and to conceal the fact that individually, vehicles have partial knowledge about the road condition. If connected vehicles can detect congestion and cooperatively attribute a possible cause to it, we believe that they can then transfer this knowledge in real time to an entity able to accurately predict flow on a road
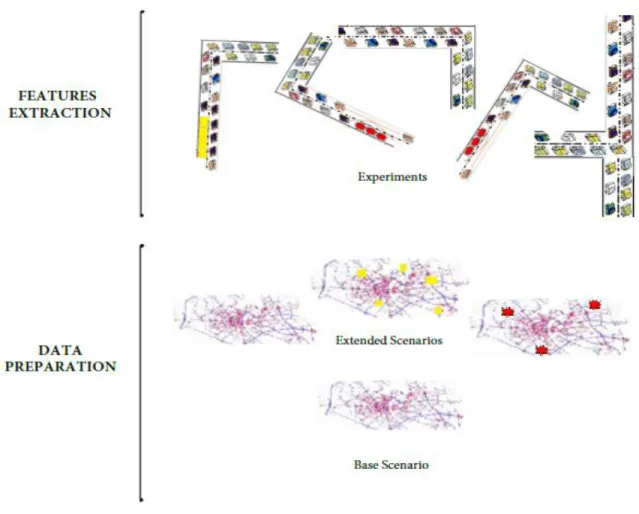
segment. We propose a traffic flow prediction framework taking into account historical flows as well as innovative features, such as real-time reports from connected vehicles and travel time along a trajectory for accurate forecasting of flow in an urban network in order to cope with the fact that existing approaches that do not adapt to the varying traffic situations. We show how this novel approach in this domain improves accuracy of prediction. To validate the models and the framework, we simulate scenarios extended from a realistic urban city vehicular motion traces in order to build a synthetic dataset to feed the models for learning purposes. The work in this thesis is carried out in three phases.
In the first phase of our thesis, we refine previous VANET-based congestion detection ap-proaches that group non-recurrent congestion together with recurrent congestion. Not only we propose that detecting congestion is not enough, we plan to further classify the recurrent and non-recurrent congestion (incidents, workzones, special events and adverse weather). We portray this as a classification problem and we apply machine learning methods to solve the classification of congestion into its components taking traffic features collected from con-nected vehicles into account for the inference on the cause of congestion. Particularly, we consider a set of unique features for each type of NRC and extract such features from the data to infer the NRC. Specifically, incidents and workzones are essentially characterized by problematic spots. For inclement weather, we assess the trajectory travel time, speed and gap. And special events are characterised by their impact region and demand surge. We em-bed reasoning machinery or compiled policies in vehicles that perform local, real-time sensing to infer the actual cause of the non-recurrent congestion. The proposed Naive Bayesian clas-sifier (NB), Classification Tree (CT), Random Forest (RF) and a boosting technique classify with high accuracy the causes of the underlying congestion status. This framework can as-sist transportation agencies in reducing urban congestion by developing effective congestion mitigation strategies knowing the root causes of congestion.
In the second phase, to obtain deeper real-time insights of traffic conditions and improve estimation accuracy, we present methods using decentralized cooperation between individual vehicles. A distributed data mining based methodology to elaborate a decision collectively concerning the cause of traffic congestion on a road network via emerging connected vehicle technologies was developed. In the current state, if an event received by a vehicle is a false alarm, the algorithm will fuse the obtained information with others located on a same road segment and spread uncertainty among vehicles and this in turn causes more congestion. An evaluation process has to take place after data sensing and before data fusion. We add this layer to address the vulnerability of fusion algorithms and to lower the side effects of false alarms because the approaches proposed in the literature fail to process the data before fusion
and present a security threat to the network. Also, we explore the collected data for learning purposes by building models capable of machine learning. Our mining methods consist of a voting procedure, belief functions and a data association technique for efficient inference on the cause of traffic congestion via connected vehicles technology. The performance evaluation of the our methods show that they enhance estimation accuracy, lower detection time and decrease false alarms triggered by the network. This implies that the complex traffic phe-nomena is better observed through the interactions between vehicles exchanging messages. Finally, the methods require only 63% penetration rate to obtain the full benefits of vehicle-to-vehicle communications.
In the last phase of our work in this thesis, we address the problem of traffic flow predic-tion. We integrate the fact that vehicles traveling along a trajectory can detect excessive congestion and collectively attribute a cause to it into the forecasting of traffic flow on a target road segment. This means that we incorporate the impact of various events happen-ing on the road into the forecasthappen-ing of traffic flow on a target road segment. We propose a Deep Neural Networks (DNNs), and tackle the problem by learning the target DNN in a multitask learning technique. The DNN input features take into account both macroscopic and microscopic traffic variables in the prediction of traffic flow. In fact, using historical flows and well engineered features, such as real-time reports from connected vehicles and travel time along a trajectory for accurate forecasting of flow in an urban network, the model learns a representation that takes into account the various events that vehicles realistically encounter on the segments along their trajectory. The results show our approach significantly outperforms existing approaches that do not adapt to the varying traffic situations. DNN learned historical similarities between road segments, in contrast to using direct historical trends in the measure itself, since sometimes trends may not exist in the measure but do in the similarities.
In general, a transportation system is a highly correlated network. The characteristics of transportation systems, such as the large amounts of data and the high dimensions of fea-tures, makes machine learning a promising approach for transportation research. In fact, traf-fic flow prediction allows advanced modelling because knowing the volume of traftraf-fic heading toward a destination will give more insights about the expected demands in the near future. The proposed techniques for data collection via connected vehicles technology, the coopera-tive classification of the cause of congestion and the developed framework for flow prediction will help infrastructure authorities improve the network traffic flow and thus reduce traffic congestion.
TABLE OF CONTENTS
DEDICATION . . . iii
ACKNOWLEDGMENTS . . . iv
RÉSUMÉ . . . v
ABSTRACT . . . ix
TABLE OF CONTENTS . . . xii
LIST OF TABLES . . . xv
LIST OF FIGURES . . . xvi
LIST OF SYMBOLS AND ABBREVIATIONS . . . xviii
CHAPTER 1 INTRODUCTION . . . 1
1.1 Definitions and basic concepts . . . 2
1.1.1 Traffic flow Theory . . . 3
1.1.2 Traffic data collection . . . 6
1.1.3 Congestion . . . 10
1.2 Problem definition . . . 13
1.3 Research objectives . . . 17
1.4 Main contributions and their originality . . . 18
1.5 Thesis structure . . . 20
CHAPTER 2 LITERATURE REVIEW . . . 23
2.1 Detection of congestion . . . 23
2.1.1 Methods based on the infrastructure . . . 23
2.1.2 Methods based on the vehicles . . . 24
2.2 Classification of congestion . . . 25
2.2.1 Offline approach . . . 25
2.2.2 Online approach . . . 26
2.3 Evaluation of the cause of congestion . . . 28
2.4 Prediction of traffic Flow . . . 30
2.4.2 Nonparametric approach . . . 31
2.4.3 Hybrid approach . . . 33
2.5 Analysis and limitations . . . 33
CHAPTER 3 METHODOLOGY . . . 37
3.1 Phase 1 : Classification of traffic congestion . . . 37
3.1.1 Components of congestion . . . 37
3.1.2 Classification models . . . 43
3.1.3 Real-time continuous evaluation of traffic . . . 45
3.1.4 Performance analysis . . . 46
3.2 Phase 2 : Cooperative evaluation of the cause of congestion . . . 56
3.2.1 Data mining methods . . . 56
3.2.2 Synthetic dataset for training . . . 58
3.2.3 Performance evaluation . . . 60
3.3 Phase 3 : Prediction of traffic flow in an urban traffic network . . . 61
3.3.1 Problem definition . . . 62
3.3.2 Proposed approach . . . 62
3.3.3 Performance evaluation . . . 63
3.4 Conclusion . . . 64
CHAPTER 4 ARTICLE 1 : DISTRIBUTED CLASSIFICATION OF URBAN CONGES-TION USING VANET . . . 65
4.1 Introduction . . . 65 4.2 RELATED WORK . . . 67 4.3 GENERAL PROCESS . . . 67 4.4 SIMULATION . . . 71 4.4.1 Results . . . 74 4.5 CONCLUSION . . . 78
CHAPTER 5 ARTICLE 2 : COOPERATIVE EVALUATION OF THE CAUSE OF URBAN TRAFFIC CONGESTION VIA CONNECTED VEHICLES . . . 80
5.1 Introduction . . . 80
5.2 RELATED WORK . . . 84
5.3 DATA MINING METHODS . . . 89
5.4 IMPLEMENTATION AND RESULTSl . . . 97
5.4.1 Simulation outline . . . 98
5.4.3 Penetration rate of CVs . . . 108
5.5 Conclusion . . . 112
CHAPTER 6 ARTICLE 3 : PREDICTION OF TRAFFIC FLOW VIA CONNECTED VEHICLES . . . 115 6.1 Introduction . . . 115 6.2 RELATED WORK . . . 121 6.2.1 Parametric approach . . . 121 6.2.2 Nonparametric approach . . . 122 6.2.3 Hybrid approach . . . 124 6.2.4 Design principle . . . 125 6.3 FRAMEWORK . . . 127 6.3.1 Data collection by CVs . . . 127
6.3.2 Data collection by RSU . . . 130
6.4 STP Model . . . 131
6.5 SIMULATION AND RESULTS . . . 135
6.5.1 Simulation outline . . . 136
6.5.2 Results . . . 138
6.6 CONCLUSION . . . 145
CHAPTER 7 GENERAL DISCUSSION . . . 148
7.1 Objectives achievement . . . 148
7.2 Results analysis . . . 151
7.3 Limitations . . . 153
CHAPTER 8 CONCLUSION . . . 154
LIST OF TABLES
Table 5.1 Description of experiments . . . 99 Table 5.2 Combination of mass functions mi from messages Mi,i ∈ {1,2,3,...,22} 103
Table 5.3 General association rules . . . 106 Table 6.1 Performance comparison of MTL with the time series, baselines (RF,
LIST OF FIGURES
Figure 1.1 Road traffic network . . . 3
Figure 1.2 Trajectories of eight vehicles on a space-time diagram . . . 4
Figure 1.3 Flow-Speed-Density Relationship Diagrams . . . 6
Figure 1.4 Vehicular ad hoc networks . . . 9
Figure 3.1 Trajectory of vehicles around a problematic spot . . . 42
Figure 3.2 Historical TT on a segment at 5 minutes interval and excessive TT with c=1.4 . . . 47
Figure 3.3 Variability of travel time data . . . 47
Figure 3.4 Desired speeds of a vehicle along its trajectory . . . 48
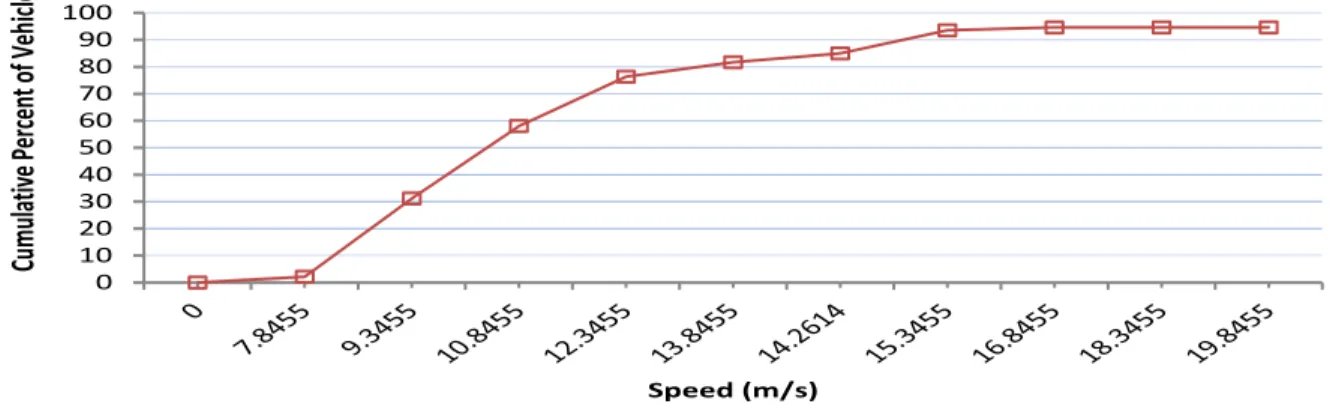
Figure 3.5 Cumulative speed distribution curve of a vehicle in the base scenario 48 Figure 3.6 85th percentile speed of vehicles in different scenarios . . . 48
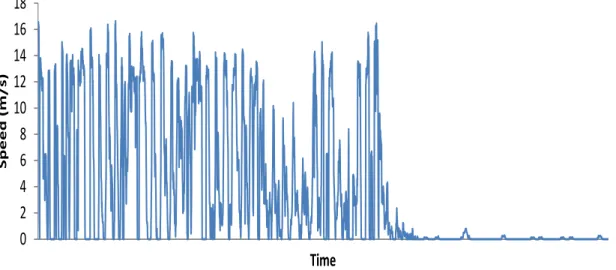
Figure 3.7 Following distance of a moving vehicle in the base scenario . . . 50
Figure 3.8 85th percentile gap values of vehicles in different scenarios . . . 50
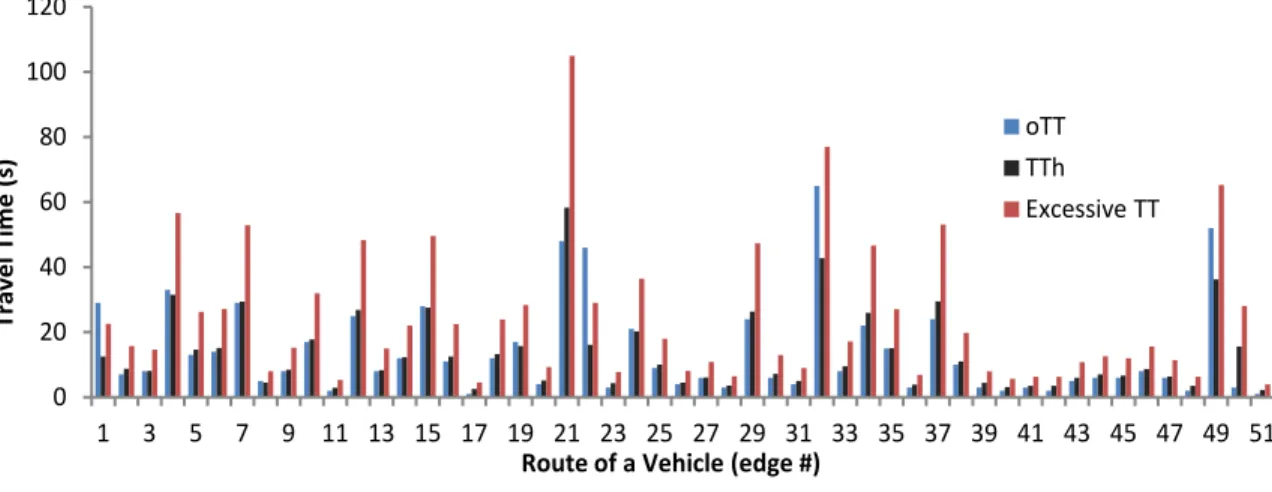
Figure 3.9 Trajectory travel time on edges of a route of a vehicle in the base scenario, c= 1.8 . . . 51
Figure 3.10 Comparative observed travel time along a route of a vehicle in different scenarios . . . 51
Figure 3.11 Speed-Density . . . 53
Figure 3.12 Flow-Density . . . 53
Figure 3.13 Speed-Flow . . . 54
Figure 3.14 Trajectory demand along a route for different scenarios . . . 54
Figure 3.15 Variation of mean speed on an edge . . . 55
Figure 3.16 Variation of flow and density on an edge . . . 55
Figure 3.17 Synthetic training data set generation for model building . . . 60
Figure 4.1 Trajectory of vehicles around a Pspot . . . 68
Figure 4.2 Algorithm - Cooperative Process of VANET . . . 72
Figure 4.3 Classification Tree . . . 73
Figure 4.4 Bayes Network . . . 75
Figure 4.5 Sensitivity of the CT and NB models . . . 76
Figure 4.7 Accuracy of the impact region . . . 77
Figure 4.6 Average Travel Time on a signalized arterial during incidents happening at times T1 to T4 . . . 78
Figure 5.2 Vehicles exchanging via geographic routing information about the cause
of congestion . . . 90
Figure 5.3 Transactions created by vehicles on a congested road segment due to a Special event . . . 95
Figure 5.4 Transactions created by vehicles on a congested road segment due to an Incident . . . 96
Figure 5.5 Voting Procedure - Percentage of vehicles accurately estimating the cause of congestion in different scenarios . . . 101
Figure 5.6 Variation of the parameters of traffic flow on an edge . . . 101
Figure 5.7 Percentage of false alarms of the VP and BP . . . 103
Figure 5.8 Estimation accuracy of different methods in a scenario of congestion caused by weather . . . 104
Figure 5.9 Percentage of false alarms of the BF, VP and BP methods . . . 105
Figure 5.10 Comparative estimation accuracy of vehicles when congestion is due to recurrent traffic . . . 107
Figure 5.11 Percentage of false alarms of the BF, VP, BP and DAT methods . . 107
Figure 5.12 Monitoring of false alarms in the incident scenario . . . 109
Figure 5.13 Performance of β-DAT for a scenario of congestion due to recurrent traffic . . . 110
Figure 5.14 Percentage of false alarms in different methods . . . 110
Figure 5.15 Impact of penetration rate on the performance of the methods in the incident scenario . . . 111
Figure 5.16 Following distance of a moving vehicle in the base scenario . . . 113
Figure 5.17 85th percentile gap values of vehicles in different scenarios . . . 113
Figure 6.1 Propagation process of the connected vehicles to collect data . . . 129
Figure 6.2 Deployment of a RSU on the target segment . . . 131
Figure 6.3 Monitoring of traffic on segments 1-8 at time a)t, b) t+5, c) t+15 and, d) t+20 . . . 134
Figure 6.4 Multi-task learning DNN . . . 136
Figure 6.5 Demand data over a 24 hour period . . . 139
Figure 6.6 Profile of traffic flow on a signalised road segment . . . 140
Figure 6.7 Profile of traffic flow on a signalised road segment in advent on an incident . . . 140
Figure 6.8 MLPa is a standard net that learn STP. . . 141
Figure 6.9 MTLa learns STP and flow at t+5. . . 141
LIST OF SYMBOLS AND ABBREVIATIONS
ANN Artificial Neural Network
ARIMA AutoRegressive Integrated Moving Average BF Belief Functions
BP Back-Propagation CT Classification Tree CVs Connected Vehicles
DAT Data Assocition Technique DNN Deep Neural Network GPS Global Positionibg System
ITS Intelligent Transportation Systems LJT Link Journey Times
MLP Multi Layer Perceptron MTL MultiTask Learning NB Naive Bayesian
NRC Non Recurrent Congestion ns Network Simulator
Pspot Problematic spot
RF Random Forest
RMSE Root-Mean-Squared Error RP extraordinary event ResPonse RQ extraordinary event ReQuest RSU Road Side Units
SUMO Simulation of Urban MObility
TAPAS Travel and Activity PAtterns Simulation TIS Traffic Information Systems
V2I Vehicle-to-Infrastructure V2V Vehicle-to-Vehicle
VANET Vehicular Ad hoc NETworks VP Voting Procedure
CHAPTER 1 INTRODUCTION
With the increasing number of vehicles and limited expansion of paved roads, traffic conges-tion is to be expected. Road traffic congesconges-tion happens gradually as vehicles accumulate on a common path. Congestion is a particular state of mobility where travel times increase and more and more time is spent in vehicles. Apart from being a quite-stressful experience for drivers, congestion also have a negative impact on the environment and the economy. In this context, as the complexity of traffic increases, there is pressure on the authorities to take decisive actions to improve the network traffic flow. These actions include optimizing traffic elements such as traffic lights and turning restrictions, lane control, signal timing and route planning. By improving network flow, congestion is reduced and the total travel time of vehicles is decreased.
However, the location where traffic flow needs to be improved varies highly. Since the traffic state cannot be directly measured everywhere, infrastructure operators interpolate informa-tion from incomplete, noisy and local traffic data. They are strained to monitor traffic on the road network while using the least possible resources. To scale to larger cities, advan-ced monitoring techniques should be deployed and must be capable of aggregating traffic data feeds from various levels and at various levels of granularity. Also, the duration and timing of traffic events varies a lot making it difficult to monitor traffic in real time with the conventional monitoring mechanisms. To evaluate the traffic state in real time, operators necessitate extensive data sources to guarantee the accurate evaluation of the traffic state. Besides, well-tailored data sources may not always be available for a particular area of the traffic network. We see that future systems should enable continuous monitoring of the traffic condition along all roads of the traffic network.
One of the hot topics in Intelligent Transportation Systems (ITS) is the development of dis-tributed Traffic Information Systems (TIS) [1] . Such disdis-tributed systems monitor and collect data from many sources. These data provide enough comprehensive information in order to better characterize the events detected. Current techniques fail to process the knowledge acquired from the data. In the big data era, techniques should be implemented to make use of the acquired information. Agencies need to understand what is the cause affecting varia-bility on their facilities and to what degree so that they can take the appropriate action to mitigate congestion. Furthermore, at the current stage, the ITS is partially efficient since the vehicle is the only entity that is not contributing to the system. In fact, presently, vehicles are uninformative as they are not engaged in the process of traffic event detection. However,
equipped with a communication technology, vehicles can exchange information and coope-rate collectively so as to provide their input to the system. Models should be implemented to make use of the cooperation between vehicles to better assess the road traffic condition. Finally, knowing the volume of traffic heading toward a destination will give more insights about the expected demands in the near future. Indeed, traffic flow prediction allows ad-vanced modelling so that traffic managers take early actions to control the traffic flow and prevent the congestion state. However, current models need to be improve so as to allow fast and more accurate prediction.
In this thesis, to optimize the traffic flow in the transportation system in order to mitigate congestion, we propose the real-time distributed detection and classification of the compo-nents of congestion in urban traffic using connected vehicles. Via this next generation sensing technology, we are interested in identifying road traffic events on the basis of exchanging traf-fic flow data between vehicles. If connected vehicles can detect congestion and cooperatively attribute a possible cause to it, we believe that they can then transfer this knowledge in real time to an entity able to accurately predict flow on a road segment. The traffic flow prediction framework we introduce aims at evaluating anticipated traffic flow at future time frames on a target road segment based on real time feeds provided by connected vehicles and historical data. We show how this novel approach in this domain improves accuracy of prediction so that in real time, valuable information with regard to the potential impacts of the predicted flow can be disseminated to individual drivers and traffic management cen-ters can apply proactive strategies for recovering traffic conditions back to normality. The methods and models we proposed to solve the problems in this thesis are based on machine learning approaches. Since the transportation system is a highly correlated network, with characteristics such as large amounts of data and high dimensions of features, we show how artificial intelligence makes a promising approach for transportation research.
This chapter is divided as follows. Firstly, definitions and basic concepts related to our re-search are defined and explained to allow for a better understanding of the foundations of our research problem. Then, the addressed problem is described and research objectives are defined. Afterwards, we present the main research contributions and their originality. Finally, the structure of the thesis is outlined.
1.1 Definitions and basic concepts
This section aims at defining the terminology and concepts that will be used in the rest of the thesis, which will help the reader in better grasping the context of our work. We start by introducing the traffic flow theory and describing the microscopic and macroscopic
traffic variables. Then, the data collection methods are explained. Finally, a description of congestion and its components is elaborated.
1.1.1 Traffic flow Theory
In this section, we review the basic concepts related to the traffic flow theory. In transporta-tion engineering, traffic flow is the study of the interactransporta-tions between travellers, their vehicle and the infrastructure with the aim of understanding and developing an optimal transport network with efficient movement of traffic and minimal traffic congestion problems. Fig. 1.1 shows the interactions between the three elements of the road traffic network.
Figure 1.1 Road traffic network
The infrastructure in this context is the road with signage and traffic control devices. It has a quasi-stable geometric configuration. The density is calculated in terms of the number of vehicles per kilometer of road. We also count the number of lanes on a road and classify the infrastructure in terms of highway, road, street segments, lane, junction. The vehicles are of different sizes and are equipped with more and more powerful devices integrating se-veral technologies. Vehicle embedded systems include systems for collecting, processing and disseminating information in the perimeter of the vehicle. The multiple sensors, speedome-ter, wheel rotation sensors, rain sensors, reversing radars, Global Positioning System (GPS) and mobile phone which tends to be more and more connected to the vehicle by means of Bluetooth technology, the systems of detection by internal and external cameras, positioning sensors on the roadway, obstacle detection radars, they all provide information about the vehicle and its surroundings. Finally, the travellers is the key component of the road system. The traveller usually has a traveling purpose, which is to get from an origin to a destination in a certain period of time. The road traffic network is composed of segments. Each vehicle travels on the road traffic network along a trajectory composed of segments to get from an origin to a destination. It is only when these three elements of infrastructure, vehicles and
travellers are put together that there is traffic flow. Thus, traffic flow prediction approaches cannot be developed without an understanding of traffic flow theory.
Traffic flow theory is a recent field of transportation. It’s the characterization of flow through the laws of physics and mathematics. A general, unified and coherent theory has not yet been developed, and the problem has been tackled in different ways. There are different representations of the traffic flow. In what follows we expose the microscopic representation, the macroscopic representation and the variables associated with each representation.
1.1.1.1 Microscopic representation
At the most basic scale of observation, every vehicle is considered individually in the mi-croscopic representation. The following Fig. 1.2 shows the trajectories of eight vehicles on a space-time diagram [2].
Figure 1.2 Trajectories of eight vehicles on a space-time diagram
We describle below some microscopic variables of the circulation illustrated in the figure : — v : instantaneous speed, speed has the dimensions of distance divided by time, it is
the rate of change of the vehicle’s position.
— s : spacing, space separating the front of two successive vehicles at a given instant on the same lane, spacing and instantaneous speed are connected, s3 (t1) on the figure. — h : headway, duration of time between the passage of the front of two successive
vehicles. Headway is considered dangerous if h (x) <1 second. Traffic can be described in terms of headway, h3(x1) = s3(t1) / v.
— Travel time : time required to travel one unit of distance.
— Gap : distance between the rear of a vehicle and the front of the vehicle following it.
1.1.1.2 Macroscopic representation
The macroscopic scale represents the flows of vehicles at a high level of aggregation. It neglects everything that is not average behaviour. Macroscopic models can help characterize different states of the circulation from free flow to congested and cover larger areas, from a road segment to the whole road traffic network. There is a fundamental equilibrium relationship that connects the macroscopic variables. The three variables of the fundamental relationship are density, velocity and flow. We describle them here :
— u : average speed (km/h), average of all distance travelled by each vehicle divided by the duration of the time.
— q : flow (V/h, number of vehicles over time and can be represented by the average flow rate q(t1, t2, x) at the abscissa x between the instants t1 and t2 which is the ratio n(t1, t2, x) of the number of vehicles that passed by x between the two instants. — k : Density (V/km), distribution of vehicles in space. The link with the microscopic representation is that the average density is the inverse of the mean inter-vehicular distance or spacing.
The fundamental equilibrium relationship is : q (x, t) = u * k ( x, t) . It’s valid when all vehicles move at the same mean spatial velocity and its variables vary simultaneously as shown in Fig. 1.3 [2].
Figure 1.3 Flow-Speed-Density Relationship Diagrams
1.1.2 Traffic data collection
In this section, we present the concept of traffic data collection which refer to the monitoring of traffic by heterogeneous road equipments that measure and collect traffic variables such as traffic gap, density, speed, flow, etc. Subsequently, these data feeds are fused and aggregated to extract useful traffic information. This acquired knowledge from the processed data is used to compute optimal routes for the vehicles, short-term traffic forecasts to reduce road traffic congestion, improve response time to incidents, and ensure a better travel experience for commuters. Finally, a traffic management system can delivers this knowledge to the end users. Traffic data collection is an important phase of the traffic management system and should be done at short intervals to provide good quality because stale data is useless in dynamic environments. In transportation engineering, they rely mainly on the traditional methods based on the infrastructure, such as induction loops, cameras or sensors, to collect the macroscopic or microscopic traffic variables. On the other hand, collection methods done by the vehicles, are floating car data and recently using connected vehicles technologies. We present the traditional methods of collection and connected vehicles technology approach.
1.1.2.1 Traditional methods
Traffic data can be collected from fixed monitoring equipment, such as induction loops, sen-sors and cameras. Examples of infrastructure sensen-sors that are in-roadway include inductive-loop detectors, which are sawcut into the pavement ; magnetometers, which may be placed underneath a paved roadway or bridge structure ; and tape switches, which are mounted on
the roadway surface. Examples of over-roadway sensors are video image processors that uti-lize cameras mounted on tall poles adjacent to the roadway or traffic signal mast arms over the roadway ; microwave radar, ultrasonic, and passive infrared sensors mounted in a similar manner ; and laser radar sensors mounted on structures that span the lanes to be monitored [3].
While single inductive-loop detectors give direct information concerning vehicle passage and presence, gap, heading and spacing, other traffic flow parameters such as density and speed must be inferred from algorithms that interpret or analyze the measured data. When these pa-rameters are calculated from inductive-loop data, the values may not have sufficient accuracy for some applications (such as rapid freeway incident detection) or the available information may be inadequate to support the application (such as calculation of link travel time). Fur-thermore, the operation of inductive-loop detectors is degraded by pavement deterioration, improper installation, and weather-related effects. Street and utility repair may also impair loop integrity. Thus, a good loop installation, acceptance testing, repair, and maintenance program is required to maintain the operational status of an inductive-loop-based vehicle detection system.
Evaluation of over-roadway sensors show that they provide an alternative to inductive-loop detectors. Particularly, video image processing automatically analyze the scene of interest and extract information for traffic surveillance and management. Cameras can replace se-veral in-ground inductive loops, provide detection of vehicles across sese-veral lanes. They can classify vehicles by their length and report vehicle presence, density, lane occupancy, and speed for each class and lane. They can track vehicles and may also have the capability to register turning movements and lane changes. Vehicle density, link travel time, and origin-destination pairs are potential traffic parameters that can be obtained by analyzing data from a series of image processors installed along a section of roadway. However, installa-tion and maintenance, include periodic lens cleaning, require lane closure when camera is mounted over roadway. Their performance is affected by inclement weather such as fog, rain, and snow ; vehicle shadows ; vehicle projection into adjacent lanes ; occlusion ; day-to-night transition ; vehicle/road contrast ; and water, salt grime, icicles, and cobwebs on camera lens also, reliable night time signal actuation requires street lighting
In sum, although the traffic flow parameters measured with over-roadway sensors satisfy the accuracy requirements of many applications, infrastructure-based detectors provide fixed-points and short-section traffic information that is extracted from vehicles passing through the detection zone only. The traffic evaluation is restricted to surrounding locations that are close to these installed sensors. Moreover, it is expensive to install and to regularly maintain
these sensor equipments, especially in large downtown scenarios
On the other hand, monitoring can be done using mobile data sources such as GPS-based systems, floating car data of probe vehicle, which are methods based on the vehicle. Probe vehicles or mobile sensors appeared as a complementary solution to fixed sensors for in-creasing coverage areas and accuracy without requiring expensive infrastructure investment. Two popular types of mobile sensors are GPS-based and cellular-based. GPS-based sensors are sensors with GPS capability and cellular-based sensors are sensors that use information from cellular networks as traffic sensors. Cellular-based sensors are low in cost due to the large number of mobile phones and their associated infrastructures already in service. This potential source of traffic flow data is from cellular telephone companies who monitor the transmitting status of telephones that are engaged in conversations in support of the wireless enhanced all automatic location. The location of these telephones can potentially be made available to traffic management agencies and can assist in estimating congestion and travel time over wide areas. However, most of the probe vehicle techniques that are used for de-termining the link travel time make use of GPS technology. GPS-based sensors are far more efficient to pinpoint vehicle locations ; thus they can provide highly accurate vehicle move-ment information. But the major problem with GPS is that the accuracy of a typical GPS receiver is about 10 meters. This makes it difficult to pin-point a crossing for the purpose of congestion measurement. Secondly, it has been noticed that GPS sends erroneous velocity data even when the vehicle is stationary.
New technologies can be used to improve the accuracy, timeliness, and cost efficiency of data collection. In fact, researchers have been focusing their efforts on exploiting the advances in sensing, communication, and dynamic adaptive technologies to efficiently monitor the evolving critical road infrastructure [4], we present the Connected Vehicles (CVs) technology in the next section.
1.1.2.2 Connected Vehicles
Recently, the Intelligent Transportation System (ITS) research has shifted its focus to the next generation sensing technology, Vehicular Ad-hoc NETwork (VANET). The application of wireless technology to moving vehicles enables the creation of vehicular ad hoc networks, also called Connected Vehicles (CVs). Advances in to-Vehicle (V2V) and Vehicle-to-Infrastructure (V2I) wireless communications have increased the potential of real-time monitoring of traffic variables, for instance, in a distributed manner. Real-time distributed monitoring refers to the process by which macroscopic and microscopic traffic variables are collected by vehicles themselves without the need to send information to a traffic management
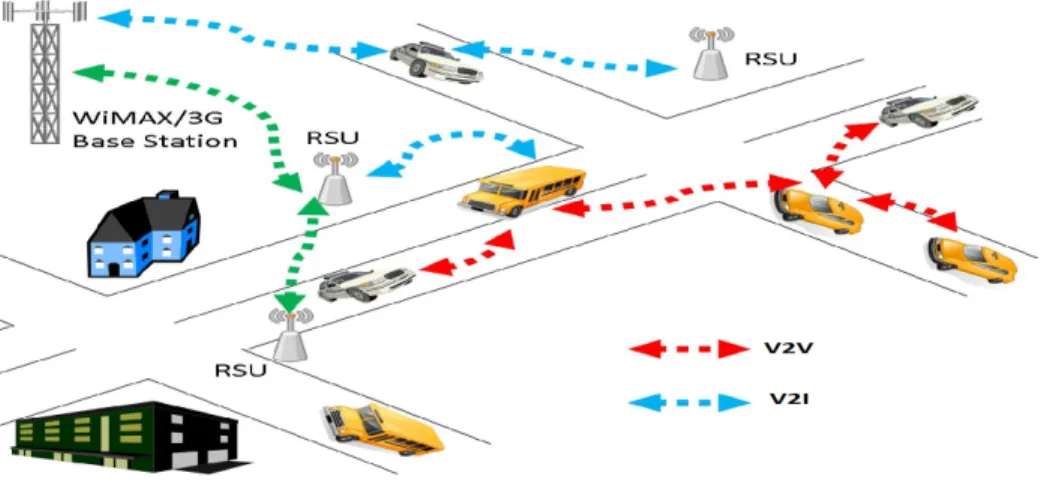
center. V2I refers to the communication between the vehicle and the Road Side Unit (RSU). Fig. 1.4 shows the interactions in a connected environment.
Figure 1.4 Vehicular ad hoc networks
The communication characteristics of a VANET are mostly based on a message called BEA-CON, periodically transmitted by each vehicle. Current VANET technology supports delivery of vehicle-to-vehicle BEACONs that are sent every 0.1 seconds. Therefore, networked cars can be extremely fast in warning their surroundings regarding events. By receiving BEA-CON messages, each vehicle therefore becomes ’aware’ of what or who is around it, as well as its mobility characteristics. Accordingly, these messages will be the primary communication mean to acquire data for traffic monitoring.
The BEACON message contains a part that is fixed and carries time-stamped basic vehicle state information, such as senderID, position, direction, current speed, acceleration, with optional information also possible. BEACONs can be correlated with their senders via sen-derID. A vehicle in a VANET can continuously collect BEACONs from other vehicles along his path and from those, estimate traffic characteristics representing the evolution of traffic over time on the road network. Consequently, a huge amount of traffic condition data can be archived at a vehicle level. A vehicle stores vehicles’ characteristics on each segment in information structures. Each structure consists of the following fields :
— SegmentID : The unique identifier of the road segment that this measurement belongs to.
— Time : Time of the measurement’s creation.
— SenderID : The unique identifier of the vehicle that created this measurement. — Position : Coordinates of the vehicle.
— Vinfo : Direction, speed and acceleration information of a vehicle.
After obtaining quantitative fine-grain traffic data, self-organized vehicular ad hoc networks can monitor the variation in traffic information of neighbour nodes in order to estimate real-time features.
1.1.3 Congestion
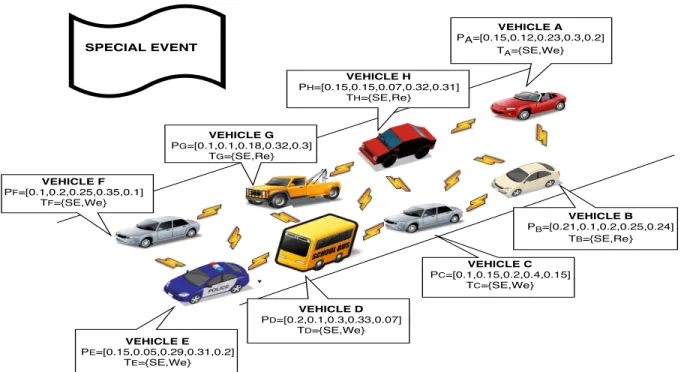
Congestion can be classified as recurrent and non-recurrent. Recurrent congestion refers to congestion that happens on a regular basis and usually occurs when a large number of vehicles use the limited capacity of the road network simultaneously. Non-recurrent congestion (NRC) in an urban network is mainly caused by incidents (accidents, vehicular breakdowns, police checks), workzones, special events (sport games, concerts, religious activities, political demonstrations), adverse weather[5].
Common causes of congestion are a widely investigated topic within the research community. Available research focus on studying the influence of a cause on traffic, such as the influence of weather, special events, incidents and workzones on traffic. In order to identify a set of variables representing spatial and temporal features of the components of congestion capable of distinguishing non-recurring congestion in an efficient way, we highlight from previous research key spatiotemporal characteristics and findings.
Inclement weather (rain, fog, snow, ice) has an impact on the fundamental macroscopic traffic flow variables (flow, speed and volume). It was also shown that microscopic traffic variables such as desired speed, desired acceleration and deceleration and minimum following distance parameters can be influenced during snowy road conditions for different reasons [6]. The free flow speed is defined by the speed driven when the driver is not influenced by nearby road users. Free speed is reduced to desired speed if the speed is influenced by other drivers, the road, characteristics of the vehicle, conditions such as weather and traffic rules (speed limits). For instance, drivers reduce their speed in order to avoid skidding in inclement weather. A reduction of desired speed, which reaches up to 30% for snowy roads, has been found. The reaction to adverse weather conditions varies between regions. As for the desired acceleration and deceleration, a slippery road reduces friction between road surface and tyres, thus drivers are not able to accelerate and decelerate as strongly as compared with dry road conditions, that is, maximum acceleration and deceleration decrease during snowy road conditions. Moreover, drivers reduce acceleration and deceleration to avoid skidding. Finally, drivers try to maintain a higher minimum following distance in order to cope with longer stopping distances caused by slippery roads [7]. From these findings, we assume that the features collected along a vehicle’s trajectory and experience on other road segment that
can help infer weather conditions are : higher minimum following distance, reduced desired speed and higher travel times on some segments of the trajectory.
Regarding special events (sport games, concerts, religious activities, political demonstra-tions), previous researches have highlighted that they may lead people to travel towards the same destination in a very limited time interval, and then to leave the venue again in a very short time span [8]. The impact of a special event on traffic has been thoroughly studied in [9] for different demand categories of people going to the event (inbound traffic) and lea-ving after its end (outbound traffic). Special events may cause congestion depending on the intensity of ingress traffic demand or sharp traffic surge in concentrated time span. Thus a special event has an impact on the traffic behaviour in a specific region over time. Such an impact region can be defined as the list of congested segments of the road network around the special event. From these findings, we conjoncture that the most informative features along a vehicle’s path that are the most informative of a special event traffic condition are firstly, the observed demand along the path in order to detect the presence of a sharp traffic surge. Also, if a vehicle experiences a NRC caused by a special event, then the vehicle is necessarily in the impact region of the event. Finally, if some road segments of the vehicle’s path are inside the impact region, and the travel time on those segments are abnormally high, then we may associate this characteristic to a congestion caused by a special event.
Incidents (emergencies, accidents, vehicular breakdowns, road defects, police checks) and workzones also have an impact on the traffic flow variables. Particularly, these events phy-sically block one or multiple lanes of the road segment. The blocked section of the road is called a problematic spot (Pspot) and can be defined by an interval of start and end point depending on the lane. No vehicles can traverse this section, thus reducing the capacity of the road. Trajectories of vehicles on a segment comprising a problematic spot cannot register coordinates of the blocked section. Regarding workzones, it was shown that if they happen at day time, especially at rush hours, their impact on traffic is severe, sometimes exceptionally larger than that of traffic accidents happening at the same time. On the other hand, if they happen at night, their impact is not that significant. Often times, workzones occupy the road segment a longer period of time than incidents because incidents are undesired and should be cleared as fast as possible. Thus, the duration of the Pspot is a good indicator of a workzone event.
Before we proceed, some definitions shall be highlited.
Definition 1 : A road segment is 5-tuple r = {s(x, y), e(x, y), l, r, T Th}. Where s and e are
the start and end point with location (x, y). l is the number of lanes. The road segment length is the Euclidian distance r between s and e. And the historical travel time T Th
is a list of average expected travel times in seconds every five minutes interval along that road segment.
Definition 2 : A road network is a graph RN = (N, E). Where E is the set of all road segments and N is the set of all road segments junctions.
Definition 3 : Trajectory is a sequence of connected road segments. It can be denoted as T = (r1, r2, ..., rn, ) where ri ∈ E.
Definition 4 : A trip is a vehicle movement from one place to another defined by the starting segment, the destination segment, and the departure time. A route is an expanded trip that means that a route definition contains not only the first and the last segment, but all segments the vehicle will pass along its trajectory.
With the above definitions, the traffic congestion problem can be formulated as follows. The observed travel time of a vehicle (oT T ) along a road segment on an urban road network is composed of recurrent delay (Drec) and non-recurrent delay, d, such as incident , workzone,
weather or special event induced delays.
oT T = Drec+ Dn−rec oT T = Drec+ 4 X i=1 (xi∗ d), where (1.1) 4 X i=1 xi = 1, xi = 0or1
Drec is the expected recurring travel time T Th that is location and time specific, based on
the fact that the average speed on roads are usually similar at the same time of different days of the week. In transportation there is a big difference between weekday and weekend traffic. Weekday traffic is usually worse than the weekend. Expected values are derived offline using past historical data for each segment. The preloaded digital maps available on the vehicular nodes may provide this traffic statistic of the roads at different time of the day. If the observed travel time on the segment is higher than a threshold, which is determined as in [10] by multiplying the congestion factor c with the expected recurring delay, the travel time is said to be excessive.
Based on the road traffic condition, if congestion is detected on a specific segment and excessive travel time delay is observed, the oT T in an urban network is composed of a recurrent delay and a non-recurring delay due to the other components of congestion such as incident, workzone, bottleneck, weather or special event.
1.2 Problem definition
In the context of road traffic congestion, many studies have been devoted to highways rather than highly congested urban regions. In a highway scenario, the road section can be modeled as a network flow model that require flow conservation on all segment. The amount of flow entering an arc equals the amount of flow leaving the arc. In an urban scenario, on the other hand, each arc of the underlying graph has an associated positive gain or loss factor. Flow passing through the arc is magnified or diminished by a factor. Therefore, the design of accurate and scalable models for urban road networks is required which are intricate, complex networks and far more likely to be monitored by the traffic authorities.
Also, currently, traffic state cannot be directly measured everywhere on the traffic road network. Infrastructure operators monitor traffic on the network while using the least possible resources. The location where traffic flow needs to be improved varies highly and certainly, deploying highly sophisticated equipment to ensure the accurate estimation of traffic flows and timely detection of events everywhere on the road network is not feasible, due to the limitation in financial resources to support dense deployment and the maintenance of such equipment, in addition to their lack of flexibility. In fact, at this time, monitoring techniques do not scale to large cities. Infrastructure sensors that are in-roadway include inductive-loop detectors, which are sawcut into the pavement ; magnetometers, which may be placed underneath a paved roadway or bridge structure ; and over-roadway sensors such as video image processors that utilize cameras mounted on tall poles adjacent to the roadway or traffic signal mast arms over the roadway ; microwave radar, ultrasonic, and passive infrared sensors mounted in a similar manner are not capable of evolving over time and covering increasingly large geographic regions To scale to larger cities, advanced monitoring techniques should be deployed and must be capable of aggregating traffic data feeds at various levels of granularity. Furthermore, the duration and timing of traffic events varies a lot. To evaluate the traffic state in real time, operators necessitate extensive data sources to guarantee the accurate evaluation of the traffic state. Current traffic data collection systems do not incorporate the ability of registring detailed information on the altering events happening on the road, such as vehicle crashes, adverse weather, etc. Operators require external data sources to retireve this information in real time. Besides, well-tailored data sources may not always be available for
a particular area of the traffic network. Future systems should enable continuous monitoring of the traffic condition along all roads of the traffic network based on real-time information. Moreover, traffic bottlenecks are disruption of traffic on a roadway caused either due to road design, traffic lights, accidents, work zones, weather condition, special events occurring in the region, etc. There are two general types of bottlenecks, stationary and moving bottle-necks. Stationary bottlenecks are those that arise due to a disturbance that occurs due to a stationary situation like narrowing of a roadway, an accident. Moving bottlenecks on the other hand are those vehicles or vehicle behaviour that causes the disruption in the vehicles which are upstream of the vehicle. Moving bottlenecks can be caused by heavy trucks as they are slow moving vehicles with less acceleration and also may make lane changes. Also, moving bottlenecks can be active or inactive bottlenecks. If the reduced capacity caused due to a moving bottleneck is greater than the actual capacity downstream of the vehicle, then this bottleneck is said to be an active bottleneck. If the reduced capacity of the truck is less than the downstream capacity, then the truck becomes an inactive bottleneck. This portrayal shows that there are many causes to congestion or bottlenecks. Current methods only detect congestion but it’s not enough, we should be able to better characterize the event causing it and distinguish between temporary induced traffic pattern change that is mitigated in a short period vs permanent pattern change. The existing methods can only quantify the spatial and temporal impact of the detected event. Agencies need to understand what is the cause affecting variability on their facilities and to what degree so that they can take the appropriate action to mitigate congestion.
The problem is that most existing works ignore the context information when proposing models in their study of traffic congestion. The context information can include : Time context (time of day), situation context (presence of traffic incident, workzone, weather condition or special event that occurred nearby in the region), trajectory context (travel time in the region), history context (past flows registered on road segments). While using all context dimensions will provide the most refined information and thus lead to the best performance, it is equally important to investigate which dimension or set of dimensions is the most informative if the task is to detect congestion, classify it or predict flow on a segment. The benefits of revealing the most relevant context dimension include reduced cost due to context information retrieval and transmission, reduced algorithmic and computation complexity and targeted active traffic control.
Many travellers have an overall sense of the status of traffic and the overall times until congestion at bottlenecks will likely start and end, based on their long-term experiences. People may be familiar with typical traffic patterns, some situations whether traffic states
of interest would be viewed as surprising. Current methods do not incorporate this overall sense, this experience, although the TIS is capable via its distributed systems to monitor and collect data from many sources. These data provide enough comprehensive information in order to better characterize the events detected. Current techniques fail to process the knowledge acquired from the data. With the widespread traditional traffic sensors and new emerging traffic sensor technologies, traffic data are exploding, and we have entered the era of big data transportation. In the big data era, techniques should be implemented to make use of the acquired information. Furthermore, at the current stage, the ITS is partially efficient since the vehicle is the only entity that is not contributing to the system. In fact, presently, vehicles are uninformative as they are not engaged in the process of traffic event detection. However, equipped with a communication technology, vehicles can exchange information and cooperate collectively so as to provide their input to the system because of the unpredictable nature of traffic and because of the myriad factors that affect traffic flows such as weather conditions, the behaviour of other drivers, traffic issues, and other events.
Knowing the flow of traffic heading toward a destination will give more insights about the ex-pected demands in the near future. Indeed, traffic flow prediction allows advanced modelling so that traffic managers take early actions to control the traffic flow and prevent the conges-tion state. However, current models need to be improved so as to allow fast and more accurate prediction. In fact, in addition to traditional traffic sensors, a variety of data sources, such as lidar, radar, and video from surveillance cameras, have emerged in traffic flow prediction research [11]. The problem is that traffic flow prediction heavily depends on historical and real-time traffic data collected from various sensor sources, including inductive loops, radars, cameras, mobile Global Positioning System, crowd sourcing, social media, etc. As the data originate from different sources, their conversion is the most important step. In this process, the first obstacle is the amount of data collected which is increasing exponentially, and the second is its complexity. This makes data conversion increasingly difficult and highly time and resource consuming. Relevant data extraction and cleaning, as well as data reduction, is required. Each of these tasks has its own challenges, including defining what is relevant and what is noise, identifying one or the other, and extracting the useful data, given certain accuracy expectations. In sum, data aggregation poses many challenges when a variety of data sources are required in the process of data collection.
On the other hand, the problem with current traffic flow prediction models is their inadap-tability of detecting and tracking the traffic patterns changes. There is a new pattern every time a non recurrent congestion occurs in the traffic flow and in this case, the model is not able to predict as accurately as when there is recurrent congestion. Existing approaches to traffic flow prediction do not adapt to the varying traffic situations because their
distribu-tion are memoryless, and they need a structure that will characterize the system at each step, not independently from the prior stage. To improve the flow prediction accuracy, the model should update from its normal path and track the changed traffic pattern, generating forecasts according to the new traffic pattern. A forecasting system will adjust its structure to accommodate the extraordinary patterns and the significant traffic flow pattern changes indicated will in turn drive the parameters of the short term forecasting system changing significantly to adapt to the traffic flow pattern change.
Finally, due to economic issues and lack of large scale deployment of connected vehicles tech-nology, currently no datasets are available for researchers to test their models. Consequently, simulation is the main choice in the validation of models based on vehicular ad hoc networks. Although many discreet-event network simulators, such as ns-2, ns-3, OPNET, OMNet++, and QualNet, have been widely used by the researchers to validate their ideas and approaches, they cannot be used in ITS scenarios without an accurate vehicular mobility model because this may lead to unrealistic configurations of traffic distribution in the environment resulting in false representations of the network topology and network partitioning in isolated groups of nodes [6], [12], [13]. The insufficiency common to all these plateforms is that they ignore the spatiotemporal variability of mobility patterns (temporal aspect and external influence modules). The variability is due to both mobility rate of vehicles that changes periodically during the same day and daily during the week, and the characteristics of the environment that may dynamically change at any time due to external events that may occur, such as accidents, weather condition, special event and workzones.
These problems have led to the elaboration of the following research questions that we ad-dressed thoroughly throughout the thesis :
— How are we going to collect microscopic and macroscopic traffic variables in real-time everywhere on the urban road traffic network since the location of congestion happening on the road varies highly and we don’t know when and on what road segment traffic congestion is going to install ?
— Can vehicles estimate the cause of congestion they experience on the road and cha-racterize it solely based on sensors they have on board and traffic flow theory and without any input from outside sources, such as weather information or police reports for incidents, etc. ?
— If vehicles can share their knowledge with the others in their vicinity, will they be able to better assess the traffic situation experienced or will they never conclude together on the real traffic condition because traffic is chaotic and multifaceted and each vehicle’s trajectory experience is different from the other ?