Évolution
tardi-quaternaire et morpho-stratigraphie
des
sédiments
du cratère des Pingualuit :
variation du niveau du lac,
origine
des mouvements de masse et influence
.
..
de la glaciation
WlsconSlnlenne
Mémoire présenté
dans le cadre du programme de maîtrise en océanographie en vue de l'obtention du grade de maître ès sciences
PAR
© PIERRE-ARNAUD DESIAGE
UNIVERSITÉ DU QUÉBEC À RlMOUSKI Service de la bibliothèque
Avertissement
La diffusion de ce mémoire ou de cette thèse se fait dans le respect des droits de son auteur, qui a signé le formulaire
«
Autorisation de reproduire et de diffuser un rapport, un mémoire ou une thèse». En signant ce formulaire, l'auteur concède à l'Université du Québec à Rimouski une licence non exclusive d'utilisation et de publication de la totalité ou d'une partie importante de son travail de recherche pour des fins pédagogiques et non commerciales. Plus précisément, l'auteur autorise l'Université du Québec à Rimouski à reproduire, diffuser, prêter, distribuer ou vendre des copies de son travail de recherche à des fins non commerciales sur quelque support que ce soit, y compris l'Internet. Cette licence et cette autorisation n'entraînent pas une renonciation de la part de l'auteur à ses droits moraux ni à ses droits de propriété intellectuelle. Sauf entente contraire, l'auteur conserve la liberté de diffuser et de commercialiser ou non ce travail dont il possède un exemplaire.Composition du jury :
Jean Carlos Montero Serrano, président du jury, UQAR-ISMER Guillaume St-Onge, directeur de recherche, UQAR-ISMER Patrick Lajeunesse, codirecteur de recherche, Université Laval Pierre Francus, examinateur externe, INRS
III
vu
Prenez le plus rêveur des rêveurs, plantez-le sur ses pattes, faites marcher ses pieds... il vous mènera sûrement à l'eau si l'eau existe dans ce pays.
REMERCIEMENTS
Je souhaiterais en premier lieu remercier mon directeur, Guillaume St-Onge, pour la confiance qu'il m'a accordée en m'offrant ce projet de maîtrise. Je suis très reconnaissant pour sa grande disponibilité, son soutien, sa passion communicative et ses efforts pour offrir à ses étudiants un cadre de travail agréable. Je souhaiterais enfin le remercier pour les nombreuses opportunités de missions, de cours spéciaux et de congrès qui m'ont été offerts au cours de ces deux dernières années.
Je souhaiterais également remercier mon co-directeur, Patrick Lajeunesse, pour avoir toujours été disponible lors de mes visites à l'Université Laval, pour ses connaissances et ses conseils notamment dans un domaine, la géomorphologie glaciaire, qui m'était pratiquement inconnu au début de ce projet. Je le remercie également pour les quelques jours passés dans les Alpes en juin 2013 avec son école d'été.
Mes remerciements vont également à Jean Carlos Montero Serrano et Pierre Francus pour leur participation à l'évaluation de ce mémoire de maîtrise.
l'aimerais également apporter toute ma gratitude à Alexandre Norrnandeau pour son soutien lors de la mission au cratère en septembre 2012. Je souhaite le remercier pour ses nombreux conseils lors du traitement de données et pour les conversations toujours enrichissantes lors des divers terrains/missions.
l'aimerais adresser une pensée particulière à mes parents en les remerciant pour leur soutien indéfectible durant mes (longues) études. Merci de m'avoir laissé le choix.
Finalement, cette maîtrise représente deux ans et demi de conversations de lab, de pauses café, de soupers de colloques, de voyages, de soirées, de discussions plus ou moins
constructives, de découverte du Québec, de repas du midi à l'Auriculaire, d'apéro, de potluck, de fins de semaine en Gaspésie ... Alors comment ne pas avoir une pensée pour Gab, Flo, Audrey, Eliott, Paul, Évou, Pl, Mich-mich, Charles, Elissa, Kat, Aline, Éva, Lauris, Mathieu, Lotus, Fanny, Yves, Quentin, Val, Sylvain, David, Mélany ...
RÉSUMÉ
Le cratère des Pingualuit, situé dans la péninsule d'Ungava (Nunavik, Canada), est un cratère d'impact de 1.4 Ma renfermant un lac de 246 m de profondeur. Le lac est un système fermé, uniquement alimenté par les précipitations atmosphériques depuis la dernière déglaciation. La présence d'un lac sous-glaciaire dans le cratère lors du dernier maximum glaciaire exclut l'érosion par les glaces des sédiments de fond. Ces caractéristiques ont potentiellement permis au cratère des Pingualuit des enregistrements sédimentaires paléo-climatiques et paléo-écologiques des derniers cycles glaciaireslinterglaciaires au niveau de la partie terrestre de l'Arctique canadien. Dans l'optique de définir la stratigraphie au fond du lac et de reconstruire 1 'histoire glaciaire tardi-quaternaire du cratère des Pingualuit, cette étude s'appuie sur des données provenant de trois expéditions conduites en mai 2007 (carotte sédimentaire d'une longueur d'environ 9 m), en août 2010 (~ 50 km de lignes sismiques) et en septembre 2012 (topographie à haute-résolution des parois internes à l'aide d'un LiDAR terrestre). Malgré la faible pénétration (~10 m) du profileur de sous-surface de 3.5 kHz causée par la présence de blocs dans la colonne sédimentaire, les données sismiques couplées à la stratigraphie de la carotte permettent l'identification de deux unités glacio-Iacustres déposées lors des dernières étapes du retrait de l'Inlandsis laurentidien au cratère. Deux dépôts postglaciaires associés à des mouvements de masse ont également été identifiés sur les pentes et dans la partie profonde du bassin du cratère. La topographie à haute-résolution des pentes internes du cratère générée à partir des données LiDAR a permis de mettre en évidence un ancien niveau de lac à 545 m et de déterminer les altitudes des exutoires à l'origine de drainage. De plus, la cartographie des formes glaciaires à partir de l'interprétation de photos aériennes a rendu possible le paramétrage d'un nouveau modèle présentant la déglaciation et le drainage du lac du cratère des Pingualuit. Le modèle suggère trois phases principales de drainage en fonction de l'activation de sept exutoires suite au retrait vers le sud-ouest de l'Inlandsis laurentidien. Finalement, par opposition à d'autres lacs de cratère de haute latitude à l'image du lac EI'gygytgyn (nord-est de la Sibérie) et de Laguna Potrok (secteur méridional de la Patagonie) dans lesquels des enregistrements paléo-climatiques à haute résolution ont été reconstitués grâce à un taux d'accumulation sédimentaire élevé, les données sismiques du lac du cratère des Pingualuit suggèrent un taux de sédimentation très faible suite au retrait de l'Inlandsis laurentidien en raison de l'absence d'affluents dans le lac.
Mots clés: Lac de cratère; Déglaciation; LiDAR terrestre; Modelés glaciaires; Variations du niveau de lac; Paléo-rivages; Profiles de sismique réflexion; Ungava
X 111
ABSTRACT
The Pingualuit Crater, located in the Ungava Peninsula (Northern Québec, Canada) is a 1.4 Myr old impact crater hosting a 246 m deep lake. The lake is a closed system, fed only by atmospheric precipitation since the last deglaciation. The existence of a subglacial lake in the crater during the Last Glacial Maximum (LGM) precluded glacial erosion of the bottom sediments. These characteristics have potentially allowed the Pingualuit Crater Lake to preserve paleoclimatic and paleoecological sedimentary records of the last glacial/interglacial cycles in the terrestrial Canadian Arctic. In order to define the stratigraphy in the lake and to reconstruct the Late-Quaternary glacial history of the Pingualuit Crater, this study investigates data from three expeditions carried out in May 2007 (- 9 m long sediment core), in August 2010 (- 50 km of sei smic lines) and in September 2012 (high-resolution terrestrial LiDAR topography of the inner slopes). Despite the weak penetration (~1 0 m) of the 3.5 kHz sub-bottom profiling caused by the presence of blocks in the sedimentary column, sei smic data coupled with stratigraphy from the sediment core enabled the identification of two glacio-lacustrine units deposited during the final stages of Laurentide Ice Sheet (LIS) retreat in the crater. Two postglacial mass movement deposits were also identified on the slopes and in the deep basin of the crater. The high-resolution topography of the internaI slopes of the crater generated from the LiDAR data permitted the confirmation of a paleo-Iake level at 545 m and determination of the altitudes of drainage outlets. Furthermore, the mapping of glacial and deglacial landforms from air photo interpretation of the area allowed the setting of a new model for the deglaciation and drainage of the Pingualuit Crater Lake. The model proposes three main phases of lake drainage, based on the activation of seven outlets following the retreat of the LIS front towards the south-west. Finally, as opposed to other high-Iatitude crater lakes such as Lake EI'gygytgyn (northeastern Siberia) or Laguna Potrok (southern Patagonia) where high-resolution paleoclimatic records were reconstructed due to high sediment accumulation rates, the seismic data from the Pingualuit Crater Lake suggest very low sedimentation rates after the retreat of the LIS owing to the absence of tributaries in the lake.
Keywords:
Crater Lake; Deglaciation; Terrestrial LiDAR; Glacial Landforms; lake-level variations; Paleo-shorlines; Seismic reflection profiles; UngavaTABLE DES MATIÈRES
REMERCIEMENTS ... IIX
RÉSUMÉ ... XI
ABSTRACT ... XIII
TABLE DES MATIÈRES ... XV
LISTE DES FIGURES ... XVII
INTRODUCTION GÉNÉRALE ... 1
Problématique ... 1
Objectifs généraux ... 3
Expéditions et méthodologie ... 4
Organisation du mémoire et contribution ... 7
Présentations lors de congrès ... 8
CHAPITRE 1 MORPHOLOGY AND LATE-QUATERNARY EVOLUTION OF THE PINGUALUIT CRATER LAKE BASIN, NORTHERN QUÉBEC (CANADA) ... 9
1. INTRODUCTION ... 9
2. STUDY AREA ... 11
3. METHODOLOGY ... 16
4. RESUL TS ... 20
5. DESCRIPTION AND INTERPRETATION OF THE SEISMIC SURVEY ... 28
6. DISCUSSION ... 34
7. CONCLUSIONS ... 42
8. ACKNOWLEDGMENTS ... 43 xv
CHAPITRE 2 CONCLUSION ... 46 RÉFÉRENCES BIBLIOGRAPHIQUES ... 49
XVll
LISTE DES FIGURES
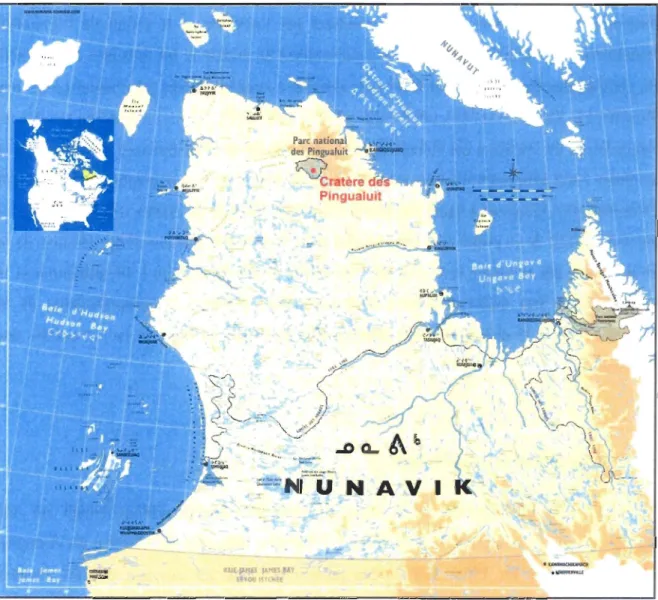
Figure 1. Photographie du cratère des Pingualuit prise lors de la mission en septembre 2012; crédit photo : Pierre-Arnaud Desiage ... 2 Figure 2. Localisation du cratère des Pingualuit (Adapté de nunavik-tourism.com) ... 3
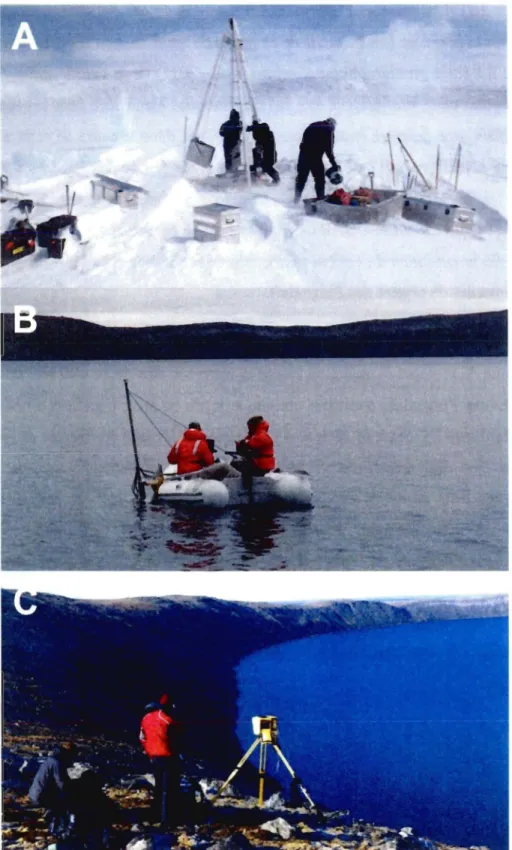
Figure 3. Photographies des trois expéditions conduites au cratère en 2007 (A), 2010 (B) et 2012 (C); crédit photo : Richard Niederreiter, Grégoire Ledoux et Pierre-Arnaud Desiage ... 6
Figure 4. Location of the Pingualuit Crater Lake in the Ungava Peninsula. Black and white arrows show the main ice flow directions (Payne and Ungava) determined from accumulation and erosional features (Bouchard and Marcotte, 1986; Daigneault and Bouchard, 2004). The dashed line illustrates the ice divide (Daigneault and Bouchard,
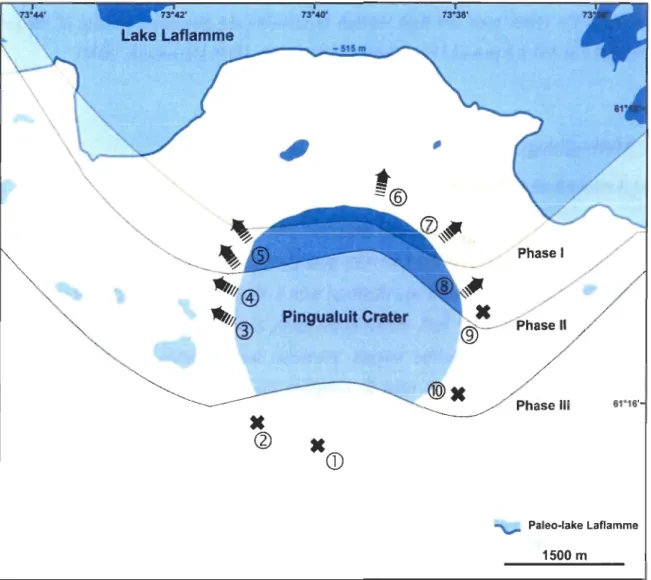
2004) and the white line marks the limit between the Ungava Peninsula and Hudson Bay watersheds. Realisation: Département de Géographie, Université Laval, 2013 ... 11 Figure 5. Conceptual model for deglaciation of the Pingualuit Crater Lake suggested by
Bouchard and Saamisto (1989). Black arrows show the crater rim channels hosting
outflows, whereas black crosses illustrate channels not affected by drainage. The numbers indicate the ten channels in the crater rim according to Bouchard and Saamisto (1989). Also illustrated is the pro glacial Lake Laflamme at its maximal level (~ 515 m a.s.l.) (Bouchard and Saamisto, 1989) ... 15 Figure 6. Location on an aerial photography (1 :20 000) of seismic-reflection profiles
collected in August 2010 (Ledoux et al., 20 Il), the sediment core collected in May
Figure 7. A coupled topography-bathymetry model of the eastern part of the Pingualuit Crater (dashed red frame). Mid-resolution bathymetry obtained by interpolation between seismic transects and high-resolution topography generated from LiDAR data ... 19
Figure 8. Geomorphological map of the Pingualuit Crater Lake basin illustrating the identified glacialldeglaciallandforms and hydrological features (see text for details) 21
Figure 9. Aerial photographs of glacialldeglacial landforms and hydrological features in the Pingualuit Crater Lake basin. A) Hummocky moraines in the sector of Lake Laflamme; B) Streamlined forms (black lines) and paleo-shorelines (dashed lines) in the southern part of Lake St-Germain; C) Esker (multiple black arrows) and terminal part of outflow channel linked to outlet 10 (Fig. 12); D) North-East outlets (black arrow) of the Pingualuit Crater Lake and associated outflow channels ... 21
Figure
10.
DEM of the Pingualuit Crater using high-resolution topography of the internai slopes and mid-resolution bathymetry. Elevation of the crater rim channels are indicated in meters (a.s.l.) (black brackets) and paleo-shorelines at 545 m a.s.l. are highlighted with white and yellow lines. The yellow eyes represent the field of view illustrated in figures Il a and b ... 224Figure 11. Paleo-shorelines at the altitude of 545 m a.s.l. (black circles). The location of the two sites is indicated in Fig. 8 ... 25
Figure 12. Photograph presenting the mouth of outlet 10 with boulders washed and grouped by outflows. Photo credit: Alexandre Normandeau ... 26
Figure 13. Seismic line (location in Fig. 6) from a North-South profile illustrating in A) a typical profile of the seismic reflection of the crater with the very low acoustic penetration; and in B) the two mass movement deposits (mass movements 1 and 2) and the three seismic units (U1, U2 and U3) identified in the deep basin of the Pingualuit Crater. The cross indicates the coring site ... 29
XIX
Figure 14. Isopach maps from the Pingualuit Crater Lake. Maps A and B illustrate the thickness of units 2 and 3 in the deep basin. Map C is showing the estimated orientation and maximum thickness of multiple mass movements linked to mass movement 2 ... 31 Figure 15. Photograph illustrating the steep internaI subaerial and subaqueous si opes
covered by large blocks and boulders. Photo credit: Grégoire Ledoux ... 33 Figure 16. Topographical map of the Pingualuit Crater Lake basin presenting the potential paleo hydrology since the beginning of the deglaciation of the crater. The black arrows are showing the crater rim channels involved in the lake drainage ... 36 Figure 17. Conceptual model for the deglaciation of the Pingualuit Crater Lake. The lake level indicated is the lowest lake level to maintain the exoreic drainage during each phase ... 39
INTR
OD
UCTI
O
N GÉNÉRALE
Problématique
L'Arctique est actuellement le théâtre de bouleversements climatiques majeurs dont l'échelle et les conséquences avérées sur le système climatique global sont encore peu connues (e.g., ACIA, 2005; Otto-Bliesner et al., 2006; Overpeck et al., 2006). La compréhension des changements climatiques en Arctique nécessite de connaitre les variations des conditions environnementales dans cette région au cours du temps. Dans cette optique, les enregistrements sédimentaires des lacs de haute latitude représentent des archives exceptionnelles pour retracer ces variations de conditions environnementales en raison des indicateurs physiques, chimiques et biologiques qu'ils renferment (Pienitz et al., 2004). Cependant, de nombreux lacs de l'hémisphère Nord, notamment en Arctique, se révèlent inexploitables pour les reconstructions paléo-climatique. En effet, une grande partie de ces lacs sont trop jeunes, leur mise en place lors du retrait des glaciers remontant seulement à l'Holocène. De plus, les sédiments de lacs plus anciens ont été érodés et remobilisés par le passage des glaces lors des dernières glaciations (Pienitz et al., 2008). Ainsi malgré leurs qualités singulières, les études basées sur des enregistrements sédimentaires continentaux lacustres ne représentent qu'une faible proportion de la recherche paléo-climatique et paléo-environnementale en comparaison aux nombreux travaux effectués sur des carottes prélevées dans le milieu marin (e.g. Helmke et al., 2002; Spielhagen et al., 2004; de Vernal et Hillaire-Marcel, 2008).
Durant le dernier maximum glaciaire, le lac du cratère des Pingualuit, Nunavik (Figure 1 et 2), formé par un impact météoritique il y a environ 1,4 millions d'années, était
également recouvert par un glacier atteignant près de deux kilomètres d'épaisseur dans ce secteur, l'Inlandsis laurentidien (Grieve et al., 1991; Dyke et al., 2002; Marshall et al., 2002). Cependant, la morphologie du cratère, ses parois abruptes, sa grande profondeur (246 m), et sa localisation proche du centre de dispersion du glacier, limitant ainsi le déplacement des glaces, auraient permis la formation d'un lac sous glaciaire dans le cratère lors de la dernière glaciation. Les sédiments présents au fond du lac auraient ainsi été préservés de l'action érosive des glaces (Bouchard, 1989b; Guyard et al., 2011). Ces caractéristiques confèrent au lac du cratère des Pingualuit un grand potentiel pour l'enregistrement et l'étude de la dynamique climatique, notamment les dernières successions de périodes glaciaires/interglaciaire dans la péninsule d'Ungava depuis 1,4 millions d'années (Bouchard, 1989b). Ainsi, au cours des dernières années, une carotte d'environ 9 m a été prélevée et plusieurs recherches ont été conduites dans le cadre du projet international dirigé par le professeur Reinhard Pienitz (u. Laval) et intitulé " The Pingualuit Crater Lake Project " afin de déterminer les variations paléoclimatiques au Nunavik à partir des sédiments du cratère des Pingualuit (Black et al., 2010; Girard-Cloutier, 2011; Guyard et al., 2011; Luoto et al., 2013).
Figure 1. Photographie du cratère des Pingualuit prise lors de la mission en septembre 2012; crédit photo:
....
"'E ",HES JA~ES 'AV 'WOVlqCHEE
Figure 2. Localisation du cratère des Pingualuit (Adapté de nunavik-tourism.com).
Objectifs généraux
~
.
-3
Dans ce contexte, le premIer objectif de cette maîtrise était d'améliorer les connaissances concernant la géomorphologie et l'histoire tardi-quaternaire de la région du cratère des Pingualuit afin de fournir un contexte géologique et climatique aux archives paléo-climatiques prélevées dans le lac. Dans le secteur du cratère, le dernier évènement glaciaire a été documenté et décrit à l'aide de l'identification et de la cartographie des
structures et des formes glaciaires engendrées par l'avancée et le retrait de l'Inlandsis laurentidien. Les phases de déglaciation successives du cratère et les brusques évènements de vidange des eaux du lac qui leurs sont associées, suggérées dans un premier temps par Bouchard et Saarnisto (1989), ont été discutées et actualisées. Ainsi, un nouveau modèle de déglaciation du cratère a été élaboré à l'aide des nouvelles connaissances provenant de la première carte géomorphologique centrée sur ce secteur et de la topographie LiDAR (Light
Detection And Ranging) à haute résolution des pentes internes du cratère des Pingualuit. Le second objectif de ce projet était de présenter pour la première fois une étude détaillée de la stratigraphie par sismique réflexion sur l'ensemble du lac du cratère. L'identification et la caractérisation des faciès sismiques nous permettant d'affiner la compréhension de la sédimentation et la distribution des mouvements de masse au fond du lac du cratère des Pingualuit.
Expéditions et méthodologie
La base de réflexion de ce projet de maîtrise s'appuie principalement sur une dizaine d'articles compilés dans le livre" L 'histoire naturelle du Cratère du Nouveau
Québec " publié en 1989. Les études présentées dans cet ouvrage ont été menées consécutivement à une expédition scientifique conduite par Michel A. Bouchard (Université de Montréal) au cours de l'été 1988. Le but de cette mission pluridisciplinaire était d'étudier divers aspects du cratère, tel que sa genèse et son histoire, sa morphologie, la stratigraphie des sédiments du lac ou la faune et la flore qu'il héberge (Bouchard, 1989c). L'étude présentée dans ce mémoire de maîtrise est fondée sur des données provenant de trois expéditions scientifiques effectuées au cratère des Pingualuit lors des sept dernières années. En mai 2007, une équipe internationale a récupéré la carotte sédimentaire d'environ 9 m à l'aide d'un carottier à gravité UWITEC installé sur le lac gelé (Figure 3A). La seconde mission, conduite en août 2010 par une équipe de l'Université Laval et de l'ISMER-UQAR, a permis l'acquisition d'une cinquantaine de kilomètres de profils sismiques à partir du profileur de sous-surface Knudsen Chirp 3212 d' une fréquence de 3.5
5
kHz (Figure 3B). L'analyse et l'interprétation détaillée de ces données sismiques ont été réalisées pour la première fois au cours de ce projet de maîtrise. Ces résultats ont également été couplés à l'étude stratigraphique (Guyard et al., 2011) de la carotte prélevée en 2007
afin d'extrapoler cette stratigraphie aux unités sismiques identifiées dans les sédiments du lac. Finalement, une dernière expédition a été effectuée dans le cadre de cette maîtrise sur
le cratère en septembre 2012 afin de réaliser des levés des pentes internes à l'aide d'un
système de télédétection par laser (LIDAR) (Figure 3C). Durant cette expédition dirigée par Guillaume St-Onge (ISMER-UQAR), 35 levés ont été enregistrés à partir de 19 sites sur
l'ensemble de la couronne du cratère permettant de modéliser et générer en 3D la totalité des parois internes du cratère des Pingualuit.
Par ailleurs, le parc national des Pingualuit (Figure 2) a vu le jour en janvier 2004
dans l'optique de protéger et mettre en valeur le cratère et plus de Il 000 km2 du Plateau de l'Ungava. Le lac Pingualuk, considéré comme le joyau du parc, bénéficie d'une protection extrême interdisant l'accès à ce secteur à l'exception d'équipes éducatives et scientifiques soumises à des réglementations techniques et environnementales strictes. Dans ces
conditions, les trois dernières expéditions menées au cratère ont été réalisées avec des précautions environnementales accrues, incluant notamment l'utilisation de moteurs
électriques dans l'enceinte du cratère et le maintien des moteurs thermiques sur des plate-formes adaptées à l'extérieur de la couronne. L'organisation et la réalisation de ces
expéditions ont également été effectuées en collaboration et avec le soutien remarquable des responsables du parc des Pingualuit, des guides du Parc et de la communauté inuit de Kangiqsujuaq.
Figure 3. Photographies des trois expéditions conduites au cratère en 2007 (A), 2010 (B) el 2012 (C); crédit photo: Richard Niederreiter, Grégoire Ledoux et Pierre-Arnaud Desiage.
7
Organisation du mémoire et contribution
Ce mémoire est présenté sous la forme d'un article scientifique rédigé en anglais présentant la morphologie du cratère des Pingualuit et une reconstitution de son histoire glaciaire depuis la dernière glaciation. L'article devrait être soumis prochainement à la revue Geomorphology ou Earth Surface Pro cesses and Landforms.
Desiage, P-A., Lajeunesse, P., St-Onge, G., Norrnandeau, A., Ledoux, G., Guyard,
H., Pienitz, R., (sera soumis prochainement). Morphology and Late-Quaternary evolution of the Pingualuit Crater Lake basin, northern Québec (Canada). Geomorphology ou Earth
Surface Pro cess es and Landforms.
La réalisation de ce projet de recherche m'a conduit à participer à la troisième expédition au cratère des Pingualuit. Durant les 15 jours sur le terrain, mon rôle, en collaboration avec les autres participants de la mission et co-auteurs de l'article, Guillaume St-Onge et Alexandre Normandeau, consistait à sélectionner les sites de levés, manipuler le LiDAR et vérifier la qualité et le bon recouvrement des données. J'ai réalisé la
numérisation et l'interprétation des photographies aériennes principalement à l'Université Laval en collaboration avec Patrick Lajeunnesse et le Laboratoire de Géomorphologie marine. Le traitement des données géophysiques et l'analyse de la stratigraphie ont été effectués à ISMER-UQAR à partir des travaux préliminaires de Grégoire Ledoux et d'Hervé Guyard. J'ai également généré et interprété la topographie à haute résolution des
parois internes du cratère à partir des données LiDAR avec le soutien d'Alexandre Normandeau, Guillaume St-Onge et Patrick Lajeunesse. La rédaction et la majorité des figures de l'article ont été réalisées par mes soins et révisées par mes deux co-directeurs et co-auteurs de cet article Patrick Lajeunesse et Guillaume St-Onge.
Présentations lors de congrès
De plus, dans le cadre de ce projet de maîtrise, j'ai eu la chance de participer aux congrès/colloques ci-dessous.
Desiage, P-A., St-Onge, G., Lajeunesse, P., 2013. Morphostratigraphic study of Pingualuit crater lake: Lake level variations and mass movements influence. Présentation orale lors du congrès annuel des étudiants du GEOTOP, 1-3 février 2013, Wentworth-Nord CQC) Canada.
Desiage, P-A., St-Onge, G., Lajeunesse, P., Normandeau, A., 2013. Morphostratigraphic study of Pingualuit crater lake, Nunavik: Initial LiDAR results. Poster
lors du 43rd Annual International Arctic Workshop, 11-13 mars 2013, Amherst (MA) USA. Desiage, P-A., St-Onge, G., Lajeunesse, P., Normandeau, A., Pienitz, R., Guyard, H.,
2013. Le cratère des Pingualuit: comprendre son histoire géologique pour retracer le climat quaternaire arctique. Présentation orale lors du colloque de vulgarisation scientifique La nature dans tous ses états, 21-23 mars 2013, Rimouski CQC) Canada.
CHAPITRE 1
MORPHOLOGY AND LATE-QUATERNARY EVOLUTION OF THE
PINGUALUIT CRATER LAKE BASIN, NORTHERN QUÉBEC (CANADA)
9
Pierre-Arnaud Desiagea,b, Patrick Lajeunesseb,c, Guillaume St-Ongea,b, Alexandre NormandeauC, Grégoire LedouxC, Hervé Guyarda,b, Reinhard PienitzC
,
aCanada Research Chair in Marine Geology, Institut des sciences de la mer de Rimouski (ISMER), UQAR, Rimouski, Canada
bGEOTOP Research Center, Canada
CCentre d'études nordiques (CEN) & Département de Géographie, Université Laval, Québec, Canada
1. Introduction
In recent years, the Pingualuit Crater Lake, Nunavik (FigA), has sparked a renewed interest in palaeoc1imatology research in the Ungava Peninsula (Black et al., 2010; Girard-Cloutier, 20 Il; Guyard et al., 20 Il; Luoto et al., 2013). High-latitude lakes are excellent archives of past c1imatic and environmental variations due to the sediments they can preserve (Pienitz et al., 2004). Despite the presence of the Laurentide Ice Sheet during the
Last Glacial Maximum (~21 ,000 years ago; Clark et al., 2009), the morphology of the
eroslOn of the bottom sediments (Bouchard, 1989b; Guyard et al., 20 Il). These characteristics give the Pingualuit Crater Lake sediments the potential to record successions of glacial/interglacial periods in the Ungava Peninsula since 1.4 Ma (Bouchard, 1989b). Furthermore, the Pingualuit Crater Lake has similar characteristics to lakes recently studied in the context of International Continental scientific Drilling Program (ICDP) projects for their potential in paleoclimatic research, such as the EI'gygytgyn Crater Lake in 2008/09 and Laguna Potrok Aike in 2008 (Melles et al., 2012; Zolitschka et al., 2013 and papers in the special issue). EI'gygytgyn Crater Lake, also located in the Artic (67.5°N, 172°E) and formed by a meteoritic impact, escaped Northern Hemisphere glaciation due to its location in the center of Beringia (Brigham-Grette et al., 2007). Laguna Potrok Aike, located in
south-eastem Patagonia (Argentina), and the Pingualuit Crater Lake have a similar
morphology with a high depth-to-area ratio, allowing the potential accumulation of long sedimentary record (Bouchard 1989a; Anselmetti et al., 2009).
This study aims to reconstruct the Late-Quatemary glacial and deglacial history of the Pingualuit Crater Lake basin based on recently acquired seismic and LiDAR data. This new information will contextualize the paleoclimatic archives recovered in the lake (Guyard et al., 20 Il) and allow reconstructing successive stages of crater deglaciation and the resulting rapid drainage events of the lake, first suggested by Bouchard and Saarnisto (1989).
'\ ( ./ Ice Flow
...
~ \ J{ucfson 'Bay Limit watershed / Ice Divide . ~.".
.~ Payne ',;>-Ungava Altitude (ml 600 500 400 300 '''-200"
100 "7-WATERSHED HUDSON BAY 75° 50 km 60° 'Ungava 'Bay IlFigure 4. Location of the Pingualuit Crater Lake in the Ungava Peninsula, Black and white arrows show the main ice flow directions (Payne and Ungava) determined from accumulation and erosional features (Bouchard
and Marcotte, 1986; Daigneault and Bouchard, 2004), The dashed line illustrates the ice divide (Daigneault and Bouchard, 2004) and the white line marks the limit between the Ungava Peninsula and Hudson Bay watersheds, Realisation: Département de Géographie, Université Laval, 2013,
2. Study area
The Pingualuit Crater, located in the Ungava Peninsula (Nunavik, Canada; FigA) is a simple crater created by a meteoritic impact ca. lA million years ago as determined by Ar-dating of impactites collected nearby (Bouchard and Marsan, 1989; Grieve et al. 1991). The crater is a 410 m deep (rim-to-basin) and 3A km wide (rim-to-basin) near circular depression whose rim reaches a maximum altitude of 657 m above sea level (a.s.l), which
is one of the highest peak in Ungava. This summit rises to 163 m above the surface (494 m a.s.l) of an ultraoligotrophic 246 m deep and 2.8 km wide lake hosted by the crater. Since the last deglaciation this transparent water lake (33 m Secchi depth in August 2010; Guyard
et aL, 2011) has been a closed hydrological and sedimentary basin with no tributaries as the
lake is only fed by atmospheric precipitation (Guyard et aL, 2011). However, 818
0
measurements made by OueUet et al. (1989) from water from (into) the Pingualuit Crater Lake and the adjacent Lake Laflamme suggest a potential cryptorheic drainage system
across a fault plan linking both lakes (Currie, 1965). The water flowing of the Pingualuit
crater area are drained by the Vachon River across the Ungava Bay catchment basin. However, the northernmost part of this area is adjacent to the Puvirnituq River, one of the main ri vers of the Hudson Bay catchment basin (Fig.4; Daigneault, 2008).
The crater is located in the Archean-age Superior Province of the Canadian Shield.
Bedrock geology consists of a blend of plutonic rocks, mostly granitoids, cut by sorne basic dykes (Currie, 1965; Bouchard and Marsan, 1989). The ground surface consists of blocks,
gravels and a 0-2 m-thick discontinuous till. Furthermore, dozens of erratic boulders of
dolomite from the Proterozoic Cape-Smith Belt, situated about 40 km north, have been
counted in the crater area (Bouchard et al., 1989). The rim and steep inner slopes (26-35°)
are also strewn with boulders and rocks strongly mineralized with epidote and hematite,
and altered with seri cite (Currie, 1965). These slopes terminate on an asymmetric basin
constituted by a plateau in the south-west part of the lake and a deep basin in the north-east
part of the lake (Bouchard and Marsan, 1989). Bouchard (1989a) accounts for this morphology by intense sediment inputs from the south-west during the last deglaciation.
Interpretation of seismic data, acquired during a 1988 expedition, by Moussawi and Tessier
(1989), suggests thick deposits of till and/or gravels intersected by fine clay layers
(thickness between 1 and 2 m). The chaotic seismic signal furthermore reveals the presence
of blocks throughout the sediments with the exception of the upper 25 m of the deep basin,
where sediments are finer. Reflectors indicate a potential accumulation of at least 73 m of
sediments on the plateau and 93 m in the deep basin (Moussawi and Tessier, 1989;
13
deposits in the crater by a rain-out and reworking of sediments from melting ice and/or by dense flows originating frorn glacial retreat. The stratigraphy of a ~ 9 rn-long core retrieved in 2007 from the deep basin reveals subglacial, and pro glacial lacustrine depositional conditions during the last deglaciation and organic-rich intervals corresponding to ice-free conditions during postglacial times (Guyard et al., 2011). This stratigraphy will be integrated with the discussion of sei smic surveys hereinafter.
Regional glacial/deglacial history
During the last glaciation, northem Ungava remained glaciated from the end of the Sangamonian (marine isotopic substage 5e; ~ 123,000 years ago; Lisiecki and Raymo, 2005) to the Holocene deglaciation (Daigneault, 2008). In the Pingualuit Crater Lake basin, two distinct glacial movements have characterized the last glaciation: the Ungava and Payne flows (Gray and Lauriol, 1985; Bouchard and Marcotte, 1986). The first one originated from the Ungava center in the central part of the Ungava Peninsula and was oriented south-east (azimuth 110°) in the study area, whereas the second originating from the Payne center was oriented north-east (azirnuth 45°) (Fig.4; Currie, 1965; Bouchard et al., 1989a; Daigneault and Bouchard, 2004). During this second glacial movement, the Payne flow covered the main part of the Ungava peninsula. This relative chronology is supported in the crater area, by the greatest abundance of geomorphological features being associated with the Payne flow (Bouchard et al., 1989a; Daigneault and Bouchard, 2004).
Deglaciation of the Ungava peninsula began on the southem coast of the Hudson Strait between 10.5 kyr BP and 7 kyr BP, and progressed toward the Ungava plateau (Gray and Lauriol, 1985; Dyke and Prest, 1987; Lauriol and Gray, 1987; Bruneau and Gray, 1997; Gray, 2001; Daigneault and Bouchard, 2004; Saulnier-Talbot and Pienitz, 2010). In the Pingualuit Crater, a sediment sequence from a 14 cm-long grab sample gathered in August 1986 presents the postglacial environment of the area (Richard et al., 1989). Characteristics at the base of the sample, dated at 5780 ± 135 cal BP (5030 ± 70 yr BP),
indicate iee-free lake conditions at this time (Bouchard et al., 1989b; Richard et al., 1989; Gronlund et al., 1990; Guyard et al., 2011). Furthermore, AMS 14C dating and multiproxy paleoenvironmental reconstruction performed by Guyard et al. (20 Il) on the -9 m sediment core collected in the deep basin in 2007 suggests the retreat of the Laurentide Iee Sheet (LIS) from the crater area around 6844 ± 100 cal BP.
The Pingualuit Crater Lake has sustained several rapid drainage events during the last deglaciation as revealed by the three paleo-shorelines on the internaI slopes of the crater and the outwash channels on the external slopes and on the neighbouring grounds of the crater (Bouchard et Saarnisto, 1989). According to Bouchard and Saarnisto (1989), the drainages have occurred through ten crater rim channels (outlets) in the crater rim during four main phases of glacial retreat in the area (Fig. 5). During the first phase, the U-shaped and highest channels 6 and 7 (respectively 608 m and 596 m a.s.l.) were cleared of iee and drained small volumes of the lake waters. As the glacial retreat progressed to phase 2, the opening of outlets 5 and 8 redueed the lake level by about 20 m (Fig. 5). Outflows through channels 5 and 8 were torrential, with a strong erosive power causing the development of outflow systems at the base of the crater. The highest paleo-shoreline (574 ± 5m) observed by Bouchard and Saarnisto (1989) on the northern half of the crater was formed during this second phase. The glacial retreat to phase 3 caused the draining of outlets 5 and 8 and the freeing of the western channels 4 and 3 and eastern channels 9 and 10 (Fig. 5). However, channels 9 and 10 do not appear to have been affected by drainage events owing to their high altitudes (601 ± 5m) precluding contact with lake-waters (between 574 and 544 ± 5 m a.s.l. during phase 3). Bouchard and Saarnisto (1989) have explained the existence of outflow system indicator at the base of the crater near outlet 10 by a sub- and pro- glacial drainage system independent of the crater lake during the glacial retreat. During the phase 4, the lake was totally ice-free but the southern channels 2 and 1 were not affected by drainage, their altitudes being higher than that of channel 3. Torrential outflows through channel 3 persisted during and after phase 4, allowing a connection with Lake Laflamme. Finally, the link was interrupted when the lake level lowered beneath that of the second paleo-shoreline (544 ± 5 m a.s.l.), abandoning the lowermost outlet(channel 3 at 553 ± 5 m
15
a.s.l.). This paleo-shoreline is the rnost pronounced with a level of washed boulders visible
aIl around the crater. The third paleo-shoreline (around 509-514 rn a.s.l.) is poorly
developed and barely observable in sorne parts of the internaI slopes (Bouchard and
Saarnisto, 1989). 73"38' Pingualuit Crater Phase III Paleo·lake Laflamme 1500m
Figure 5, Conceptual model for deglaciation of the Pingualuit Crater Lake suggested by Bouchard and Saarnisto (1989). Black arrows show the crater rim channels hosting outflows, whereas black crosses illustrate channels not affected by drainage. The numbers indicate the ten channels in the crater rim according
to Bouchard and Saarnisto (1989). Also illustrated is the proglacial Lake Laflamme at its maximal level
During deg1aciation, part of the territory around the crater was covered by pro glacial lakes adjoining the ice front (Daigneault, 2008). These were located especially upstream of the Vachon and Puvirnituq Rivers (Prest, 1972; Daigneault, 1993; Daigneault, 2008).
Nevertheless, none of these lakes appear to have reached a sufficient altitude to allow an overflow in the Pingualuit Crater Lake. Indeed, the maximal levels of pro glacial lakes
Saint-Germain and Laflamme (respectively around 520 m and 515 m a.s.l.) (Fig. 5)
bordering the crater were not high enough to inundate the minimum altitude of the rim (channel 3 at 553 ± 5 m a.s.l.) (Bouchard and Saarnisto, 1989; Daigneault, 2008).
3. Methodology
3.1 Aerial-photo and satellite imagery mapping of landforms
In order to identify glacial and deglacial landforms, three series of medium scale aerial photographs (1 :20000 and 1 :30000) from the GéoStat Center (Université Laval) and
Géomathèque ®, were selected and digitized with a 350 dpi resolution. The 26 air photos
used coyer an area of - 455 km2, mainly in the north, east and west parts of the crater area. Analysis of Landsat 7 satellite images, previous documentation and 2012 fieldwork observations (see below) were used to complete the aerial photography interpretation.
Landsat images (spectral band 1 and composite 7-4-3) from the GeoBase database (http://www.geobase.ca; Natural Resources Canada) round out the study of uncovered area with air photos but aHow the mapping of large-scale landforms only (Lajeunesse, 2008). AH the landforms related to glacial and deglacial processes were identified on a map of a
DEM of the Pingualuit crater area generated from elevation data of the GeoBase database.
3.2 Terrestrial LiDAR mapping
In September 2012, a survey was conducted to record the high-resolution topography of the internaI slopes of the crater using a terrestrial LiDAR. A total of 35 surveys were
17
completed with the ILRlS-3D laser scanning system from Opteeh Ine. These scans were
recorded from 19 different sites around the crater ring on the top of the internaI slopes; the
coordinates of each site were measured by GPS (Fig. 6). Spacing among sites is at most
600 m to maximize overlap between scans for the merge step. The scanning range of a
survey covers up to 1500 m of the slope in the highest reflectivity conditions (Optech Inc.,
2008). The three-dimensional point clouds acquired with the terrestrial LiDAR were
imported and merged with Polyworks CAD (Computer Aided Design) software from
Innovmetrie Ine. To facilitate the merging process, a site was selected to generate an
absolute coordinate (i.e., 0; 0; 0) and aH others sites coordinates were transformed
accordingly. A scan recorded from this selected site was employed as a base for merging
the other scans. The point clouds were manually aligned and then merged using the Rest-Fit
function from the IMAlign Polyworks software to achieve the highest convergence. The
large ASCII file generated during this process was converted to LAS (LASer) file format to
create a ground surface (DEM) of 0.5 m resolution using LP360 from the QCoherent
software (Fig. 7). The resulting DEM was then exported in ArcGIS® software to analyse
the internaI slopes of the crater and to determine the elevation of various outlets.
3.3
Bathymetry and seismic acquisition-stratigraphy
About 50 km of sub-bottom profiles (Fig. 6) were coHected on the Pingualuit Crater
Lake in August 2010 using a Knudsen Chirp 3212 system with a frequency of 3.5 kHz
(Ledoux et al., 2011). The sub-bottom profiler data were integrated and analysed using The
Kingdom Suite® software (lliS). Identified seismic horizons were exported into ArcGIS®
to generate isopach maps for each horizon. The acoustic travel times was converted into
depth using p-wave velocities of 1420 m.s-1 and 1500 m.s-1 for the determination of lake
floor and thickness horizons, respectively (Moussawi and Tessier, 1989; Guyard et al.,
2011). Interpretation of the units observed was completed using the correlation between
seismic transects and stratigraphy of the
-9
m sediment core described by Guyard et al.map of the 1ake. This bathymetry was coupled with the high-resolution topography of the internaI slopes from LiDAR data to produce for the first time the entire inner part of the PinguaIuit Crater (Fig. 7).
Figure 6. Location on an aerial photography (1 :20 000) of seismic-reflection profiles coUected in August
2010 (Ledoux et al., 2011), the sediment core collected in May 2007 (grey star) and LiDAR survey sites
0\ ...
Figure 7. A coupled topography-bathymetry model of the eastem part of the Pingualuit Crater (dashed red frame). Mid-resolution bathymetry obtained by interpolation between sei smic transects and high-resolution topography generated from LiDAR data.
4. Results
4.1 Glacial geomorphology 4.1.1 Streamlined forms
Several streamlined forms compose the landscape in the Pingualuit Crater area (Daigneault, 1997). They are mainly gathered in the eastern sector of Lake St-Germain and Vachon River, and to a lesser ex te nt NE of Pingualuit Crater (Fig. 8). According to Daigneault (2008), the streamlined forms are principally drumlins and drumlinoids in the study area. Their size varies between 350 and 1000 m long and 100 and 400 wide, with a maximum height of 10 m (Fig. 9B; Daigneault, 2008). The overall orientation of the streamlined forms matches with the main axis of the Payne ice flow (Fig 4; Bouchard and Marcotte, 1986).
4.1.2 Hummocky moraine
Hummocky moraines are gathered in a sector 1 km NE of the Pingualuit Crater (Fig. 9A). Hummocky moraines form irregular mounds or small ridges of till interrupted by depressions, which are occasionally occupied by ponds. The mounds never exceed 250 m in width and 5 m in height (Daigneault, 2008). This morphology extends over less than 25 km2
with a maximum length of -9 km and a maximum width of -3 km (Fig. 8). In the central part of the hummocky moraines sector, the hummocks are less marked and abundant whereas in the eastern and western part of the area, the boundary between the moraine and the neighbouring ground is clearly defined.
21
1
Streamlined forms 545...
Paleo-shorellnes (Elevation ln meters) Topography 660m"--J Outlets
,
Lake Pingualuit 545 m paleo-shorelines,... 4S0m
"'"
Outflows ..,..,..,.., Esker Hummocky moraine1 -240m
Figure 8. Geomorphological map of the Pingualuit Crater Lake basin illustrating the identified
glacial/deglaciallandforms and hydrological features (see text for details).
4.1.3 Proglaciallake paleo-shorelines
Numerous paleo-shorelines have been identified on the aerial photos in a small stretch located between the southern part of Lake St -Germain and the northernmost part of the Vachon River (Fig. 8). Paleo-shorelines are also noticeable to a lesser extent at the foot and on the external slopes of the northern part of the Pingualuit Crater, near Lake Laflamme (Daigneault, 2008). Paleo-shorelines appear as linear sections, parallel to contour lines, marking a break in slope (Fig. 9B). The linear section can occasionally be
observed on aerial photos by change in tones due to the scarp created by the erosive action of swash on the shore. In the Lake St-Germain area, paleo-shorelines altitudes vary
from
490 to 520 m a.s.l. This level comprises many gravelly beach deposits on both slopes of the southern part of Lake Saint-Gennain (Daigneault, 2008). In the Lake Laflamme area, two major paleo-shorelines can be observed from the observation of aerial photos and measurements of the DEM. The frrst group of paleo-shorelines, located in close proximity to the modern shores of Lake Laflamme, has an altitude about 505 m a.s.l. The second group, located on the external slopes of the Pingualuit Crater, has the highest paleo-shorelines at 545 m. These paleo-shorelines are characterised by snowbanks persisting in the scarps.
Figure 9. Aerial photographs of glacial/deglaciallandforms and hydrological features in the Pingualuit Crater Lake basin. A) Hummocky moraines in the sector of Lake Laflamme; B) Streamlined forms (black tines) and paleo-shoretines (da shed tines) in the southern part of Lake St-Germain; C) Esker (multiple black arrows) and terminal part of outtlow channel linked to outlet 10 (Fig. 12); D) North-East outlets (black arrow) of the Pingualuit Crater Lake and associated outflow channels.
23
4.1.4 Esker
One short esker can be mapped about 3 km north-east of the crater (Fig. 9C). While esker segments of the eastern coast of Hudson Bay can reach lengths of 40 km
(Lajeunesse, 2008), the segment observed in the area is less than 700 m long. The
esker-appears to have a north-east direction, i.e., parallel to the direction of the Payne ice-flow
(Bouchard et al., 1989).
4.2 Deglacial hydrology of Pingualuit Crater Lake
4.2.1 Pingualuit Crater Lake paleo-shorelines
The LiDAR data allow the observation of paleo-shorelines along the internaI slopes of the crater. Among the four paleo-shoreline segments identified, three of them are located in the north-eastern sector of the crater, while a fourth is located in the western sector (Fig. 10). The slope break and notches typical of paleo-shorelines is distinctly observable on the DEM processed from the LiDAR data (Fig. 11). The longest identifiable segment (Fig. llb) measures - 150 m and the shortest is less than 50 m. AlI four paleo-shorelines have the same altitude of 545 m a.s.l. within a margin of error of 1 m (twice the DEM resolution). Existence of several paleo-shorelines with the same altitudes at different sites
575
~
)\.
575)\.
SOOm Intamal .... topOgnphy_
..
." -mmFigure 10. DEM of the Pingualuit Crater using high-resolution topography of the internai slopes and mid-resolution bathymetry. Elevation of the crater rim channels are indicated in meters (a.s.l.) (black brackets) and paleo-shorelines at 545 m a.s.l. are highlighted with white and yellow lines. The yellow eyes represent the field of view illustrated in figures lIa and b.
25
---
N Area aFigure 11. Paleo-shorelines at the altitude of 545 fi a.s.l. (black circles). The location of the two sites is
indicated in Fig. 10.
4.2.2 Characterization of the outlets
The outlets fonn U or V shaped channels cutting the rim of the crater. About ten outlets are recognizable around the rim (Fig. 5). Nonetheless, only seven are described in this study according to the criterion that they were potentially active du ring the last glacial retreat (Fig. 8). These outlets have the most pronounced channels profiles and are associated with traces of outflow on the external slopes of the crater (Fig. 12). The
channels located in the western sector of the crater are the lowest with values ranging from 546 m to 575 m a.s.l., whereas altitudes of the outlets in the eastern section are the highest with values ranging from 575 m to 599 m a.s.l. (Fig. 8). Due to the very steep form of the lowest channel 3 (546 m a.s.l.) preventing an optimum coverage by the LiDAR, it is conceivable that the threshold of this channel is slightly underestimated by a few meters (Bouchard and Saamisto (1989) had measured altitude of this channel at 553 ± 5 m a.s.l.).
Figure 12. Photograph presenting the mouth of outlet 10 with boulders washed and grouped by outflows.
Photo credit: Alexandre Normandeau.
4.2.3 Pingualuit crater lake-de glaciation outflow marks
Interpretation of the aerial photographs allowed the identification of three outflow systems formed by channels linked with outlets from the crater (Fig. 9). The first channel system, located in the western sector of crater, connects western outlets with Lake
27
Laflamme (Fig. 9D). Closer to the crater, the system appears to be made up by two
paleo-tributaries linked to outlets. The first poorly demarcated and flared, is linked with the outlet 3 at 546 m a.s.l. and partially linked to the outlet 4 at 556 m a.s.l. Outlet 4 also flows into
the second tributary with the western outlets 5 at 575 m a.s.l. Indeed, in the downstream section of the outlet 4, the outflow divides into two parts. The second tributary, more marked, incises alongside the external slope of the crater then diverges at the level of the southern outlet 5. The two paleo-tributaries merge to form a -2 km long narrow channel.
At just under 1 km from the present shoreline of Lake Laflamme, this channel disperses
and divides into several small channels joining the lake. The surface affected by these outflow channels has a delta form with a low difference in altitude. This sector also hosts impactites used to date the meteoritic impact (Bouchard and Saamisto, 1989).
The second channels system, located in the north-east part of crater area, connects 597 and 575 m a.s.l. eastern outlets (respectively the 7 and 8 outlets) with the upstream part of the Vachon River. A well-traceable channel starts at each outlet. A few hundred meters from the external slopes, traces of outflow become more difficult to identify. The connection between the outlet 8 and the channel is marked on the external slopes by an important depression covered by washed boulders. Then, the channel disperses and the flow paths appear to move northward to reach the second channel, connected to the outlet 7, and the Vachon River.
The last channel is located in the south-eastern sector of the crater at the mouth of the outlet 10 at 599 m a.s.l. At the end of the outlet, the outflows facing toward the north-east are characterized over 1 km by a channel, segmented by several break in slope, covered by washed boulders (Fig. 12). These boulders, also described at the base of outlet 8, have been washed and grouped by the surge of waters during activation and drainage of the lake through outlets. At the base of the crater, this channel widens and divides into numerous
distinct channels. The channel network enlarges with distance from the crater to reach a maximum width of
-700
m. Here the bedrock appears c1early on aerial photos as a white striated area. Flows have washed-out the till-covered bedrock and eroded it to form fUITOWSon its surface. About 4
km
from the crater, traces made by flows converge over 2km
toreach the Vachon River with a width of -200 m. In this area, the boundaries between the
parts affected and unaffected by flows can be c1early visible owing to extremely straight breaks in slope between them. The channels of this area are in contact with the esker (Fig.
9C).
5. Description and interpretation of the seismic survey
Seismic reflection data enabled the identification of three seismic units and two types
of mass movements (Fig. 13B). Nonetheless, the seismic data do not represent the entire
sedimentary sequence due to the weak penetration of the signal in very coarsed deposits and the impossibility of using a higher energy seismic source because of strict environ mental regulations for this extreme protected area of the Pingualuit National Park
(Fig. 13A and B; Guyard et al., 2011). The three seismic units have been observed only in the deep basin of the crater (Fig. 14A and B). The surface of slopes and the plateau is characterized by very low acoustic penetration with mid-amplitude reflection on top followed by a rapid deterioration of the signal. The very low penetration indicates the
presence of many blocks and/or boulders (Moussawi and Tessier, 1989) derived from
rockfalls along the crater walls. Blocks and boulders present on the slopes of the crater also cover the submerged slopes and the plateau in the lake (Fig. 15). The three units and two mass movements described below are labeled from oldest to newest (Fig. 13C). The generic mass movement terminology used indicates deposits or traces related to mass
wasting according to their seismic signature (e.g. Schnellmann et al., 2005 and references
therein). The interpretation of the seismic units relies on the deep basin core description
Mass movement 2 U3 U2 û
..
.!.!
0.275B
w
U1 Mass movement 1 m E :il 129
N EFigure 13. Seismic lines (location in Fig. 6) from an East-West (A) and a North-South (B) profile illustrating
in A and B typical profiles of the seismic reflection of the crater with the very low acoustic penetration; and in C the two mass movement deposits (mass movements 1 and 2) and the three sei smic units (VI, V2 and V3)
5.1 Units 1 and 2 - glacio-Iacustrine
deposits
Unit 1 is the 10west sequence, and is characterized by low acoustic penetration and the absence of reflections. High-amplitude touches are identifiable locally. The base of Unit 1 is not defined due to the weak penetration of the signal. This unit is observed only in the deepest part of deep basin and mainly where other units are visible. The maximal depth of the top of this unit attained - 5.75 m below the lake floor (Fig. 13C).
Unit 2 is characterized by high amplitude parallel reflections with lateral limits poody defined. This unit is also observed only in the deeper part of deep basin (Fig. 14A). The thickness of Unit 2 varies from less than 1 m to 4 m. In the sector where the 2007 core was recovered, the thickness of this unit reaches -1 m and is present from - 3 m below the lake floor (Fig. 13C).
31
Figure 14. Isopach maps from the Pingualuit Crater Lake. Maps A and B illustrate the thickness of units 2 and 3 in the deep basin. Map C is showing the estimated orientation and maximum thickness of multiple mass movements linked to mass movement 2.
Based on previous interpretation of similar acoustic facies and detailed sedimentology analyses, units 1 and 2 suggest a glacio-Iacustrine sedimentation associated with a decrease in discharge linked with the retreat of the
LIS
(Eyles and Mullins, 1997; Van Rensbergen et al., 1999; Guyard et al., 2011). According to their depths, units 1 and 2 coincide with finely laminated silts with few dropstones intercalated by a massive sand layer interval from 270 to 710 cm. This facies and its glacigenic sediments are interpretedas indicating high meltwater and sediment discharge with a lower influence of ice sheet-detritic inputs at the top, corresponding to Unit 2. Units 1 and 2 probably correspond to the last stages of ice sheet retreat with a semi-perrnanent ice covered lake still supplied by residual ice from the disintegrating glacier (Black et al., 2010; Guyard et al., 2011).
5.2
Unit
3 and mass movement 1 and 2: mass wasting deposits
Unit 3 is characterized by a low amplitude seismic facies and appears as a thick transparent and chaotic sedimentary sequence. Sediments of Unit 3 coyer a large part of the basin but reach a maximum thickness of 3-4 m in its deepest part (Fig. 14B).
Mass movcment 1 (MMl) constitutes the most chaotic and s<.:arœly describable acoustic facies. This mass movement is characterized by high amplitude chaotic and discontinuous sedimentary sequences laterally disrupted by low amplitude and transparent sedimentary sequences. Few meters below the top of this unit, it is no longer observable due to the chaotic configuration of the sediments causing a weakening of the acoustic signal (Fig. 13e). According to this description, this unit has acoustics characteristic of debris flows (Prior et al., 1984), but the limited correlation between acoustic profiles and the weak penetration of the signallimits this interpretation. MMI is present mainly in the northern and eastem parts of the crater at foot of the slopes and in the deep basin. Due to the characteristics of this unit, it is impossible to observe other units under MMl. However, the contact between MMI and units 1 and 2 indicate that mass movements have affected and probably eroded these horizons.
33
Figure 15. Photograph illustrating the steep internai subaerial and subaqueous slopes covered by large blocks and boulders. Photo credit: Grégoire Ledoux.
Mass movement 2 (MM2) consists of a chaotic to transparent seismic facies. Its surface is fairly smooth but appears occasionally slightly hummocky when transects laterally cross the mass movement. Its surface is also more irregular than the top of the underlying layer. Furthermore, MM2 overlays none of the other horizons, only the surface of slopes and the plateau. MM2 is observed in three kinds of bathymetric configurations
(Fig. 14C): (1) it is visible at the toe of steep slopes at the level of the plateau and in the deep basin mainly in the eastern part of the crater; (2) south of the central part of the crater, it is present on the shallower slopes between the plateau and the deep basin; (3) it is discernable on the steep slopes in the western sector of the crater. In this area, MM2
reaches a maximum thickness of -20 m, but elsewhere it ranges between 1 and 15 m in
thickness. MM2 was not observed in contact with the other identified units (Fig. 13).
However, in several parts at the toe of the slopes it partially overlapped MMI.
Description of mass movements 1 and 2 indicates two distinct mass wasting events in
the Pingualuit Crater Lake. The first one preceded MM2 and occurred after the deposition
of seismic units 1 and 2, as indicated by the erosional contact between the mass wasting and these units. Unit 3 is probably the most recent deposit in the lake, though it could be
concomitant with MM2. Indeed, Unit 3 coincides with a mass wasting deposit composed of
folded and reworked glacigenic material and characterized by an erosive contact at its base (Guyard et al., 2011). Furthermore, both units have seismic characteristics with important similarities: low amplitude and transparent seismic facies. Finally, MM2 and Unit 3 may be linked to a single depositional event that occurred about 4200 cal BP (Guyard et al. 2011). Guyard et al. (2011) suggested a translational slide based on the observation of
preserved internaI sedimentary organisation, but the indistinct failure surface weakens this
hypothesis (Mulder and Cochonat, 1996).
6. Discussion
Aerial photography focused on the Pingualuit Crater Lake basin reveals glacial
streamlined forms and hummocky moraines, which reflect, respectively, the orientation and deglacial conditions of the last glaciation in the study area. The overall north-east
direction of an the observed streamlined forms attests to a main glacial Payne flow
(azimuth 45°) subsequent to the Ungava flow (azimuth 110°) in the crater area during the
35
Hummocky moraines are generally deposited at the margins of the Laurentide Ice Sheet and have been mainly observed in the Great Plains of North-America (Gravenor and Kupsch, 1959; Parizek, 1969; Clark et al., 1996; Mollard, 2000; Boone and Eyles, 2001; Evans et al., 2013). In the Ungava Peninsula, the majority of hummocky moraines are located and gathered in the western part of the peninsula around the presumed position of ice divide line (Daigneault, 2008). According to Daigneault (2008), these moraines correspond to the locations of the last remnants of ice. Furthermore, hummocky moraines are evidence of supraglacial or subglacial depositional processed tied to the stagnation of ice during ice-sheet retreat (Gravenor and Kupsch, 1959; Stalker, 1960; Parizek, 1969;
Johnson et al., 1995; Boone and Eyles, 2001; Daigneault, 2008). In the Pingualuit Crater area, hummocky moraines are relatively isolated, faintly extended and located farther away from the presumed position of the ice div ide line (Fig. 4 and 8; Daigneault, 1997). This organization of moraines suggests the development of a stagnation zone during a rapid overall deglaciation of the Ungava Peninsula caused by the presence of glaciolacustrine waters (Evans, 2003; Daigneault, 2008). However, hummocky terrain being limited to the north-eastern sector of the study area (Fig. 8), it is likely that this stagnation did not occur on and immediately around Pingualuit Crater.
The paleo-shorelines observed in the southern sectors of Lake St-Germain and Lake Laflamme confirm the presence of a proglacial lake in the study area during the glacial retreat. Paleo-shorelines identified at different elevations between 490 and 520 m a.s.l. (Fig. 8) provide futher evidence for several periods of relative stable water level during the development and the emptying of the proglaciallake. At that time, the ice front prevented drainage of glacio-lacustrine waters to the south by the Vachon River, allowing the
development of proglacial lakes (Daigneault, 2008). In the Lake Saint-Germain area, the elevations of the highest paleo-shoreline indicate a pro glacial lake with a maximum level of 520 m a.s.l.. The elevation of the paleo-delta generated by outflows from the Lake
Pingualuit spread in the southern part of the Lake Laflamme area show a pro glacial lake with a maximum level of 515 m a.s.l. (Fig.l6; Bouchard and Saamisto, 1989). Nevertheless, the paleo-shorelines observed on the external slopes of the Pingualuit Crater
at 545 m a.s.l. (Fig. 8), corroborated by paleo-shorelines at - 540 m a.s.l. identified by Daigneault (1997) near a lake located a few kilometers east of the Vachon River, may indicate the presence of a higher altitude proglaciallake. According to these altitudes, the proglaciallake in the Pingualuit area could have reached 545 m a.s.l., approximately 45 m above the CUITent level of Lake Laflamme (Fig. 16).
Paleo-Iake Laflamme - 515 m D - 545 m Paleo-shorelines Paleo-Iake Pingualuit D-574m -545m . -512m , 545 m paleo-shorelines ~ lakelevelabovetopography 1500m
Figure 16. Topographical map of the Pingualuit Crater Lake basin presenting the potential paleo hydrology
since the beginning of the deglaciation of the crater. The black arrows are showing the crater rim channels