RESULTATS DE L'EXPEDITION IODP 341
Thèse présentée
dans le cadre du programme de doctorat en océanographie en vue de l’obtention du grade de Ph.D
PAR
© Julie Heggdal Velle
Composition du jury :
André Rochon, président du jury, Université du Québec à Rimouski
Guillaume St-Onge, directeur de recherche, Université du Québec à Rimouski Joseph S. Stoner, codirecteur de recherche, Oregon State University
Matthias Forwick, codirecteur de recherche, UiT The Arctic University of Norway Stefanie Brachfeld, examinateure externe, Montclair State University
UNIVERSITÉ DU QUÉBEC À RIMOUSKI Service de la bibliothèque
Avertissement
La diffusion de ce mémoire ou de cette thèse se fait dans le respect des droits de son auteur, qui a signé le formulaire « Autorisation de reproduire et de diffuser un rapport, un mémoire
ou une thèse ». En signant ce formulaire, l’auteur concède à l’Université du Québec à
Rimouski une licence non exclusive d’utilisation et de publication de la totalité ou d’une partie importante de son travail de recherche pour des fins pédagogiques et non commerciales. Plus précisément, l’auteur autorise l’Université du Québec à Rimouski à reproduire, diffuser, prêter, distribuer ou vendre des copies de son travail de recherche à des fins non commerciales sur quelque support que ce soit, y compris l’Internet. Cette licence et cette autorisation n’entraînent pas une renonciation de la part de l’auteur à ses droits moraux ni à ses droits de propriété intellectuelle. Sauf entente contraire, l’auteur conserve la liberté de diffuser et de commercialiser ou non ce travail dont il possède un exemplaire.
Du mener livet er en kamp Jeg er enig
Men rett som det er Er det hjemmekamp Og vi topper laget Har sola i ryggen Medvind
Alle heier på oss
ACKNOWLEDGEMENTS
This PhD has been possible only with the help and support of countless people and I am grateful to all of you.
Dear Guillaume, thank you for your endless optimism and encouragement. Thank you for welcoming me at ISMER six years ago and for your continuous support through the years. Thank you, Joe. My visits to OSU have always given me tons of new data, motivation, and inspiration; all thanks to your passion and enthusiasm for science.
Matthias, thanks for introducing me to marine geology in 2010, for guiding me through my masters and sticking with me through my PhD.
Special thanks are due to my collaborators within IODP Exp. 341. Thank you, Mo Walczak, Alan Mix, Michelle Penkrot, and John Jaeger, for interesting discussions, complimentary data, thoughts, comments and feedback on this part of the project. Furthermore, I want to thank the captain and crew of the R/V JOIDES Resolution, as well as Leah LeVay, Phil Rumford, and the staff at the IODP Gulf Coast core repository for organizing and assisting with the u-channel sampling.
Many thanks are also owed to the excellent lab team at ISMER; Marie-Pier, Jacques, and Quentin. Thank you for years of great collaboration and fun. I am also grateful to the OSU lab, especially Brendan, Ann, and Rob. Thanks for welcoming me at OSU.
Thanks to GEOTOP and ArcTrain for scholarships and travel grants. The meetings and events organized by these two organizations have allowed me to meet new friends and colleagues from around the world.
Thanks to my lovely colleagues in the office. All of you have become great friends and are amazing people that I have been so happy and fortunate to share this experience with. Thank you for countless coffee breaks, office discussions, conference road-trips, and baro nights; Myriam, Quentin, Pierre-Arnaud, Charles, Elissa, Matthieu, Arthur, Edouard, Sarah, Naïs, Yan, Omi, Fatma, Simon F., and Simon N.
My parents and my family -thank you for always being there for me, even from across the Atlantic. Thanks for encouraging me and believing in me; I owe this PhD to you. I am also grateful to my second family, Kris and the Leytems. Thanks for making me feel at home in Oregon.
RÉSUMÉ
Les études paléomagnétiques sont fondamentales à la compréhension des variations temporelles et spatiales du champ magnétique terrestre et des mécanismes de la géodynamo qui le génère. Les signaux des directions et intensité paléomagnétiques sont également souvent utilisés pour améliorer la chronostratigraphie et faciliter les corrélations stratigraphiques entre les enregistrements. En plus des analyses paléomagnétiques standards, des données de magnétisme environnemental du sédiment ont été obtenues. Ces propriétés reflètent les processus environnementaux ayant affecté le sédiment de la source au puits, et sont donc des proxys particulièrement utiles pour la reconstruction des environnements passés.
Le golfe de l’Alaska est un lieu clé pour les études paléomagnétiques et de magnétisme environnemental. Les séquences sédimentaires obtenues-ici ont une haute résolution temporelle, apportant des informations sur la dynamique méconnue du lobe nord-ouest de l’inlandsis de la Cordillère (NCIS), ainsi que la possibilité d’obtenir des enregistrements paléomagnétiques provenant d’une région sous-échantillonnée. L’objectif général de cette étude est de construire un enregistrement paléomagnétique qui va permettre une étude détaillée de la dynamique du champ magnétique terrestre, ainsi que de l’évolution de la NCIS à travers le Pléistocène supérieur et l’Holocène. Pour répondre à cet objectif, deux des sites de forage de l’expédition IODP 341 dans le golfe de l’Alaska en 2013 ont été étudiés : le site U1418 du cône sous-marin Surveyor à une profondeur de 3667 m, et le site U1419 situé sur le haut du talus continental à une profondeur de 687 m. Les 64,6 premiers mètres de l’enregistrement du site U1418 ont été étudié, tandis que l’entière section de 112 m CCSF-A du site U1419 a été étudiée.
Dans le premier chapitre, les paramètres magnétiques environnementaux du site U1419 sont analysés. Combinées aux images digitales obtenues par CT-scan et aux estimations de densité, les propriétés magnétiques du sédiment sont utilisées comme un moyen de reconstruire la dynamique du lobe nord-ouest de l’inlandsis de la Cordillère au cours des derniers ~54 000 ans (cal BP). Les résultats indiquent que le golfe de l’Alaska aurait expérimenté une alternance entre des conditions de haute productivité et des conditions glaciaires au cours du début et du milieu du stage isotopique marin 3 (52 700 - 42 700 cal yr BP). Ce chapitre suggère aussi que la progression vers des conditions de maximum glaciaire aurait débuté aussi tôt que 41 800 cal yr BP et aurait duré jusqu’à 14 700 cal yr BP, donnant une période glaciaire étendue éventuellement nommée le « dernier maximum glaciaire de
l’Alaska ». Les fluctuations de la marge glaciaire auraient été plus complexes à partir de 25 000 cal yr BP avant la déglaciation à 18 000 cal yr BP.
Le chapitre 2 met l’accent sur l’enregistrement paléomagnétique du site 1419 et introduit le modèle d’âge du site 1418. Les résultats démontrent que l’enregistrement n’est pas optimal pour l’étude de la paléointensité, en particulier à cause d’une minéralogie magnétique complexe et de processus post-dépôt. Cependant, les paramètres de direction semblent avoir été affectés seulement à un faible degré, et nous soutenons que l’inclinaison mesurée à 20 mT correspond à la meilleure estimation d’inclinaison possible. L’inclinaison du site U1419 mesurée en laboratoire a été comparée aux données obtenues à bord du navire sur les carottes U1419 et U1418 et à celles obtenues lors du sondage préliminaire du site U1419, le tout indiquant une bonne corrélation globale entre ces différents enregistrements du golfe de l’Alaska. La comparaison avec d’autres enregistrements régionaux indique que l’inclinaison du site U1419 a capté un signal géomagnétique régional, l’intervalle entre 15 000 et 30 000 cal yr BP étant la partie la plus robuste de l’enregistrement.
Finalement, le chapitre trois fait état de l’enregistrement paléomagnétique du site U1418. À ce site, le vecteur paléomagnétique complet (inclinaison, déclinaison et paléointensité) a été reconstruit pour les derniers 27 000 ans (cal BP), apportant de nouvelles informations aux données paléomagnétiques du golfe de l’Alaska. La comparaison de l’inclinaison et de la déclinaison avec d’autres enregistrements régionaux indique que ce site a capté les variations paléomagnétiques séculaires à l’échelle régionale. La correspondance de l’inclinaison entre les sites U1418 et U1419 a permis d’ajuster le modèle d’âge du site U1418 et d’augmenter la précision des limites d’âges sur ce site… La comparaison de l’intensité normalisée avec les enregistrements régionaux et globaux suggère qu’un signal global a pu être enregistré, mais que les variations à l’échelle du millénaire nécessitent plus de précisions.
Les trois chapitres de cette thèse se complémentent et apportent de nouvelles informations concernant l’histoire glaciaire du golfe de l’Alaska, ainsi que des enregistrements paléomagnétiques robustes et précis qui pourront favoriser les corrélations stratigraphiques régionales.
Mots clés : Paléomagnétisme, magnétisme environnemental, inlandsis de la Cordillère, golfe de l’Alaska, Pacifique nord-est, Pléistocène supérieur, Holocène
ABSTRACT
Paleomagnetic studies are key in order to understand the temporal and spatial complexities of Earth’s magnetic field and it’s driving mechanism the geodynamo. Records of paleomagnetic directions and/or intensity are also frequently used to improve chronostratigraphy and to facilitate stratigraphic correlation between records. Obtained along with most standard paleomagnetic analyses, is information on the sediment’s rock magnetic properties. These properties reflect the environmental processes that the sediment has gone through from source to sink and are, therefore, useful proxies for reconstructing past environments.
The Gulf of Alaska is a key location for paleomagnetic and environmental magnetic studies. The sedimentary sequences found here are of high temporal resolution, offering insights to the poorly constrained dynamics of the northwestern lobe of the Cordilleran Ice Sheet (NCIS), as well as the possibility to obtain paleomagnetic records from an under-sampled region of the world. The general objective of this study is to construct a paleomagnetic record that will permit a detailed study of the Earth’s magnetic field dynamics, as well as the evolution of the NCIS through the late Pleistocene and Holocene. To achieve this objective, two of the drill Sites from the 2013 IODP Expedition 341 in the Gulf of Alaska were studied. Site U1418 from the upper Surveyor Fan at a water depth of 3667 m, and Site U1419 from the upper continental slope at a water depth of 687 m. The uppermost 64.6 meters of the spliced record were studied at Site U1418, whereas the entire splice of 112 m CCSF-A was studied at Site U1419.
In the first chapter, the environmental magnetic record of Site U1419 is explored. Along with CT scans and density estimates, the sediment’s magnetic properties are used as a means of reconstructing the dynamics of the northwestern lobe of the Cordilleran Ice Sheet for the past ~54,000 cal yr BP. Results indicate that the Gulf of Alaska may have experienced conditions alternating between high productivity and glacial conditions during early and mid- Marine Isotope Stage 3 (52,700-42,700 cal yr BP). This chapter also suggests that the build-up to glacial maximum conditions may have started as early as 41,800 cal yr BP and lasted until 14,700 cal yr BP; an extended glacial period tentatively named the Alaskan LGM. More complex ice front dynamics are suggested from 25,000 cal yr BP before deglaciation from 18,000 cal yr BP.
Chapter two focuses on the paleomagnetic record of Site U1419 and introduces the U1418 age model. Results show that the record is not suitable for paleointensity studies, most likely due to a complex magnetic mineralogy and post-depositional processes. However, the directional record seems to have been affected only to a minor degree and we argue that the inclination as measured at 20 mT is the most reliable inclination estimate. Site U1419
inclination was compared to the U1419 and U1418 shipboard inclinations as well as the U1419 site survey core, showing a general agreement between these Gulf of Alaska records. Comparison with other regional records indicate that the U1419 inclination record has captured a regional geomagnetic signal, with the interval between 15,000 and 30,000 cal yr BP being the most robust part of the record.
In chapter three, the paleomagnetic record of Site U1418 is studied. At this Site, the full paleomagnetic vector (inclination, declination, and paleointensity) was recreated for the past 27,000 cal yr BP, adding new perspectives on the paleomagnetic records of the Gulf of Alaska. Comparisons of U1418 inclination and declination to other regional records indicate that this site has captured regional scale paleomagnetic secular variations. The similarity between Site U1418 and U1419 inclination allowed an adjustment of the U1418 age model, increasing the resolution of this Site’s age constraints. Comparing the U1418 normalized intensity to regional and global records suggest that a long-term global signal may have been recorded, whereas millennial-scale variability needs further constraints.
The three chapters of this thesis compliment and build upon each other, and provide new information regarding the glacial history of the Gulf of Alaska, as well as a robust and well-constrained paleomagnetic record that will aid in regional stratigraphic correlation.
Keywords: Paleomagnetism, environmental magnetism, Cordilleran Ice Sheet, Gulf of Alaska, northeast Pacific, late Pleistocene, Holocene
TABLE OF CONTENTS ACKNOWLEDGEMENTS ... ix RÉSUMÉ ... xi ABSTRACT ... xiii TABLE OF CONTENTS ... xv LIST OF TABLES ... xx
LIST OF FIGURES ... xxi
LIST OF ABBREVIATIONS, ACRONYMS AND SYMBOLS ... xxvii
GENERAL INTRODUCTION ... 1
BACKGROUND ... 1
Paleomagnetism ... 1
Marine sediments and paleomagnetic records ... 1
Pacific paleomagnetic records... 3
Environmental magnetism ... 4
The Gulf of Alaska ... 7
PROJECTSETTINGANDCONTEXT ... 11
International Ocean Drilling Program (IODP) Expedition 341 ... 11
RESEARCHOBJECTIVES ... 14
METHODS ... 15
THESISOVERVIEW ... 18
CONTRIBUTIONSANDCOLLABORATIONS ... 19
RESEARCHCOMMUNICATION... 20
Articles in preparation ... 20
REFERENCES ... 22
CHAPTER 1 A LATE PLEISTOCENE ENVIRONMENTAL MAGNETIC RECORD OF NORTHWESTERN CORDILLERAN ICE SHEET DYNAMICS BASED ON IODP EXPEDITION 341 DRILL SITE U1419 IN THE GULF OF ALASKA ... 36
1.1SUMMARYOFCHAPTER1 ... 36
1.2ALATEPLEISTOCENEENVIRONMENTALMAGNETICRECORDOF NORTHWESTERNCORDILLERANICESHEETDYNAMICSBASEDON IODPEXPEDITION341DRILLSITEU1419INTHEGULFOFALASKA ... 37
1.3INTRODUCTION... 39
1.4STUDYAREA ... 41
Geological and oceanographic setting ... 41
The northwestern Cordilleran Ice Sheet (NCIS) ... 42
1.5METHODS ... 43
Coring and sampling ... 43
Physical properties ... 44
Continuous magnetic measurements ... 45
Discrete magnetic measurements ... 46
Constructed ratios as environmental magnetic proxies ... 46
Age model ... 47
1.6RESULTS ... 48
Physical properties and lithology ... 48
Magnetic properties ... 52
Chronostratigraphy ... 57
1.7DISCUSSION ... 58
Unit III - Period of alternating conditions (54,000 to 41,800 cal yr BP)... 58
Unit II - The Alaskan LGM (41,800 -14,700 cal yr BP) ... 60
The Gulf of Alaska record in a regional and global context ... 63
1.9ACKNOWLEDGEMENTS ... 66
1.10REFERENCES ... 67
CHAPTER 2 A HIGH-RESOLUTION LATE QUATERNARY INCLINATION RECORD FROM IODP EXPEDITION 341 DRILL SITE U1419 IN THE GULF OF ALASKA ... 77
2.1SUMMARYOFCHAPTER2 ... 77
2.2AHIGH-RESOLUTIONLATEQUATERNARYINCLINATIONRECORD FROMIODPEXPEDITION341DRILLSITEU1419INTHEGULFOF ALASKA ... 78
2.3INTRODUCTION ... 80
2.4METHODS ... 81
Coring and u-channel sampling ... 81
Physical properties ... 82
Continuous magnetic measurements ... 83
Discrete magnetic measurements ... 85
Age models ... 85
2.5RESULTS ... 88
Chronostratigraphy ... 88
Lithology ... 89
Magnetic remanence and directions ... 90
Magnetic mineralogy, grain size, and concentration ... 95
2.6DISCUSSION ... 98
Natural remanent magnetization and directional record ... 98
Regional comparisons ... 99
U1419 inclination record... 106
2.7CONCLUSIONS ... 107
2.8ACKNOWLEDGEMENTS ... 108
CHAPTER 3 HIGH-RESOLUTION PALEOMAGNETIC SECULAR VARIATION AND RELATIVE PALEOINTENSITY IN THE GULF OF ALASKA:
CONSTRAINTS ON THE LATE PLEISTOCENE AND HOLOCENE
STRATIGRAPHY OF IODP EXPEDITION 341 SITE U1418 ... 119
3.1SUMMARYOFCHAPTER3 ... 119
3.2HIGH-RESOLUTIONPALEOMAGNETICSECULARVARIATIONAND RELATIVEPALEOINTENSITYINTHEGULFOFALASKA: CONSTRAINTSONTHELATEPLEISTOCENEANDHOLOCENE STRATIGRAPHYOFIODPEXPEDITION341SITEU1418 ... 120
3.3INTRODUCTION... 122
3.4SITESETTING ... 123
The Gulf of Alaska ... 123
IODP Expedition 341 drill Site U1418... 124
3.5METHODS ... 125
U-channel sampling ... 125
Continuous magnetic measurements ... 125
Discrete magnetic measurements ... 127
CT scanning ... 128
Age model ... 128
3.6RESULTS ... 129
Chronology ... 129
Physical properties and lithology ... 130
Magnetic mineralogy, concentration, and grain size ... 131
Paleomagnetic directions ... 134
Remanent magnetization and normalized intensity ... 136
3.7DISCUSSION ... 138
Chronostratigraphy ... 138
Paleomagnetic secular variations (PSV)... 141
3.8CONCLUSIONS ... 147 3.9ACKNOWLEDGEMENTS ... 147 3.10REFERENCES ... 148 GENERAL CONCLUSION ... 158 Introduction ... 158 Chapter 1 ... 158 Chapter 2 ... 163 Chapter 3 ... 165
The Gulf of Alaska records ... 167
Perspectives ... 168
LIST OF TABLES
Table 1: Overview of methods used during this PhD. ... 17 Table 2: Depth, age, selected magnetic parameters and lithology characteristic for the units and facies described in the text. ... 50 Table 3: Radiocarbon dates from Site U1418 and EW0408-87JC ... 86 Table 4: Tie-points to the U1419 age model (Walczak et al., in prep). ... 140
LIST OF FIGURES
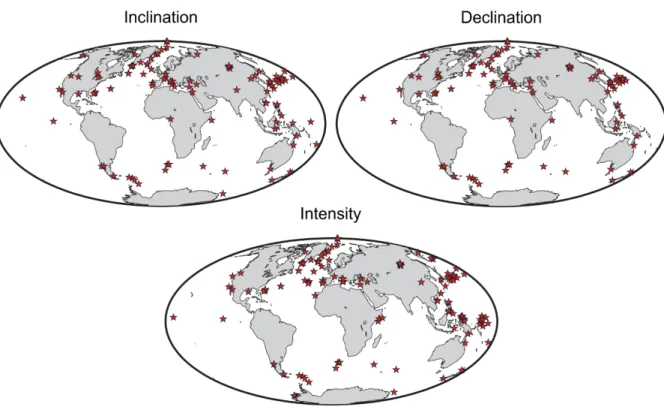
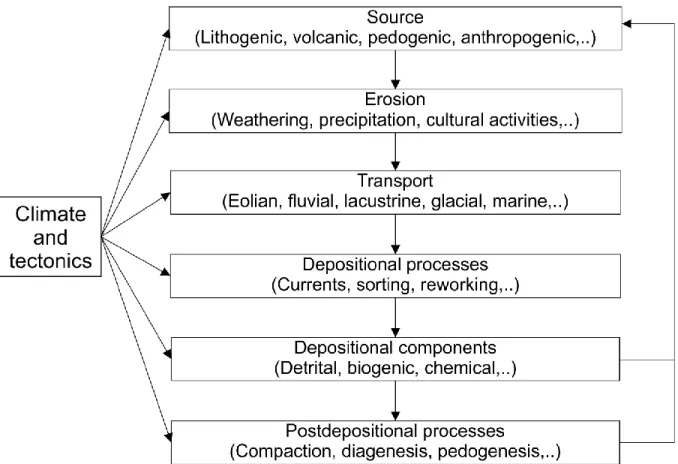
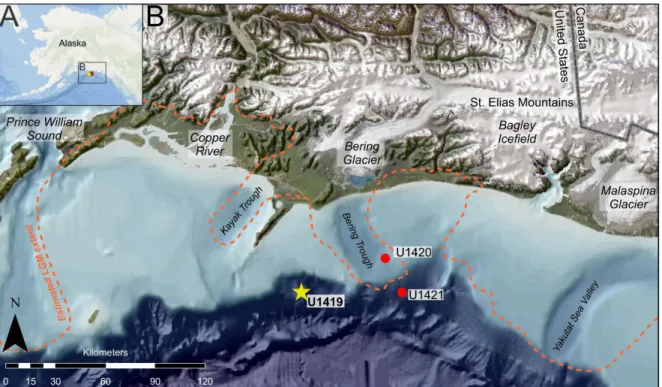
Figure 1: Distribution of sedimentary inclination, declination and intensity records (modified from Panovska et al., 2018). ... 4 Figure 2: Diagram showing the different forcings, sources, processes and environments that influence magnetic grains and can be investigated using the techniques of environmental magnetism (modified from Verosub & Roberts, 1995). ... 6 Figure 3: Overview map of the Gulf of Alaska and the IODP Exp. 341 drill Sites (note that Site U1417 is located to the south and not included). Estimated LGM maximum extent from Kaufman et al., 2011. AC= Alaska Current; ACC= Alaska Coastal Current. ... 10 Figure 4: The St. Elias Mountains (left; photo credit J. Jaeger), and the JOIDES Resolution (right; photo credit A. Sakaguchi). ... 13 Figure 5: Sampling of u-channels at the IODP Gulf Coast Repository at Texas A&M University in College Station in March 2014. ... 16 Figure 6: Map of the Gulf of Alaska with Site U1419 (yellow star) and other Expedition 341 drill Sites (red circles). The estimated LGM extent (from Kaufman & Manley, 2004) is outlined with an orange dashed line. The location of Site U1419 also marks the location of core EW0408-85JC mentioned in the text. ... 42 Figure 7: Age model for Site U1419 (Walczak et al., in prep). Blue circles indicate radiocarbon dated intervals from Site U1419. Red circles indicate GRA tie-points to core EW0408-85JC and TC (cf. Fig. 6). Sedimentation rates (cm/kyr) averaged over 500 years below. ... 48 Figure 8 (next page): Site U1419 magnetic remanence (ARM, IRM and SIRM) and magnetic susceptibility (kLF), kARM/kLF, hysteresis properties, MDFARM, and CT density
against CCSF-A depth in meters. Magnetic proxies are indicated in top panels, and units referred to in the text are indicated in side panels. Facies described in the text are indicated in different colors. ... 50
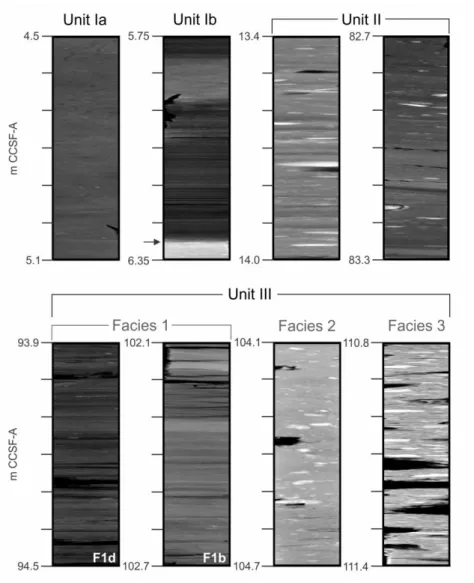
Figure 9: U-channel CT scan images from Site U1419 showing examples of different lithologies observed in Site U1419 and described in the text. Brighter/darker intervals reflect higher/lower density, respectively. The arrow indicates the transition between Unit II and Unit Ib at 6.3 m CCSF-A. ... 53 Figure 10: Day plot (Day et al., 1977) with mixing lines from Dunlop (2002a, 2002b) of all Site U1419 discrete samples divided into units as described in the text. Selected hysteresis loops representative for each unit are presented below. ... 55 Figure 11 (next page): Anhysteretic susceptibility of the U1419 units plotted against magnetic susceptibility (King et al., 1982) as a proxy for magnetic grain size (given a magnetite mineralogy). Magnetic grain size boundaries are based on synthetic samples from Banerjee et al. (1981) and the plot is adapted from Geiss & Banerjee (2003). Insert shows samples from 6.3-4.0 m CCSF-A in Unit Ib. ... 56 Figure 12 (previous page): Sedimentation rates (Walczak et al., in prep) and selected magnetic properties plotted against age in cal yr BP. Enlarged y axis for kARM/kLF in
Unit II in grey. Events discussed in the text are indicated in different colors. Upper panel shows division of the marine isotope stages (MIS), and the lower panel details the glacial history as interpreted from the U1419 sedimentary record. ... 62 Figure 13: Comparison of Antarctic (EDML in blue; EPICA Community Members, 2010) and Greenland (NGRIP in green; NGRIP Community Members, 2004) oxygen isotope records on the AICC2012 chronology (Veres et al., 2013) and the U1419 magnetic susceptibility record (black). Note the reversed Y-axes on the oxygen isotope records. Interpretation of the U1419 record are marked in colors as in Fig. 12. Heinrich stadials (HS) for reference are marked on the oxygen isotope records in grey. ... 65 Figure 14: Overview of the Gulf of Alaska with IODP Expedition 341 drill Sites indicated. Site U1419 is indicated by a yellow star. This also marks the location of U1419 of site survey core EW0408-85JC mentioned in the text. The Surveyor Fan Site U1418 is indicated by a red triangle. This also marks the location of core EW0408-87JC mentioned in the text. ... 83 Figure 15: Left: U1419 age model (Walczak et al., in prep.) and sedimentation rates. Red circles indicate GRA tie-points to core EW0408-85JC and TC whereas blue circles are calibrated ages from Site U1419. Right: U1418 age model with sedimentation rates for the past 40,000 cal yr BP. Red circles indicate magnetic susceptibility tie-points to
core EW0408-87JC (Praetorius et al., 2015) and blue circles indicate calibrated ages from U1418. Note the difference in Y axes, both for depth and sedimentation rates. ... 89 Figure 16: U1419 natural remanent magnetization (NRM) with all AF demagnetization steps with the 20 mT demagnetization step highlighted in red as it is described in more detail in the text. Note that the NRM is plotted on a log scale. Laboratory remanences (ARM, IRM, and SIRM) as measured before demagnetization, and the maximum angular deviation (MAD) values for the entire range of demagnetization steps. ... 91 Figure 17 (next page): Vector end-point diagrams (Zijderveld, 1967) from four representative intervals of Site U1419 are displayed in top panels. AF demagnetization steps in mT are indicated in grey in panel A. Open circles represent projections on the vertical plane, and closed circles the horizontal plane. Corresponding demagnetization plots are displayed below. ... 92 Figure 18: Selection of PCA ranges for U1419 inclination and MAD values, all with a 40-point smoothing. The inclination as measured at 20 mT highlighted in red as it is described in more detail in the text. ... 94 Figure 19: U1419 inclination measured at 20 mT with the GAD latitude (73.6°) indicated in red; rotated declination as measured at 20 mT, magnetic susceptibility (kLF), ARM susceptibility (kARM), and MDF of ARM. Details from CT images
displaying characteristic lithofacies are shown on the right. Red asterisks mark intervals that are disregarded due to disturbance either during drilling or u-channel sampling. ... 96 Figure 20: Panel A: Day plot (Day et al., 1977) with theoretical mixing lines from Dunlop (2002a, 2002b) of all Site U1419 discrete samples. Panel B: Selected IRM acquisition curves. Panel C: Selected hysteresis loops. ... 97 Figure 21 (next page): Comparison of U1419 shipboard inclination stack (see description in the text) and U1419 u-channel inclination as measured at 20 mT. The expected geocentric axial dipole inclination for the site latitude (GAD = 73.6°) is indicated with the grey horizontal line. Red asterisks mark intervals that are disregarded due to disturbance either during drilling or u-channel sampling. Note that the figure includes the lowermost part of the splice (below 96 m CCSF-A) which has been excluded from further comparison. ... 100
Figure 22: Comparison of the U1419 inclination (in black) to U1419 site survey core EW0408-85JC (in blue; Walczak et al., 2017), U1418 shipboard data (in purple), and the NE Pacific sedimentary inclination anomaly stack (NEPSIAS in red; Walczak et al., 2017). Letters are added to facilitate discussion. Note that the upper 1.3 meters of U1419 are removed due to sampling deformation (see text) and that u-channel edges are removed. ... 102 Figure 23: Comparison of the U1419 inclination record (with 40-point smoothing on intervals with sedimentation rates > 80 cm/kyr) and Expedition 341 Surveyor Fan Site U1418 shipboard inclination stack (with 5-point smoothing on intervals with sedimentation rates > 100 cm/kyr). Both records are plotted on their own individual age models with dates marked in blue and red circles (cf. Fig. 15). Inclination features are indicated with letters in blue to facilitate discussion; note that letters are continued from Figure 22. ... 104 Figure 24: Comparison of the Site U1419 inclination record (40-point smoothing on intervals with sedimentation rates > 80 cm/kyr) with the Site U1418 shipboard inclination stack (with 5-point smoothing on intervals with sedimentation rates > 100 cm/kyr) and the Western North America inclination stack WNAM17 (relocated to the Gulf of Alaska using a GAD approximation; Reilly, et al., 2018), all on their individual age models. Letters are continued from figures 22 and 23 to facilitate discussion. Note that intervals identified as disturbed and/or deformed in the U1419 record are removed (cf. Fig. 19) ... 105 Figure 25: Location of IODP Expedition 341 drill Sites in the Gulf of Alaska. Site U1418 is indicated with a yellow star. Site U1418 also marks the location of core EW0408-87JC mentioned in the text. ... 124 Figure 26: U1418 age model (Velle et al., in prep). Blue circles indicate radiocarbon dated levels of Site U1418. Red circles indicate magnetic susceptibility-based tie-points to the independently dated Gulf of Alaska core EW0408-87JC (Praetorius et al., 2015). ... 130 Figure 27: Natural remanent magnetization (NRM) with AF demagnetization steps displayed in colors ranging from black (0 mT) to grey (100 mT); anhysteretic remanent magnetization (ARM, isothermal remanent magnetization (IRM), and saturated isothermal remanent magnetization (SIRM) as measured before demagnetization (at 0 mT); magnetic susceptibility (kLF) with a 20-point smoothing (black); and kARM/kLF
kARM/kLF is inversely correlated with magnetic grain size (Thompson & Oldfield,
1986). On the right are three examples of CT-scans showing lithologies typical for Site U1418. ... 131 Figure 28: A: Day plot (Day et al., 1977) with theoretical mixing lines from Dunlop (2002a, 2002b) of all Site U1418 discrete samples. B: Anhysteretic susceptibility (kARM) plotted against magnetic susceptibility (kLF; King et al., 1982) as a proxy for
magnetic grain size (given a magnetite mineralogy). Magnetic grain size boundaries are based on synthetic samples from Banerjee et al. (1981) and the plot is adapted from Geiss & Banerjee (2003). C: Selected hysteresis loops representative of Site U1418. ... 133 Figure 29: Vector end-point diagrams (Zijderveld, 1967) with corresponding demagnetization plots from four representative intervals of Site U1418. Open (closed) circles represent projections on the vertical (horizontal) plane. ... 134 Figure 30: Characteristic remanent magnetization (ChRM) inclination and declination as defined between the 25-60 mT AF demagnetization steps, and maximum angular deviation (MAD) values for the complete range of AF demagnetization steps (orange) and for the ChRM range 25-60 mT (black). Declination has been rotated to a mean of zero. All parameters are shown with a 20-point smoothing indicated in bold. ... 135 Figure 31 (next page): U1418 NRM normalized over the 25-60 mT AF demagnetization steps by ARM (left) and IRM (right) using the ratio method (black) and the slope method (blue). The R value of the slope method is displayed in grey. Scatter plots show the correlation between the normalized intensity and the normalizer used with the corresponding r2 value. ... 137 Figure 32: U1418 inclination compared with Exp. 341 drill Site U1419 inclination (Velle et al., in prep), both on their respective age models. Blue circles indicate radiocarbon dated intervals and red circled indicate tie-points to core EW0408-87JC for Site U1418, and tie-points to core EW0408-85JC for Site U1419 (Walczak et al., in prep). Tie-points between the two inclination records are indicted with dashed lines. ... 139 Figure 33: U1418 age model (in black) with tie-points to the U1419 age model (Walczak et al., in prep) via U1419 inclination (green diamonds). Adjusted age model and sedimentation rates are indicated in red. ... 141 Figure 34: Comparison of Site U1418 ChRM (25-60 mT) inclination and declination with U1418 shipboard inclination as measured at 20 mT (Velle et al., in prep), U1418
shipboard declination stack, Site U1419 (Velle et al., in prep), EW0408-85JC (Walczak et al., 2017), the Western North America PSV stack rotated to the Gulf of Alaska using a GAD approximation (WNAM; Reilly et al., 2018), and the northeastern Pacific sedimentary inclination anomaly stack (NEPSIAS; Walczak et al., 2017) for the time periods 0-16 cal kyr BP (A) and 16-28 cal kyr BP (B). PSV features are numbered to facilitate discussion. A 40-point smoothing has been applied to parts of the U1418 record where sedimentation rates exceed 100 cm/kyr. ... 143 Figure 35: Comparison of Site U1418 normalized intensity (NRM/IRM slope) with other regional intensity records; HLY0501-05JPC (Barletta et al., 2008), 02PC (Deschamps et al., 2018), ODP Site 1233 (Lund et al., 2006), MD98-2181 (Stott et al., 2002), and the “overall” RPI record scaled to VADM (including the Iberian margin records and globally distributed marine and lakustrine records; cf. Channell et al., 2018) for the time periods 0-16 cal kyr BP (A) and 16-28 cal kyr BP (B). A 40-point smoothing has been applied to parts of the U1418 reord where sedimentation rates exceed 100 cm/kyr. ... 145 Figure 36: Comparison of the highest resolution interval (16-28 cal kyr BP) of the Site U1418 normalized intensity (NRM/IRM slope) and the Greenland 10Be flux record
(Muscheler et al., 2004). A 40-point smoothing has been applied to parts of the U1418 record where sedimentation rates exceed 100 cm/kyr. Note the reversed Y axis for the Greenland 10Be flux record. ... 146 Figure 37: From the left: Site U1419 magnetic susceptibility and sedimentation rates (averaged over 500 years; Walczak et al., in prep), tentative interpretation of the ice front’s position based on Site U1419, and a summary of the glacial history as interpreted from Site U1419. ... 161
LIST OF ABBREVIATIONS, ACRONYMS AND SYMBOLS AF Alternating field (demagnetization)
AGM Alternating gradient force (field) magnetometer ARM Anhysteretic remanent magnetization
CCSF-A Core composite depth below seafloor A
CCSF-B Core composite depth below seafloor B (accounts for expansion in depth) ChRM Characteristic remanent magnetization
CSF-A Core depth below seafloor
CT Computed tomography
DC Direct current Exp. Expedition
GAD Geocentric axial dipole GoA Gulf of Alaska
Hc Coercive force
Hcr Remanence of coercivity
INRS-ETE Institut national de la recherche scientifique - Eau Terre Environnement IODP International Ocean Discovery Program
IRM Isothermal remanent magnetization
ISMER Institut des sciences de la mer de Rimouski
kARM Susceptibility of anhysteretic remanent magnetization
kLF Low-field magnetic susceptibility
MAD Maximum angular deviation
MD Multi-domain
MDF Median destructive field
MDFARM Median destructive field of anhysteretic remanent magnetization
MIS Marine isotope stage Mrs Saturation remanence Ms Saturation magnetization
mT millitesla
NCIS Northwestern Cordilleran Ice Sheet NRM Natural remanent magnetization OSU Oregon State University
PSD Pseudo-single domain
PSV Paleomagnetic secular variation RPI Relative paleointensity
SD Single domain
T Tesla
UQAR Université du Québec à Rimouski VADM Virtual axial dipole moment VGP Virtual geomagnetic poles
GENERAL INTRODUCTION
BACKGROUND
Paleomagnetism
Direct observations of Earth’s magnetic field extend back four centuries but were not systematically organized until the global network of Magnetic Observatories was initiated by Weber and Gauss in the 1840s (e.g., Jackson et al., 2000; Hulot et al., 2010). At present, several observatories and satellites constantly monitor changes in the field both on Earth and from space. Paleomagnetism, the study of field changes in the past, is based on analyses of volcanic rocks, archeological artefacts and sediments, and has become an extensive field of research (e.g., Channell, 1999; Guyodo & Valet, 1999; Gallet et al., 2002, 2009; ; Laj et al., 2004, 2014; Panovska et al., 2018; Korte et al., 2019) and is important in order to improve our understanding of, for example, the geodynamo, links between terrestrial and solar processes, as well as to establish robust chronologies and allow correlation of different proxy records within a region.
Marine sediments and paleomagnetic records
Because of their continuity, sediment records are especially convenient for long-term studies of variations in Earth’s magnetic field at a specific location (Tauxe, 1993). In order for sediments to be used as a paleomagnetic archive, it is assumed that they record the intensity and direction of the magnetic field at their time of deposition; the natural remanent magnetization (NRM). However, the exact timing and depth of the acquisition of magnetization in marine sediments is not completely understood, and is also affected by mineral magnetic properties such as the type of mineral, the magnetic grain size and concentration (e.g., Levi & Banerjee, 1976; Tauxe, 1993), and the quality and preservation
of the magnetic signal can be altered by post-depositional (biogenic, chemical and diagenetic) processes (Karlin & Levi, 1983; Clement et al., 1996; Walczak et al., 2017). Due to these effects on magnetic acquisition and preservation in sediments, the quality of the archived magnetic signal and recorded intensity may vary down-core.
The intensity and direction of the surface geomagnetic field varies spatially and temporally over timescales of seconds to thousands of years. Variations in the field occurring during periods of stable polarity are termed paleomagnetic secular variations (PSV), with anomalously large changes in the magnetic field direction, beyond the normal range of PSV, termed geomagnetic excursions. These are defined by a deviation of the virtual geomagnetic pole (VGP) of more than 40-45° from the geographic pole (e.g., Gubbins, 1999; Roberts, 2008; Valet et al., 2008; Laj & Channell, 2015; Lund, 2018).
These changes in direction and relative intensity of the Earth’s magnetic field through time make paleomagnetic records useful as a chronological tool. Some excursions are frequently used as stratigraphic markers; for example, the Laschamp excursion at ~41 ka (e.g., Laj et al., 2000; Guillou et al., 2004; Lund et al., 2005; Lascu et al., 2016) and the less constrained Mono Lake excursion at 30-34 ka (e.g., Liddicoat & Coe, 1979; Kent et al., 2002; Laj et al., 2014; Lund et al., 2017a). On a regional scale, directional changes within the normal range of paleomagnetic secular variations can be used as a means of correlations (e.g., Barletta et al., 2008; Walczak et al., 2017; Caron et al., 2018; Deschamps et al., 2018; Reilly et al., 2018). Although correlation of relative paleointensity records may be less straightforward, the use of such records in stratigraphy is already well established and records from several different areas of the globe have been stacked in order to create solid stratigraphic references (e.g., the global Sint-200 by Guyodo & Valet, 1996; Sint-800 by Guyodo & Valet, 1999; GLOPIS-75 by Laj et al., 2004; Sint-2000 by Valet et al., 2005; and PISO-1500 by Channell et al., 2009).
Another application of RPI records and stacks is their inverse relationship to cosmogenic nuclide production rates; at times when the geomagnetic field is stronger, it acts as an efficient shield around the Earth, and fewer cosmic rays enter the upper parts of the atmosphere, and less cosmogenic isotopes (e.g., 10Be, 14C, 26Al, 36Cl) are produced (e.g.,
Masarik & Beer, 1999; Beer et al., 2002; Valet, 2003; Stoner & St-Onge, 2007; Valet et al., 2014). Because this shielding takes place in space, it reflects the global geomagnetic field and an inverse correlation between a given RPI record and cosmogenic nuclide production rates can, therefore, confirm if the RPI record reflects global-scale geomagnetic field variations (e.g., Stoner et al., 2000; St-Onge et al., 2003; Thouveny et al., 2004; Ménabréaz et al., 2011, 2012; Nowaczyk et al., 2013) .
In addition to their role as stratigraphic aids allowing comparisons of different proxy records within a region, paleomagnetic records are important for improving our understanding of the temporal and spatial variations in the Earth’s magnetic field. For example, the influence of high-latitude flux lobes on PSV records (e.g., Stoner et al., 2013; Walczak et al., 2017), and the regional expression of secular variations and excursions (e.g., Lund, 2018; Panovska et al., 2018). Constraining the dynamics of such features, as well as their spatial and temporal variability is key to increased understanding of the geodynamo (e.g., Bloxham 2000; Stoner et al., 2013; Lund et al., 2016).
Pacific paleomagnetic records
Although most paleomagnetic studies are focused on the North Atlantic (Fig. 1), some paleomagnetic studies have been carried out in the Pacific Ocean during the past few decades. Records from the south (e.g., Kok & Tauxe, 1999) and the equatorial Pacific (Valet & Meynadier, 1993; Laj et al., 1996; Verosub et al., 1996; Yamazaki & Oda, 2005) span time periods of up to 4 Ma, with a few higher-resolution Pacific studies focusing more on the past 0-70 ka years (e.g., Lund et al., 2006, 2017b ). Paleomagnetic studies from the western North Pacific comprise mainly Brunhes and older paleointensity records (Yamazaki, 1999; Yamazaki & Kanamatsu, 2007), as well as the RPI stack NOPAPIS-250 which spans the past 250 kyr (Yamamoto et al., 2007). The 1992 ODP Leg 145 covered most of the North Pacific with a drilling transect from Japan to Canada (Rea et al., 1995; Weeks et al., 1995). Sites 883 and 884 from this ODP Leg were drilled in the southern Gulf of Alaska and formed the basis of a composite paleointensity curve spanning the past 200 kyr (Roberts et al., 1997). More recently, Walczak et al. (2017) studied the high-resolution deglacial and Holocene
paleomagnetic records of cores EW0408-79JC and EW0408-85JC from the Gulf of Alaska and from this constructed the north-east Pacific sedimentary inclination anomaly stack (NEPSIAS). Included in this stack were also other, independently dated, regional records from Alaska, Oregon and Hawaii, indicating that a common, regional inclination signal has been captured in these records.
Figure 1: Distribution of sedimentary inclination, declination and intensity records (modified from Panovska et al., 2018).
Environmental magnetism
Iron-bearing minerals have great potential to record the environmental processes they go through both before and after deposition. Such environmental processes include soil formation, weathering, erosion, transport, accumulation and diagenesis of sediments. Furthermore, the mode of erosion and transportation (i.e. wind, ice, and water) will also leave
traces in the sediment which can provide information on past climatic and environmental conditions (Thompson & Oldfield, 1986). Looking into rock magnetic properties can therefore be very useful in paleoclimate studies. Even very small quantities of magnetic minerals can be detected with magnetic measurement systems, and such analyses are usually non-destructive, efficient and sensitive to minute amounts of magnetic grains (e.g., Verosub & Roberts, 1995; Dekkers, 1997; Liu et al., 2012). Rock magnetic properties that often are used include low-field magnetic susceptibility (kLF), anhysteretic remanent magnetization
(ARM), isothermal remanent magnetization (IRM), and saturation isothermal remanent magnetization (SIRM). These are parameters usually measured during standard paleomagnetic studies and are therefore routinely obtained. Additionally, hysteresis parameters and IRM acquisition curves are useful parameters easily obtained from small sample sizes.
Mineral magnetic properties have successfully been used in sedimentological, paleoceanographic and paleoclimatic studies, and have proven to be a useful correlative and stratigraphic tool for use in sediment cores (e.g., Robinson, 1986; Robinson et al., 1995; Stoner et al., 1996; Kissel et al., 1999; Lisé-Pronovost et al., 2014; Dorfman et al., 2015). For example, magnetic susceptibility can reflect core lithostratigraphy and thereby contribute to identifying glacial vs. interglacial (high vs. low magnetic susceptibility) layers, corresponding to periods of high/low ice-rafted debris (IRD) input and low/high carbonate productivity, respectively (Robinson, 1986). Magnetic susceptibility, ARM and IRM have been used to identify and correlate IRD layers to Heinrich-layers (Thouveny et al., 2000). In the Baffin Bay, studies of mineralogical assemblages and lithofacies have resulted in an improved understanding of the dynamics of the Greenland, Innuitian and Laurentide Ice Sheets through the 115 ka (Simon et al., 2014), while Hatfield et al. (2013) used mineral magnetic properties, with special focus on grain-size specific magnetic variations to distinguish sediment provenance in marine sediment cores from the northern North Atlantic. In the southern Alaskan region, the complex geological setting can be advantageous when determining provenance of marine sediments. Cowan et al. (2006) investigated the mineral magnetic signal of the sediment in three glaciated southern Alaskan fjords and found distinct
differences in the magnetic signal depending on source region. For example, PSD magnetite is characteristic for the Yakutat terrane, whereas fine PSD hysteresis parameters and low magnetic susceptibility is typical for the Chugach terrane. Furthermore, magnetic susceptibility was found to be especially useful in distinguishing the provenance of IRD layers as the different source areas have distinct magnetic expressions (Cowan et al., 2006).
Figure 2: Diagram showing the different forcings, sources, processes and environments that influence magnetic grains and can be investigated using the techniques of environmental magnetism (modified from Verosub & Roberts, 1995).
The Gulf of Alaska Geologic setting
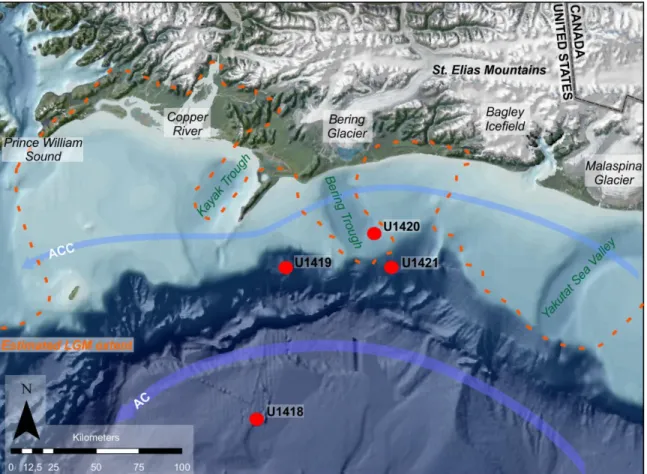
The Gulf of Alaska (GoA) is located in the subarctic northern Pacific Ocean, off the southern Alaska coast (Fig. 3). The St. Elias Mountains dominate the southeastern coast of Alaska and is the highest coastal mountain range in the world with its >6000 m.a.s.l peaks (e.g., Meigs & Sauber, 2000; Bruhn et al., 2004). In addition to glacial erosion, the St. Elias Mountains are subject to the harsh maritime climate of the North Pacific; including heavy storms and precipitation that are thought to have a great influence on the denudation on the windward side of the orogen (Meigs & Sauber, 2000).
The North Pacific continental margin in the Gulf of Alaska is between approx. 25 and 100 km wide and has an average water depth of 140 m. The bathymetry on the shelf is dominated by several cross-shelf troughs or sea valleys, e.g., the Hinchinbrook and Yakutat Sea Valleys, and the Kayak and Bering Troughs. These troughs formed over time during glacial maxima when glaciers from the northwestern lobe of the Cordilleran Ice Sheet reached the shelf edge (Carlson et al., 1982; Elmore et al., 2013; Montelli et al., 2017). The sedimentary sequence on the shelf is assumed to be 5 km thick consisting of glacimarine sediments deposited through the past 6 Ma (Molnia & Carlson, 1978; Jaeger et al., 1998). At the foot of the continental slope, extending into the Alaskan Abyssal Plain, is the massive Surveyor Fan which occupies an area of 3.42 x 10⁵ km2 with a sedimentary volume of 6.8 x 10⁵ km3 (Reece et al., 2011). This fan system started developing in the Miocene and the
combination of an active orogen and periods of intense glaciation (Lagoe et al., 1993; Berger et al., 2008; Montelli et al., 2017) has ensured a high flux of sediment to the Surveyor Fan through the past ~20 Ma leaving a sedimentary sequence existing mostly of terrigenous sediment (Reece et al., 2011). The most dominating morphological feature of the Surveyor Fan is the Surveyor Channel; a 700 km long and up to 500 m deep incision cut out by reoccurring turbidity currents (Ness & Kulm, 1973). This channel feeds sediment to the lower part of the Surveyor Fan and was formed around ~1 Ma and has expanded during shelf edge glaciations since (Reece et al., 2011).
Climate and oceanography
The Alaska Current (AC) is a branch of the Pacific subarctic gyre and flows westward in the ocean basin of the GoA (Fig. 3). As the AC reaches the Kenai Peninsula, it turns south-west and continues along the North Pacific margin and the Alaska Peninsula as the Alaskan Stream (Reed & Schumacher, 1986). On the continental shelf is the Alaska Coastal Current (ACC) which is driven westward along the coast by winds and freshwater runoff from the glaciers and rivers of southern Alaska (Royer, 1982; Stabeno et al., 1995, 2004). The GoA is primarily a downwelling system, but as winds relax in summer, short periods of upwelling can occur (Stabeno et al., 2004). Stabeno et al. (2004) found that the El-Niño Southern Oscillation (ENSO) has an effect on the coastal climate of the GoA in that it controls wintertime precipitation which in turn is determining the timing of freshwater runoff. The Pacific Decadal Oscillation (PDO) is thought to have some impact on the weather (temperature and winds) in the GoA, but these signatures are very weak (Stabeno et al., 2004).
Glacial history and paleoceanography
During past glaciations, local glaciers formed in the mountain ranges of southern Alaska and in the eastern Rocky Mountains, and coalesced in the intermediate lowlands to form the regional ice cap known as the Cordilleran Ice Sheet; extending from Washington in the south, to Yukon in the north, and the Bering Sea in the northwest (e.g., Fulton, 1991). The northwestern lobe of the Cordilleran Ice Sheet (NCIS) covered the southern coast of Alaska, bordering on and extending into the Gulf of Alaska (Kaufman & Manley, 2004). Alpine glaciations may have occurred in this region as early as 7 Ma (Lagoe et al., 1993) with the first biofacies indicative of tidewater glaciation in the western Gulf of Alaska encountered between 6.7 and 5 Ma (Lagoe et al., 1993), and the first IRD in the central GoA, observed at 3.5 Ma (Rea & Schrader, 1985). Glaciation around the Gulf of Alaska increased with Northern Hemisphere cooling around 2.5 Ma (Glacial Interval B; Lagoe et al., 1993; Berger et al., 2008) with the most extensive Cordilleran Ice Sheet recently dated to ~2.64 Ma
(Hidy et al., 2013), approximately consistent with the first occurrence of IRD at IODP Exp. 341 distal Surveyor Fan drill Site U1417 at approx. 2.58 Ma (Gulick et al., 2015). Further glacial intensification occurred after the mid-Pleistocene transition (MPT) after ~1 Ma (Glacial Interval C) with glacial advances reaching the GoA shelf edge (Berger et al., 2008; Montelli et al., 2017), forming cross-shelf troughs (e.g., the Hinchinbrook and Yakutat Sea Valleys, and the Kayak and Bering Troughs) that dominate the present day bathymetry of the GoA shelf (Carlson et al., 1982; Elmore et al., 2013).
In contrast to elsewhere in Alaska, little is known regarding the early Wisconsinan extent of the Cordilleran Ice Sheet around the Gulf of Alaska (Kaufman & Manley, 2004; Kaufman et al., 2011). Pre-LGM erosional surfaces have been observed in seismic data from the GoA shelf indicating repeated shelf-wide glacial advances occurring since the mid-Pleistocene (Elmore et al., 2013; Montelli et al., 2017). The Last Glacial Maximum occurred around 23 - 20 kyr ago (Mann & Peteet, 1994; Clapperton, 2000), when several NCIS outlet lobes reached the GoA shelf edge. Ice flow to the shelf edge is thought to have been concentrated in cross-shelf troughs (e.g., Bering Trough, Yakutat Sea Valley) with the shelf areas between troughs possibly remaining ice-free (Elmore et al., 2013). De Vernal & Pedersen (1997) suggested that oceanographic conditions during the LGM were cold with freezing winter conditions and low biogenic fluxes. Based on a foraminiferal oxygen isotope record from the GoA, Praetorius & Mix (2014) suggested that cold and/or salty conditions prevailed in the period between 18 and 16 cal ka BP and that the peak input of IRD occurred between 17.5-16.5 cal ka BP. Glacial stagnation occurred from 16.9 cal ka BP, with glacial retreat starting from 16.6 cal ka BP (Davies et al., 2011) and shortly followed by a warming and/or freshening of surface waters (Praetorius & Mix, 2014). By 14.7 cal ka BP, glaciers had retreated from the shelf into fjords and onto land (Clapperton, 2000; Davies et al., 2011). For the Bølling-Allerød interstadial, de Vernal & Pedersen (1997) and Barron et al. (2009) found indications for a warming in the GoA with laminated sediments and increased surface water productivity. However, according to Addison et al. (2012), the Bølling-Allerød winters may have been cooler than modern winters with seasonal sea ice. During the Younger Dryas (12.9 – 11.7 kyr BP), glaciers re-advanced in southern Alaska (e.g., Briner et al., 2002) and
sea-surface temperatures were once again cool and/or more saline (Davies et al., 2011). From 10-8 cal ka BP, the GoA cooled followed by a gradual warming (Praetorius & Mix, 2014) and increasing surface ocean productivity after 8 kyr BP (de Vernal & Pedersen, 1997). During the Little Ice Age (LIA, AD ~1200 – 1900), glaciers advanced again (e.g., Barclay et al., 2001; Calkin et al., 2001; Elmore et al., 2013) and have been retreating since (Arendt et al., 2002).
Figure 3: Overview map of the Gulf of Alaska and the IODP Exp. 341 drill Sites (note that Site U1417 is located to the south and not included). Estimated LGM maximum extent from Kaufman et al., 2011. AC= Alaska Current; ACC= Alaska Coastal Current.
PROJECTSETTINGANDCONTEXT
As discussed above, paleomagnetic records have several useful and important applications. However, to facilitate a deeper understanding of the temporal and spatial variability of the Earth’s magnetic field and its significance for our knowledge about the geodynamo, studies from different parts of the world are needed. Records of high temporal resolution with robust, independent chronologies are especially in demand, not only to allow studies on paleomagnetic variability, but also to improve and calibrate stratigraphic correlations between different proxy records. The North Atlantic region has been the main focus of most paleomagnetic studies (Fig. 1) and improving the global coverage of PSV and RPI records is, therefore, key in order to constrain the spatial and temporal complexity of the geomagnetic field.
The Gulf of Alaska is an excellent location for high-resolution paleoclimate and paleomagnetic studies; the combination of the coastal St. Elias Mountains and the highly erosive glacial systems of southern Alaska has ensured a large flux of terrestrial material to the gulf over millions of years, creating a sedimentary archive with high temporal resolution. This allows detailed studies of the dynamics of the northwestern lobe of the Cordilleran Ice Sheet through time and an opportunity to constrain glacial variations prior to and during the LGM. Furthermore, the terrestrial, fine-grained material rich in magnetic minerals deposited in the GoA should allow studies of changes in the geomagnetic field on millennial timescales and may provide records comparable to the best North Atlantic paleomagnetic records.
International Ocean Drilling Program (IODP) Expedition 341
The International Ocean Drilling Program (IODP) Expedition 341 took place from May 29th to July 29th, 2013 in the Gulf of Alaska, onboard the JOIDES Resolution. The Expedition expects to contribute to the understanding of several of the complexities remaining in Neogene climate research and the main objectives of Expedition 341, as stated in the scientific prospectus (Jaeger et al., 2011), are to
• “Document the tectonic response of an active orogenic system to late Miocene to recent climate change;
• Establish the timing of advance and retreat phases of the northwestern Cordilleran Ice Sheet to test its relation to dynamics of other global ice sheets; • Implement an expanded source-to-sink study of the complex interactions between glacial, tectonic, and oceanographic processes responsible for creation of one of the thickest Neogene high-latitude continental margin sequences;
• Understand the dynamics of productivity, nutrients, freshwater input to the ocean, and surface and subsurface circulation in the northeast Pacific and their role in the global carbon cycle; and
• Document the spatial and temporal behavior during the Neogene of the geomagnetic field at extremely high temporal resolution in an under-sampled region of the globe”
The expedition successfully retrieved more than 3 km of sediment cores from five drilling sites in the GoA continental margin and the adjacent Surveyor Fan (Fig. 3). Multiple holes were drilled at every site to ensure a complete sedimentary record. At each site, the different holes were tied together using shipboard measurements of various sedimentary physical properties (e.g., magnetic susceptibility, color, density, etc.) in order to construct one continuous stratigraphic record (splice). Biostratigraphic, micropaleontological and paleomagnetic analyses during the expedition confirmed that the cores cover the Miocene through Pliocene, Pleistocene and Holocene epochs and that some sites have exceptional sedimentation rates (>380 cm/ka). The Pleistocene sequence is especially thick, indicating that the sediment flux to the GoA was very high during this period. This creates an excellent foundation for further analyses to investigate the climatic, paleomagnetic and tectonic changes of the Pleistocene in high resolution (Jaeger et al., 2014). Sites U1418 and U1419 will be the focus of this thesis and are briefly described below.
Figure 4: The St. Elias Mountains (left; photo credit J. Jaeger), and the JOIDES Resolution (right; photo credit A. Sakaguchi).
Site U1418 (58°46.6095′N, 144°29.5777′W) is located at a water depth of 3667 m, in the upper part of the Surveyor Fan (Fig. 3). Six holes (A-F) were drilled at this Site, and a core splice of approximately 271 m was created based on the holes A and C-E. Shipboard biostratigraphic and paleomagnetic analyses suggest that this sedimentary sequence covers the past ~1 Myr, providing unique insight to this region’s paleomagnetic, climatic, and tectonic history (Jaeger et al., 2014). Long-term sedimentation rates (since the mid Pleistocene transition) at Site U1418 have been estimated to 81 cm/kyr (Gulick et al., 2015), but are likely to have been much higher on shorter timescales. The upper 64.6 meters of the U1418 splice were analyzed as part of this PhD project, focusing on the late Pleistocene and Holocene.
Site U1419 (59°31.9297′N, 144°8.0282′W) is located at a water depth of 687 m, on the upper continental slope between the mouths of the Kayak and Bering cross-shelf troughs; two troughs that are thought to have been formed curing the last glacial maximum (e.g., Carlson et al., 1982; Fig. 3). Five holes (A-E) were drilled at this Site and together make up the core splice of 112 m. Preliminary analyses revealed exceptional sedimentation rates of up to 380 cm/kyr covering the late Pleistocene through Holocene (Jaeger et al., 2014). The entire splice from Site U1419 was analyzed in this PhD project.
RESEARCHOBJECTIVES
The overall objective of this thesis is to, based on the Gulf of Alaska sedimentary sequence, construct a paleomagnetic record that will permit a detailed study of the Earth’s geomagnetic field dynamics, as well as the evolution of the northwestern Cordilleran Ice Sheet during the late Pleistocene and Holocene in the Gulf of Alaska.
Specific objective 1 – The Gulf of Alaska environmental magnetic record
The first objective of this thesis is to investigate the dynamics of the northwestern Cordilleran Ice Sheet (NCIS) during the late Pleistocene and Holocene using the environmental magnetic record of Site U1419. How do the changes in magnetic properties (e.g., magnetic susceptibility, grain size and mineralogy) reflect changes such as advance and retreat phases of the NCIS? What were the dynamics of the NCIS prior to, and during the LGM? How does the U1419 record complement or add to our current understanding of the glacial history of this region?
Specific objective 2 – The Gulf of Alaska paleomagnetic records
The second objective is to reconstruct late Pleistocene and Holocene geomagnetic variability from the Gulf of Alaska core Sites U1418 and U1419. From these high-resolution records, paleomagnetic directions (inclination and declination) and relative paleointensity will be studied, where permitted, in order to detail millennial-scale geomagnetic variations. How do these records compare with other, independently dated, regional records? What are pronounced similarities or differences? How do these records compare with North Atlantic records and global stacks? What do the Gulf of Alaska paleomagnetic records indicate about the nature of the geomagnetic signal in the northeast Pacific, and what does that reveal about geomagnetic field dynamics?
METHODS
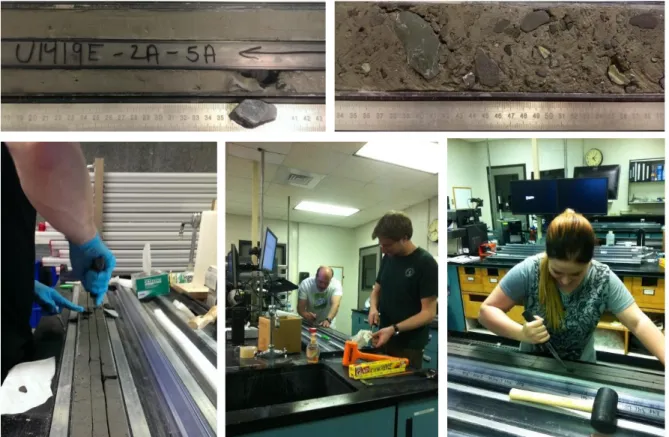
In order to achieve the objectives of this thesis, u-channels were sampled from the presumed pristine center of split cores from the spliced records of Sites U1418 and U1419 (Fig. 5). The sampling took place over a period of two weeks in March 2014 at the IODP Gulf Coast Repository at Texas A&M University in College Station, Texas, USA. A total of 166 u-channels were sampled from Site U1418, of which 53 were analyzed for this PhD project. At Site U1419, 97 u-channels were sampled, all of which were analyzed. In core composite depth below seafloor (CCSF-A), this is equivalent to a 66 m long record at Site U1418, and the entire splice record of 112 m at Site U1419.
Continuous paleomagnetic analyses and magnetic susceptibility measurements were performed at the Paleomagnetism and Marine Geology Laboratory at the Institut des sciences
de la mer de Rimouski (ISMER) in Rimouski, Canada, and at the Paleo- and Environmental
Magnetism Laboratory at Oregon State University (OSU), USA. Discrete magnetic analyses were performed at ISMER. Detailed CT imagery and density information was obtained from each u-channel at Institut national de la recherche scientifique, Centre Eau Terre
Environnement (INRS-ETE) in Québec City, Canada. Details of these measurements and the
treatment of the data obtained is explained in more depth in each chapter. An overview of laboratory analyses performed and parameters obtained is presented in Table 1.
Figure 5: Sampling of u-channels at the IODP Gulf Coast Repository at Texas A&M University in College Station in March 2014.
Table 1: Overview of methods used during this PhD. Par am et er s m easu re d NRM (inc ludi ng pa leoma gne ti c dire cti ons) ARM (0.05 mT DC fie ld , 100 mT AF field) 1 IRM (300 mT) SIRM (950 mT) Ma gne ti c susce pti bil it y (k LF ) 2 Hyste re sis prop ertie s (M s, Mrs, Hc , Hc r) IRM a cquisi ti on c urve s ( on se lec ted sa mpl es) C T im age s a nd de nsit y ( HU number ) Re solu tion (c m ) 1 1 1 1 1 ~150 N/A 0.04 # of sam p les U1418 U1419 97 97 97 97 97 95 9 97 53 53 53 53 53 54 N/A 53 In str u m en t 2G c ryoge nic m agne tom eter B artingt on MS 2 u -c ha nne l l oop se nsor P rinc eton Mea sur ement C orpor ati on Mi croMa g 2 900 alt erna ti ng gr adie nt for ce magne tom eter ( AG M) S ieme ns S OMA TO M De finiti on AS+ 128 CT sca nne r
1 Also used to obtain k
A R M a nd MDF A R M . 2 A na lyse s pe rf or med in t hr ee iter
ations with the
mea ns of the thr ee r uns p re se nte d in the c ha pte rs.
THESISOVERVIEW
This thesis is divided into three chapters where each chapter represents one research paper. Chapter one corresponds to the first objective and is based on Site U1419. Chapters two and three relate to the second objective through studies of Site U1419 and U1418, respectively.
In chapter one, the environmental magnetic record from shelf Site U1419 is interpreted in terms of the glacial dynamics of the north. This high-resolution Site provides insights to the environmental conditions in the Gulf of Alaska during early Marine Isotope Stage 3 (MIS3), as well as the early onset of full glacial conditions.
Velle, J.H., St-Onge, G., Stoner, J.S., Walczak, M.H., Mix, A.C., Jaeger, J.M. and Forwick, M. A late Pleistocene environmental magnetic record of northwestern Cordilleran Ice Sheet
dynamics based on IODP Expedition 341 drill Site U1419 in the Gulf of Alaska. In prep.
Chapter two explores the high-resolution inclination record from Site U1419. With its high resolution and detailed age model (Walczak et al., in prep), this Site provides a new late Pleistocene inclination record with features that appear to be regionally consistent. This paper also presents the preliminary radiocarbon age model for Site U1418.
Velle, J.H., Walczak, M.H., Reilly, B., St-Onge, G., Stoner, J.S., Fallon, S. and Forwick, M.
A high-resolution late Quaternary inclination record from IODP Expedition 341 drill Site U1419 in the Gulf of Alaska. In prep.
In the third chapter, the full paleomagnetic vector of Surveyor Fan Site U1418 is reconstructed and compared to other regional records. A comparison between Sites U1418 and U1419 allows for further development of the U1418 age model presented in chapter two and speaks to the advantage of using paleomagnetic records in stratigraphic correlation. Velle, J.H., St-Onge, G., Stoner, J.S., Walczak, M.H. and Forwick, M. High-resolution
on the late Pleistocene and Holocene stratigraphy of IODP Expedition 341 Site U1418. In
prep.
Finally, the conclusions of this thesis are presented. This general discussion will focus on the main results from the three chapters, their implications and limitations, as well as future perspectives.
CONTRIBUTIONSANDCOLLABORATIONS
My contribution towards the three chapters of this thesis has been performing the analyses and writing the three chapters. My supervisors G. St-Onge, J. Stoner and M. Forwick have carefully reviewed several iterations of the chapters included in this thesis. The three chapters have also benefitted greatly from the contributions of the co-authors. M. Walczak and A. Mix carried out the radiocarbon analyses and constructed the U1418 and U1419 age models, with support from S. Fallon. B. Reilly organized and stacked the shipboard data used in chapters two and three. J. Jaeger provided useful insights and comments on chapter one.
During the course of my PhD, I have participated in several regional workshops and meetings (GEOTOP, ArcTrain) as well as international conferences (European Geosciences Union, American Geophysical Union, International Sedimentological Congress, Association
francophone pour le savoir) where I presented results from my three chapters. My
contributions at these conferences are outlined below. Furthermore, participation in the second Expedition 341 post-cruise meeting and field trip on the Washington coast provided me with context for this project and allowed me to meet my collaborators. For the course
Nouveaux développements en océanographie (OCE 92505), I attended the Institute of Rock
Magnetism (IRM) summer school at the University of Minnesota, USA. During my PhD, I also participated in the Maria S. Merian Leg 46 in the St. Lawrence Estuary and Gulf, the Labrador Sea and Hudson Strait.
RESEARCHCOMMUNICATION
Articles in preparation
Velle, J.H., St-Onge, G., Stoner, J.S., Walczak, M.H., Mix, A.C., Jaeger, J.M. and Forwick, M. A late Pleistocene environmental magnetic record of northwestern Cordilleran Ice Sheet dynamics based on IODP Expedition 341 drill Site U1419 in the Gulf of Alaska. This manuscript will shortly be re-submitted to Quaternary Science Reviews. Velle, J.H., Walczak, M.H., Reilly, B., St-Onge, G., Stoner, J.S., Fallon, S. and Forwick, M. A high-resolution late Quaternary inclination record from IODP Expedition 341 drill Site U1419 in the Gulf of Alaska. This manuscript will shortly be submitted to Earth
and Planetary Science Letters.
Velle, J.H., St-Onge, G., Stoner, J.S., Walczak, M.H. and Forwick, M. High-resolution paleomagnetic secular variation and relative paleointensity in the Gulf of Alaska: constraints on the late Pleistocene and Holocene stratigraphy of IODP Expedition 341 Site U1418. This manuscript will be submitted to Earth and Planetary Science
Letters.
Conference contributions
Velle, J.H., St-Onge, G., Stoner, J.S., Mix, A., Walczak, M., Reilly, B. & Forwick, M., 2018. A high-resolution late Quaternary paleomagnetic secular variation record from IODP Expedition 341 drill Site U1418 in the Gulf of Alaska. 20th International sedimentological congress (ISC), August 13 to 17, Québec City, Canada. Talk. Velle, J.H., St-Onge, G., Stoner, J.S., Mix, A., Walczak, M. & Forwick, M., 2018. Late
Pleistocene and Holocene environmental magnetic record of the northwestern Cordilleran Ice Sheet dynamics based on IODP Expedition 341 drill Site U1419 in the Gulf of Alaska. European Geosciences Union (EGU), April 8 to 13, Vienna, Austria. Poster.