HAL Id: hal-02564126
https://hal.archives-ouvertes.fr/hal-02564126
Submitted on 6 Nov 2020HAL is a multi-disciplinary open access archive for the deposit and dissemination of sci-entific research documents, whether they are pub-lished or not. The documents may come from teaching and research institutions in France or abroad, or from public or private research centers.
L’archive ouverte pluridisciplinaire HAL, est destinée au dépôt et à la diffusion de documents scientifiques de niveau recherche, publiés ou non, émanant des établissements d’enseignement et de recherche français ou étrangers, des laboratoires publics ou privés.
Thomas Mangeat, Simon Labouesse, Marc Allain, Emmanuel Martin, Renaud
Poincloux, Anais Bouissou, Sylvain Cantaloube, Elise Courtaux, Elodie Vega,
Tong Li, et al.
To cite this version:
Thomas Mangeat, Simon Labouesse, Marc Allain, Emmanuel Martin, Renaud Poincloux, et al.. Super-resolved live-cell imaging using Random Illumination Microscopy. Cell Reports Methods, Elsevier, 2021, pp.100009. �10.1016/j.crmeth.2021.100009�. �hal-02564126�
Super-resolved live-cell imaging using Random Illumination Microscopy
1
2
Thomas Mangeat1, Simon Labouesse2, Marc Allain2, Emmanuel Martin3, Renaud Poincloux4, Anaïs
3
Bouissou4, Sylvain Cantaloube1, Elise Courtaux5, Elodie Vega4, Tong Li3, Aude Guénolé3, Christian
4
Rouvière1, Sophie Allard6, Nathalie Campo5, Magali Suzanne3, Xiaobo Wang3, Grégoire Michaux7, Mathieu
5
Pinot7, Roland Le Borgne7, Sylvie Tournier3, Jérôme Idier8, Anne Sentenac2
6
Corresponding author: [email protected],
7
Leading author: [email protected]
8
9
1. LITC Core Facility, Centre de Biologie Integrative, Université de Toulouse, CNRS, UPS, Toulouse,
10
31062 France.
11
2. Institut Fresnel, Aix Marseille Univ, CNRS, Centrale Marseille, Marseille, France.
12
3. LBCMCP, Centre de Biologie Intégrative (CBI), Université de Toulouse, CNRS, UPS, Toulouse, 31062
13
France.
14
4. Institut de Pharmacologie et de Biologie Structurale (IPBS), Université de Toulouse, CNRS, UPS,
15
Toulouse, France.
16
5. Laboratoire de Microbiologie et Génétique Moléculaires (LMGM), UMR5100, Centre de Biologie
17
Intégrative (CBI), CNRS, Toulouse, France.
18
6. INSERM Université de Toulouse, UPS, CNRS, Centre de Physiopathologie de Toulouse Purpan (CPTP),
19
Toulouse, France.
20
7. Univ Rennes, CNRS, Institut de Génétique et Développement de Rennes (IGDR) - UMR 6290, 35000
21
Rennes, France.
22
8. LS2N, CNRS UMR 6004, 1 rue de la Noë, F44321 Nantes Cedex 3, France.
23
24
Summary
25
Super-resolution fluorescence microscopy has been instrumental to progress in biology. Yet, the
photo-26
induced toxicity, the loss of resolution into scattering samples or the complexity of the experimental setups
27
curtail its general use for functional cell imaging. Here, we describe a new technology for tissue imaging
28
reaching a 114nm/8Hz resolution at 30 µ m depth. Random Illumination Microscopy (RIM) consists in
29
shining the sample with uncontrolled speckles and extracting a high-fidelity super-resolved image from the
30
variance of the data using a reconstruction scheme accounting for the spatial correlation of the illuminations.
31
Super-resolution unaffected by optical aberrations, undetectable phototoxicity, fast image acquisition rate and
32
ease of use, altogether, make RIM ideally suited for functional live cell imaging in situ. RIM ability to image
33
molecular and cellular processes in three dimensions and at high resolution is demonstrated in a wide range
34
of biological situations such as the motion of Myosin II minifilaments in Drosophila.
35
36
37
38
Introduction
39
Cell biology began with the light microscope in the seventeenth century. Since then, optical microscopy has
40
remained an essential tool for cell biologists: learning how cells function requires a detailed knowledge of
41
their structural organization and of the dynamic interplay of their many constituents, often over extended
42
periods of time. A decisive breakthrough in microscopy was the specific tagging of virtually any protein with
43
a fluorescent probe to visualize its location, dynamics, and potential interactions with other partners in living
44
cells. But imaging subcellular structures required improving the resolution beyond the diffraction barrier,
45
about 300 nm, which limits widefield microscopes. Furthermore, reaching the highest resolution attainable
46
while using the least possible light intensity to preserve live cell integrity raised two challenges that seemed
47
to be mutually exclusive.
48
In the past two decades, the development of super-resolution fluorescence imaging techniques have been
49
developed to break the diffraction limit, notably stimulated emission depletion (STED) (Hell and Wichmann,
50
1994; Klar and Hell, 1999), stochastic optical reconstruction microscopy and photoactivated localization
51
microscopy (STORM/PALM) (Betzig et al., 2006; Hess et al., 2006; Rust et al., 2006), or structured
52
illumination microscopy (SIM) (Heintzmann and Cremer, 1999; Gustafsson, 2000; Gustafsson et al., 2008).
53
These techniques and their later improved versions have provided impressive details of subcellular structures
54
(for a review see Sahl et al., 2017). But each of them present caveats that limit their general use for live-cell
55
imaging. Saturated fluorescence (STED), pointillists methods (STORM and PALM) and intrinsic
56
fluorescence fluctuation approaches (Dertinger et al., 2009) reach their performance at the cost of intense
57
light shining and/or prolonged data acquisition time that restrict imaging to small volumes of observation or
58
slow temporal dynamics. Therefore, the vast majority of what is being looked at by super-resolution
59
microscopy (SRM) is fixed cells with the possibility of sample distortions and artifacts induced by chemical
60
treatments (Richter et al., 2017).
61
Currently, Structured illumination microscopy (SIM) presents the best compromise between spatial and
62
temporal resolutions with low toxicity for live imaging. The SIM super-resolved image is formed
63
numerically from several low-resolution images obtained for different positions and orientations of a
64
periodic illumination pattern. The success of the numerical reconstruction relies on a precise knowledge of
65
the illumination. When aberrations, possibly induced by the sample itself, distort the illumination pattern, the
66
reconstruction fails. Thus, the best SIM resolution, about 120 nm transversally and 360 nm axially, is
67
obtained with thin, transparent cell monolayers (Shao et al., 2011). Others versions of SIM have been
68
introduced for imaging subcellular processes in thicker samples, but at a lower xyz resolution, 220 x 220 x
69
370 nm for the lattice light sheet version (Chen et al., 2014; O’Shaughnessy et al., 2019), and about 160 x
70
160 x 400 nm for the spot-scanning illumination (AiryScan) (Sivaguru et al., 2018).
71
Recently, it has been demonstrated theoretically (Idier et al., 2018) and experimentally (Mudry et al., 2012;
72
Labouesse et al., 2017) that periodical or focused illumination in SIM could be replaced by totally
73
uncontrolled speckles. Counter-intuitively, the low-resolution images obtained with unknown speckle
74
illuminations could be processed into a sample image of better resolution than classical widefield
75
microscopy. Potentially, speckle illumination appeared to be ideally suited for live cell imaging: ease of use
(no lengthy monitoring of experimental drifts, no time-consuming calibration protocols when changing the
77
sample, objective or wavelength), widefield configuration, low levels of energy transfer to the samples and
78
an extremely simple experimental setup. Yet, the resolution was too low for imaging subcellular dynamics.
79
In the present work, we developed a technique based on speckle illumination, that we call Random
80
Illumination Microscopy (RIM), which achieves a super-resolution level comparable to the best 3D periodic
81
SIM, with the ease of use and application range of widefield microscopy. The gain of resolution was
82
obtained using an original data processing combining the statistical approach of fluctuation microscopy with
83
the demodulation principle of structured illumination microscopy. Most importantly, speckle illumination is
84
insensitive to optical aberrations and scattering by thick specimens, and shows minimal phototoxicity,
85
making RIM a method of choice for live-cell imaging in situ.
86
RIM ability to visualize biological processes in 3D, at high resolution and over extended periods of time is
87
demonstrated, in comparison with the best available imaging techniques, on a wide range of macromolecular
88
complexes and subcellular structures in action, such as the Z-ring of dividing bacterial cells, the dynamic
89
actin network of macrophage podosomes, the mobility of proliferating cell nuclear antigen (PCNA) during
90
DNA replication, or kinetochore dynamics in mitotic S. pombe cells. Analysis of multicellular samples was
91
illustrated by imaging the intestine microvilli of C. elegans, the 3D motion of myosin minifilaments within
92
developing Drosophila tissues, or the collective invasive migration of border cells in fly ovary. These
93
examples illustrate the wide range of possible applications of RIM for imaging live cell functions and related
94
pathologies in vivo. The simplicity of RIM experimental setup and operation mode should hopefully
95
democratize super-resolution microscopy, at low cost, in cell biology laboratories.
96
97
Results98
99
Principle of RIM100
In RIM, a super-resolved reconstruction of the sample is formed numerically from several low-resolution
101
images of the sample recorded under different uncontrolled speckle illuminations, hereafter named speckle
102
images. A speckle is the light pattern formed by a coherent (laser) beam after the reflection or transmission
103
by a random medium (Figure 1A). To implement RIM, a standard widefield epi-fluorescence microscope
104
was modified by replacing the lamp with different laser diodes and introducing a Spatial Light Modulator
105
(SLM), displaying random phase masks along the illumination path. Several hundreds of different speckles
106
could be generated per second by changing the SLM display (Figure 1A-B; Movie S1).
107
The random bright grains of the speckle illumination, depicted in Figure 1A, ensure a quasi-pointillist
108
excitation of the fluorescence, which connects RIM to the field of high-density fluctuation microscopy
109
(dSTORM) (Baddeley et al., 2009), as illustrated in Figure 1B. Yet, in fluctuation microscopy, the excited
110
fluorophores are sparser and appear at uncorrelated positions while in RIM they are excited collectively
111
within the speckle bright grains over a typical distance of half a wavelength corresponding to the speckle
112
correlation length. Due to this collective excitation, RIM requires significantly less images to cover the
113
whole sample and a smaller integration time than fluctuation microscopy.
The super-resolved reconstruction is formed from the speckle images using a reconstruction scheme named
115
AlgoRIM. AlgoRIM is based on a rigorous mathematical analysis (Idier et al., 2018) that takes advantage of
116
the spatial correlation of the fluorophore excitation induced by the speckle to gain a two-fold increase in
117
resolution. The fluorescence high frequency features are extracted from the variance of the raw images, as in
118
fluctuation microscopy, through a demodulation process using the speckle autocorrelation as a carrier wave,
119
as in Structured Illumination Microscopy. AlgoRIM does not invoke the sparsity of the excitation or the
120
binarity of the fluorescence for achieving super-resolution and, even though it is based on the variance of the
121
speckle images, it yields a linear response to brightness (for more details, see Supplemental information).
122
In Figure 1C, we compare the reconstructions of the same sample of tagged F-actin network in podosomes
123
obtained by second-order statistics dSTORM (NanoJ software, Super Resolution Radial Fluctuation)
124
(Gustafsson et al., 2016) and RIM. Podosomes are actin-rich, cell adhesion structures applying protrusive
125
forces on the extra cellular environment, recently observed by 3D dSTORM (Bouissou et al., 2017).
126
Remarkably, the RIM reconstruction showed more details than dSTORM at the level of podosomes nodes,
127
and was closer to a Scanning Electron Microscopy (SEM) image of a similar sample. Importantly, RIM
128
required ten times less images, used ten times less power and was two hundred time faster than dSTORM.
129
In Figure 1D, we compare the reconstructions and the raw images of the same sample of vinculin-tagged
130
podosomes attached to the substrate obtained by RIM and SIM (by displaying either random or periodic
131
masks on the SLM). The resolution and overall dynamic range of the two techniques are remarkably similar.
132
To evaluate more precisely the resolving power of RIM, we imaged a calibrated DNA nanoruler (SIM 140
133
YBY), where two red fluorophores (Alexa 561) attached at the DNA ends are separated by 140 nm, and are
134
equidistant (70 nm) to a green fluorophore (Alexa 488). In Figure 1E, we compare the RIM reconstruction to
135
the SIM image given by the commercial two-color Zeiss SIM Elyra system. Figure 1E shows that both RIM
136
and SIM succeeded in separating the red fluorophores and accurately located the green middle one. RIM
137
resolution was the same of that of SIM with an average red-to-green distance of about 70 nm in both cases
138
(compare the graphs in Figure 1E). Additional experiments with calibrated samples indicated that RIM
139
resolution matched that of the best periodic SIM techniques, about 120 nm for fluorophores emitting at 514
140
nm with an objective of NA=1.49 (Figures S1E and S3A).
141
In these types of experiment where the sample does not distort the illumination pattern, the major interest of
142
RIM compared to SIM is the extreme simplicity of the experimental protocol which can be performed in less
143
than ten minutes even for two-color imaging. Since the illumination patterns do not need to be known, the
144
only tuning required before imaging consists in checking the focus. In contrast, in the case of SIM, the
145
knowledge of the illumination patterns is mandatory, which implies a specific sample preparation and a
146
precise microscope alignment and polarization control for the two colors, which, altogether, may take about
147
two hours (Demmerle et al., 2017). Another interest of RIM, compared to SIM, is the robustness and
ease-of-148
use of its inversion procedure. AlgoRIM required the tuning of 4 parameters, the widths of the observation
149
point spread function and speckle correlation and two Tikhonov parameters (see Supplemental information),
150
while at least 7 were needed for the SIM reconstruction procedure, in particular for recovering the
illumination patterns from the raw images. This last task is particularly delicate as it can be jeopardized by a
152
too big difference between the excitation and fluorescence wavelengths (Figure S1F).
153
154
155
156
RIM allows high fidelity super-resolved imaging in three-dimensions
157
RIM three-dimensional (3D) imaging is obtained by translating the sample through the focal plane (Movie
158
S1) and by recording several speckle images at each position. The speckle illumination and the
variance-159
based data processing ensure an efficient optical sectioning (Ventalon and Mertz, 2005 ; Ventalon et al,
160
2007). Note that, when necessary, the spherical aberration induced by the index mismatch between the
161
objective immersion oil and the mounting medium has been accounted for when reconstructing the 3D image
162
(Sibarita, 2005).
163
To test the fidelity of the super-resolved images obtained with 3D RIM, we focused on dense filamentous
164
structures. We imaged the vimentin network from fixed HUVEC cells and reconstructed the whole network
165
from 200 speckles per slice, 12 slices and an axial step of 100 nm (see in Figure 2A the color-coded axial
166
position of the filaments, and Movie S2). As seen in Figure 2B, RIM transverse resolution was much better
167
than that of confocal microscopy and similar to that of STED microscopy, about 120 nm (with fluorophores
168
emitting at 700 nm and a NA of 1.49). Interestingly, RIM reconstruction was free from common artefacts
169
such as the disappearance or merging of filaments (Marsh et al, 2018) and it provided the same image as
170
STED both in the dense and sparse regions of the sample. A total of 1 kW/cm², five times less than that
171
required for confocal microscopy, was delivered to the entire volume (30 µ m x 30 µ m field of view) in less
172
than 3 seconds.
173
To further investigate the axial resolution, we tested the ability of RIM to resolve the cell division ring of the
174
bacteria Streptococcus pneumoniae. Cells were labeled with fluorescent FtsZ, an homolog of tubulin that can
175
polymerize and assemble into a ring, called the Z-ring, at the site were the septum forms during cell division.
176
This ring whose diameter ranges from 0.3 to 0.9 µm depending on the division stage (Fleurie et al., 2014) is
177
roughly perpendicular to the observation focal plane when the bacteria lies on the substrate, which makes it
178
ideally suited for checking RIM axial resolution. Z-rings were imaged in live bacterial cells transferred in
179
minimum medium using 3D-PALM or RIM (Figure 2C). When comparing RIM and PALM images, note that
180
the FtsZ protein was tagged differently to allow for the specific requirements of PALM. This may affect
181
differently the level of expression of FtsZ and the efficiency of Z-ring formation. RIM image reconstructions
182
clearly revealed the heterogeneous structure of Z-rings formed of discontinuous clusters of FtsZ protein, with
183
highly different levels of fluorescence intensity, though at a lesser resolution than PALM equipped with
184
adaptive optics (Zheng et al., 2017). Interestingly, in the transverse cut at the equatorial plane of a late
185
dividing cell, significant levels of FtsZ protein were observed in-between the two nascent Z-rings on each
186
side of the central ring that disassembles as it constricts, suggesting a constant exchange of free and
ring-187
associated FtsZ molecules. The resolution of RIM was estimated to be 120 nm transversally and 300 nm
188
axially, which is equivalent to that of the best SIM (Fleurie et al., 2014).
190
RIM provides super-resolved movies of live specimens at high temporal resolution and low toxicity.
191
To optimize the temporal resolution of RIM and limit phototoxicity, one should know the minimal number of
192
raw speckle images that is necessary for a faithful reconstruction of a given specimen. The latter depends on
193
the nature of sample (dense or sparse) and its dynamics. Tests on fixed samples showed that super-resolved
194
images can be obtained with only 50 speckles but at the cost of a residual illumination inhomogeneity
195
(Figure S3A). Increasing the number of speckles improves the illumination homogeneity and the signal to
196
noise ratio but movements of the live specimen during the recording may blur the reconstruction (Figure
197
S3B). The speckle images being recorded regularly during the observation time, different trade-offs can be
198
tested with the same data set. In addition to a classical processing in which the total number of speckle
199
images recorded during the experiment, T, is divided into stacks of N speckle-images for forming T/N
super-200
resolved reconstructions, we considered an interleaved reconstruction scheme in which the stacks of N
201
speckle images are shifted by Q images (with Q<N) to form T/Q super-resolved reconstructions as illustrated
202
in Figure 3B. The interleaved strategy permitted to improve the temporal resolution (by diminishing Q)
203
while keeping a good signal to noise ratio and illumination homogeneity (using large enough N). The
204
optimal choice of Q and N may vary depending on the sample.
205
To illustrate the different reconstruction strategies, we imaged the dense actin network of podosomes from
206
human macrophages under live conditions (Figure 3A and Movie S3). Podosomes are composed of an
207
approximatively 500 nm high and large F-actin protrusive core surrounded by an adhesion ring. The
208
observation of their continuous spatial reorganisation requires super-resolved imaging over tens of minutes
209
with a sub-second temporal resolution.
210
The compromise for imaging podosomes was to use stacks of 200 speckle-images in the classical
211
reconstruction scheme (Figure S3C, Movie S3). We also implemented the interleaved strategy where stacks
212
of 800 speckle images shifted by 200 to 10 images were used to form movies with temporal resolutions from
213
2.4 s to 0.12 s (Figure S3D, Movie S3). The 120 nm resolution of the RIM movie revealed actin filaments
214
linking two actin cores, in agreement with observations by electron microscopy (Figure 3B). The robust
215
estimation of podosome surpassed that obtained with live-SIM (van den Dries et al., 2019; Meddens et al.,
216
2016) or other computational methods (Marsh et al., 2018). Notably, the photobleaching and toxicity of RIM
217
was comparable to that of SIM (Figure S4D) and podosome dynamics could be observed during 20 min
218
without detectable alteration of their reorganization.
219
A second example was the dynamics of the Proliferating Cell Nuclear Antigen (PCNA) (Figure 3C and
220
Movie S4). PCNA is a protein involved in DNA replication, DNA repair, chromatin remodeling, and cell
221
cycle. Here, the temporal resolution needs were higher, but the sparsity of the sample allowed us to use only
222
150 speckles in an interleaved reconstruction strategy yielding a temporal resolution of 0.12 s. The
223
nanoclusters of PCNA were similar to those observed in fixed samples (Zessin et al., 2016). The trajectories
224
of individual spots of PCNA were recorded during 20 s during the S phase of U2OS cells (Figure 3C, 3D and
225
Movie S4). PCNA clusters mobility exhibited a fast and a slow diffusion regime, suggesting the existence of
226
at least two pools of PCNA molecules probably belonging to different functional macromolecular complexes.
The average confinement distance of the slow replication clusters was about 120 nm while the fast diffusing
228
PCNA clusters had a confinement about 200-300 nm (Figure 3E). These global results are in agreement with
229
those previously obtained by single-particle tracking (Zessin et al., 2016). This experiment demonstrates the
230
versatility of RIM, which, from the same set of data, provides both super-resolved images of the whole cell
231
nucleus at all the phases of DNA replication and a trajectory analysis of PCNA similar to that obtained by
232
single-particle tracking.
233
To illustrate the three-dimensional imaging potential and low toxicity of RIM, the mitosis of the fission
234
yeast Schizosaccharomyces pombe was recorded in a 3D movie with a temporal resolution of 20 s (Movie
235
S5). S. pombe is a rod-shaped, symmetrically dividing eukaryotic cell that splits by medial fission. S.
236
pombe possesses three chromosomes which can be tracked by live imaging during mitotic progression.
237
Mitotic chromosomes are captured by microtubules at kinetochores, which are giant protein complexes
238
assembled at the centromere of each sister chromatids. Kinetochores, fluorescently labelled on the Ncp80
239
protein, begin to align at the spindle center in phase 1 (spindle size of about 0.5µ m; Mary et al., 2015).
240
Remarkably, RIM imaging was able to visualize in xyz the 6 kinetochores attached to the three sets of sister
241
chromatids in pro-metaphase (Figure 3G). In phase 2, the spindle retained roughly the same length, and the
242
kinetochores oscillated between the two spindle pole bodies. In telophase, it was possible to observe the 3
243
kinetochores moving at each cell pole (Figure 3G). Importantly, this level of kinetochore resolution in live
244
fission yeast cells has never been attained in the past. We also noted that the metaphase to anaphase duration
245
under RIM illumination (4 min) was as expected (Figure 3H, Movie S5) indicating that the cells were not
246
detectably stressed by the repeated speckle illuminations.
247
248
RIM super-resolved imaging of optically aberrant and scattering tissues
249
A major bottleneck of a super-resolution imaging technique is its ability to keep its resolution level in
250
optically aberrant or scattering environments.
251
We used C. elegans as a model multicellular organism to test RIM performance for imaging complex tissues
252
like the worm intestine. A very high numerical aperture (TIRF objective with NA= 1.49) was selected for
253
reaching the best possible resolution. In this configuration, aberrations are important due to the optical index
254
mismatch between the worm and the mounting medium and the aberrations of the objective itself. In spite of
255
this, RIM could image fluorescent ERM-1/ezrin, a protein constitutive of microvilli (microvilli are
256
membrane protrusions that increase the surface area) and could clearly reveal the periodic organization of the
257
intestine of living L4 larvae, at 15 µ m depth (Figure 4A). The periodicity of microvilli was about 120 nm
258
(Figure 4C) as confirmed by TEM images (Figure 4B).
259
In a second example, the tagged regulatory light chain of the non-muscle Myosin II motor protein, spaghetti
260
squash (sqh), was imaged in a fixed developing leg of the fly Drosophila melanogaster (Figure 4D).
261
Non‐muscle Myosin II (thereafter referred to as Myosin II) is the major molecular motor generating
262
contractile forces within non‐muscle cells. The developing leg is a tissue 110 µm deep composed of a
263
cylindrical columnar epithelium surrounded by a thin squamous epithelium (inset Figure 4D and Figure
264
S4B). We tested RIM ability to produce super-resolution 3D images of Sqh-RFP in different regions of the
apical plane of the columnar epithelial cells (Figure 4D). The squamous epithelium and the presence of
266
numerous interstitial lipid droplets were important source of scattering and aberrations which made imaging
267
difficult. Hence, this sample could not be imaged with periodic SIM because of the frequent disappearance
268
of the illumination grid (see Figure S4C and Movie S6). The RIM images were thus compared to that
269
obtained with the more robust focused scanning SIM known commercially as AiryScan. RIM images were
270
better resolved than that of AiryScan (Figure 4E-F, Movie S7), and Fourier Ring Correlation (FRC)
271
(Banterle et al., 2013) estimated a 113 nm Fourier Image Resolution (FIRE) resolution (Nieuwenhuizen et
272
al., 2013) for RIM compared to 189 nm FIRE for AiryScan. This difference in resolution enabled RIM to
273
distinguish the myosin dots aligned on the actin cortical networks of the cells. Imaging over a field of view
274
of 110 µm x 110 µm required 0.4 s for RIM and 4.3 s for AiryScan. In addition, a careful investigation on
275
several samples showed that, for the same energy (4 mJ) injected per voxel, RIM induced significantly less
276
bleaching than AiryScan (Figure S4D).
277
278
RIM multiscale imaging, from molecular motion to cell migration
279
To investigate the ability of RIM to visualize macromolecular motions deep inside several living tissues, we
280
focused on Myosin II dynamics. Non-muscle Myosin II molecules are heterohexamers composed of two
281
heavy chains, two regulatory light chains (Sqh), and two essential light chains. Myosin II hexamers assemble
282
in an antiparallel manner to form 300 nm long minifilaments, comprising about 15 Myosin II dimers, that
283
can be labeled at both ends with Sqh-RFP, forming a characteristic fluorescent doublet (Figure 5A), (Hu et
284
al, 2017). Up to now, doublets of Myosin II minifilaments have only been observed in cultured cells (Beach
285
et al, 2014 ; Fenix et al., 2016 ; Hu et al., 2017 ). In this work, we imaged Myosin II in different live
286
Drosophila epithelia. Epithelial cells harbor three main pools of Myosin II, (Figure 5B II), two located
287
apically called the junctional Myosin II accumulating at cell-cell adhesive contacts and the medial myosin
288
inside the cell. A third pool is located basally at focal adhesion, and faces the basement membrane.
289
We first imaged the basal plane of follicular epithelial cells (FEC) of Drosophila egg chamber at stage 9
290
where the imaging conditions, 1µ m deep from the coverslip, are benign (Figure S5A-B). Myosin II filaments
291
are organized in parallel bundles lying along actin filaments (Figure S5F) (He et al., 2010). Aligned
292
fluorescent spots of Myosin II (Sqh-RFP) were well observed in the RIM widefield view (Figure S5C taken
293
from Movie S8) and their motion, correlated by pair, confirmed their doublet nature (Figure S5D). In Figure
294
S5E, two-color RIM imaged labeled Myosin II (Sqh-RFP) together with labeled Actin (Utrophin-ABD-GFP)
295
and disclosed the interpenetration and alignment of Myosin and Actin filaments as expected (see the high
296
magnifications in S5E, II and III).
297
For challenging the ability of RIM to visualize Myosin II molecular motion deep into a complex living
298
tissue, we turned to the developing Drosophila leg whose imaging difficulty has already been pointed out in
299
Figure 4D. Figure 5C shows a RIM 3D widefield view of the Myosin II (Sqh-RFP) network at the apical
300
plane, 8 μm deep inside the live developing leg. RIM successfully visualized the pool of Myosin II
301
concentrated at cell-cell contacts (junctional Myosin II). A zoom on this junctional Myosin revealed the
302
distinctive spots corresponding to Myosin heads and showed the ability of RIM to follow the 3D motion of a
single minifilament during 20 seconds (Figure 5D), independently of its orientation in the xyz directions
304
(Figure 5F). Remarkably, single minifilaments could also be imaged at the basal plane of the epithelial cell,
305
at 30 µm depth, despite the optically aberrant environment (Figure 5E). To our knowledge, no other imaging
306
technique could follow, at such depths within a live tissue, the 3D displacement of myosin with such a
307
resolution.
308
For a global functional analysis of Myosin II dynamics, taking advantage of the high spatio-temporal
309
resolution of 3D RIM, we looked at the dorsal thorax of Drosophila pupal notum epithelium (Figure 6A). It
310
is a single layer epithelium composed of epidermal cells and sensory organ precursor cells (SOP). Figure 6C
311
shows a 3D RIM widefield view of the Myosin II networks at the apical plane, 7 μm from the coverslip. RIM
312
clearly detected the two distinct pools of Myosin II, the medial Myosin II forming irregular networks inside
313
the cells, and the junctional Myosin II accumulating neatly at cell-cell contacts. Each cell having its own
314
pool of junctional Myosin II at the adhesive contacts, the 3D RIM image shows two parallel dotted lines
315
corresponding to minifilaments myosin heads, not regularly spaced though in contrast to some previous
316
observations on other fixed epithelial cells (Ebrahim, 2013). The fluorescence intensity plot between these
317
two junctional myosin layers (red arrowheads in Figure 6C) indicates a 130 nm resolution. Even though this
318
type of tissue was highly optically heterogeneous, as schematically presented in Figure 6A, the resolution
319
remained constant (130 nm) over the whole field of view and was able to distinguish the Myosin filament
320
fluorescent doublets (see Movie S8). Remarkably, RIM high temporal resolution was able to visualize the
321
pulses of the medial Myosin II networks in a constant state of spatial reorganization (Martin et al., 2009)
322
(Figure 6D, Movie S8). RIM was also able to visualize the flow of junctional myosin II at the cell cortex
323
(Rauzi et al., 2010) (Figure 6E, Movie S8).
324
In Figure 6C, we noted that the 3D image reconstruction of medial Myosin II network was rather uniformly
325
colored. This observation suggested that apical myosin is spatially restricted to a small section (about 300 nm
326
thick) of the epidermal cells (see the color scale bar). In line with this conclusion, transmission electron
327
microscopy images on sections along the apical-basal axis, showed that the thickness of the adhesive
cell-328
cell contact, was of only 300 nm (Figure 6B part I), which corresponds well to the Myosin II belt previously
329
described (Ebrahim et al., 2013). RIM high axial resolution was also illustrated in Figure 6F where it
330
elegantly allowed to discriminate the lower apical positioning and larger thickness of the Myosin II networks
331
of sensory organ precursor cells compared to that of surrounding epidermal cells: at Z=0 nm up to Z= 600
332
nm Myosin medial network was well observed in SOP cells, while medial Myosin of the neighboring
333
epidermal cells, barely detectable at Z=200 nm, was well observed at Z=400 nm and Z=600 nm. These
334
observations, summarized in the cartoon Figure 6B, come at variance with a previous conclusion that Myosin
335
II was mostly junctional in neighboring non-SOP cells (Couturier et al., 2017).
336
The above results underscored the versatility of RIM for imaging a variety of tissues from large fields of
337
views to macromolecular motion. In the following experiment, we show that RIM can also help visualizing
338
large scale cell movements. We chose to focus on a process of collective cell migration occurring deep in a
339
tissue, the migration of border cells in Drosophila ovary labeled on F-actin by UtrABD-GFP. At stage 9,
340
these border cells perform an invasive migration on the intervening nurse cells to finally reach the oocyte at
stage 10. A 75 min movie (Movie S9) shows, with a constant image quality, the migration of border cells
342
from the anterior epithelial surface to the center, 60 microns deep, of the egg chamber. In addition to the
343
super-resolved reconstructions, classical widefield images were obtained by simply summing the speckle
344
frames as proposed in (Mudry et al, 2012). The widefield images, which resemble transmission-microscopy
345
images thanks to the out-of-focus fluorescence (Shain et al., 2017), permit to locate the migrating cells in its
346
complex environment (Figure 7A). The migration process was clearly unaffected by the 200,000 speckles
347
illumination. Remarkably, a constant transverse resolution was obtained, whatever the position of the cells.
348
At the end of the migration, close to the oocyte, the resolution was still about 160 nm (Figure 7B).
349
Altogether, these data demonstrate the ability of RIM to image deep inside living tissues, with high
350
resolution and no apparent toxicity.
351
352
Discussion
353
RIM is a simple live-cell imaging technique, based on speckle illumination of the samples, that combines
354
super-resolution, robustness to aberration and scattering, low toxicity, and good temporal resolution which,
355
altogether, makes it particularly suited for imaging intracellular dynamics from molecular motion to
356
collective cell migration in thick specimens.
357
358
Simplicity of implementation and ease of use of RIM
359
The first asset of RIM is the simplicity of its implementation. RIM provides a super-resolved reconstruction
360
of the sample from a set of low-resolution images recorded under different uncontrolled speckles. Any
361
widefield microscope can be adapted to RIM by replacing the lamp by a laser and introducing a diffuser on
362
the illumination path to form the speckles. The knowledge of the illumination patterns being unnecessary,
363
RIM tuning protocol is similar to that of classical widefield microscopy. Multicolor imaging requires only
364
multilaser excitation and appropriate filtering as in widefield microscopy (Figures 1 and S5).
365
366
Super-resolution and fidelity to the true fluorescence
367
The second asset of RIM lays in its original inversion scheme, algoRIM, which yields reconstructions true to
368
the actual fluorescence dynamic range with a resolution of 120 nm transversally and 300 nm axially,
369
matching that of the best 3D SIM (Figures 1, 2, S1 and S2).
370
The super-resolution achieved by RIM can be explained on theoretical grounds. A mathematical study has
371
demonstrated that a twice-better super-resolved sample reconstruction could be theoretically obtained from
372
the covariance of the speckle images provided that the Fourier supports of the speckle autocorrelation and
373
observation point spread function are similar (Idier et al., 2018; summarized in Supplemental information).
374
In practice, each speckle image is deconvolved using a Wiener filter to reduce the width of the point spread
375
function and the statistic noise. Then, the variance of the speckle images is formed. Last, the fluorescence is
376
estimated iteratively so as to minimize the distance between the rigorous model of the variance accounting
377
for the speckle autocorrelation, and the empirical variance (see Supplemental information). This critical
378
inversion step restores the fluorescence dynamic range and improves significantly the resolution compared to
the process consisting in taking the standard deviation of the deconvolved speckle images (Taylor et al.,
380
2018; Ventalon et al, 2007) (Figure S1E). Importantly, the reconstruction scheme does not use any
381
regularisation except for the one needed for stabilizing the solution with respect to noise. As a result,
382
algoRIM is successful on both dense and sparse fluorescent samples and avoids the common artefacts
383
encountered in fluctuation or sparsity-based microscopy such as the over or underestimation of strongly or
384
weakly labelled features (Marsh et al, 2018). Hence, as compared with the SEM image, RIM showed more
385
details than dSTORM of the densely fluorescent podosome nodes (Figure 1C), and when the same vimentin
386
filaments were observed by RIM or by STED microscopy, the same image was obtained at the same
387
resolution (Figure 2B), which underscored the fidelity of RIM image reconstruction.
388
389
Robustness to aberrations and scattering
390
To provide super-resolved reconstructions, the inversion procedure of RIM requires data with sufficient
391
signal to noise ratio and a model for the point spread function and the speckle autocorrelation. Contrary to
392
SIM, RIM is not affected by the illumination deformations induced by the sample, the lens imperfections or
393
the experimental drifts as the speckle autocorrelation is insensitive to aberration or scattering (Goodman,
394
2007). Moreover, the speckle dynamic range being much larger than the dynamic range of periodic grids,
395
RIM images are more contrasted than SIM images and less affected by the background noise as seen in
396
Figure 1D. As a result, RIM provided super-resolved reconstructions in conditions where SIM failed (Figure
397
S4C, MovieS6). Moreover, the transverse resolution, about 120 nm, could be maintained over large fields of
398
view (100 µ m x 100 µm) and over extended periods of time (more than an hour) (Figures 6 and 7 and Movie
399
S9). To our knowledge, such a constancy of performance in space and time when observing thick live
400
samples has only been obtained (though at a lower transverse resolution of about 230 nm) with a lattice light
401
sheet microscope equipped with adaptive optics on both the illumination and observation paths to minimize
402
specimen-induced optical aberrations (Liu et al., 2018). The unique combination of super-resolution and
403
resistance to aberrations of RIM was demonstrated in a spectacular way by the visualization of Myosin II
404
minifilaments motion deep inside (30 µ m) a developing Drosophila leg (Figure 5). Previously, minifilaments
405
had only been observed in cultured cells, never in thick living tissues (Fenix et al., 2016; Hu et al., 2017).
406
407
Low toxicity
408
RIM phototoxicity level was clearly compatible with functional imaging: it did not detectably affect the
409
podosomes reorganization during 20 min recording time (Figure 3), nor the collective migration of border
410
cells during 75 min (Figure 7, Movie S9). Most remarkably, RIM did not alter the highly stress-sensitive
411
mitosis duration in S. pombe when imaging kinetochore motion from prophase to telophase (Figure 3).
412
413
Temporal resolution
414
Temporal resolution is a weak point of all super-resolution microscopy methods, especially when large fields
415
of view are required. In this work, the temporal resolution of RIM was essentially limited by the read-out
416
time and electronic noise of the camera. An important feature of RIM is that the number of speckle images
used for forming one super-resolved image can be adapted to the sample dynamics after the recording: from
418
the same data set, corresponding to thousands of speckle frames recorded every 12 ms, one can derive
419
different movies of increasing temporal resolution, though at the cost of a deteriorated illumination
420
homogeneity. In practice, 150 speckles were sufficient to observe the sparse and fast moving PCNA (Figure
421
3C). In addition, the exchangeable role of each individual speckle frame makes RIM particularly well
422
adapted to interleaved reconstruction. Hence, shifting sets of 800 speckles by 10 speckles provided a
423
seemingly continuous sliding of myosin molecules at a temporal resolution of 120 ms (Movie S8).
424
425
Which perspectives?
426
RIM combines the key advantages of SIM such as super-resolution, low toxicity, good temporal resolution,
427
no need for specific fluorophores, but with the unrivalled ease of use of widefield fluorescence microscopy
428
and the ability to image deep into samples without sophisticated adaptive optics. Of course, there is room for
429
improvements. Hence, faster cameras with continuously improving data acquisition rate, multifocus
430
techniques to record several planes of the sample simultaneously (Abrahamsson et al., 2013) as well as the
431
use of complementary speckle sequences (Gateau et al., 2017) for reaching the illumination homogeneity
432
faster, should ameliorate the temporal resolution. The development of fluorophores that emit at wavelengths
433
much larger than the excitation should alleviate the deformation of the observation point spread function to
434
probe even deeper into the sample. There is also the possibility to modify the nature of the speckle and of the
435
excitation to further improve the resolution (Labouesse et al., 2017, Negash et al. 2018).
436
To conclude, we believe that RIM will fill the expectations of cell biology laboratories, in line with the
437
growing need for simple, fast, super-resolved functional imaging of live-cells within normal or pathological
438
tissues or model organisms. It is worth noting that the mathematical concepts of RIM applies to all imaging
439
techniques in which the recorded data are linearly linked to the sought parameter times an excitation field.
440
Ultrasound imaging, diffraction microscopy, microwave scanning, photo-acoustic imaging among others,
441
could benefit from the philosophy of this novel approach.
442
443
Acknowledgements
444
We thank François Payre, Paul Mangeat and Malek Djabali for proofreading the manuscript. We thank the
445
Imaging Core TRI and Drosophila facilities of the CBI, and Isabelle Fourqueaux (CMEAB) for SEM
446
imaging. We thank INSERM Plan Cancer 2014-2019 and Toulouse Cancer Foundation for partial financial
447
support. We thank David Villa for video editing (https://www.scienceimage.fr/).
448
449
Author contributions
450
T.M., S.L., M.A., J.I. and A.S. conceived the project. A.S., M.A., S.L., and J.I. elaborated the theoretical RIM
451
concept. S.L. developed and implemented the reconstruction method algoRIM. T.M. adapted algoRIM to the
452
experimental dataset and made all RIM reconstructions, figures and movies. T.M. and T.L. implemented and
453
automatized the RIM experiment. T.M. analysed the data with the help of all other authors. R.P., and A.B.
454
prepared macrophages and provided the SEM images of podosomes and the high-density STORM raw
images which were processed by T.M. G.M. prepared the C. elegans and provided its EM image. E.M. and
456
T.M. designed the Drosophila leg experiments using SIM, RIM and Airyscan. M.S., R.L.B., and X.W.
457
supervised the molecular stainings of non-muscle Myosin II in the Drosophila. T.M., M.P., and R.L.B. did
458
the RIM and EM imaging of the Drosophila pupal notum. E.V. provided the SIM images from Elyra Zeiss.
459
S.A., and C.R. performed the STED images of vimentin in HUVEC cells. S.C., N.C. and E.C. provided the
460
3D PALM images of S. pneunomia. A.G. made the U2OS cell lineage and PCNA staining for RIM live
461
imaging. C.R. made the S. pombe cell lineage for kinetochore RIM imaging. X.W. supervised the strain and
462
sample preparation of Drosophila ovary for border cells migration experiments. A.S. and T.M. wrote the
463
manuscript. All authors discussed the results and commented on the manuscript.
464
465
Declaration of interests
466
AlgoRIM described herein is covered by a provisional invention statement filed by S.L., T.M., J.I., M.A.,
467
and A.S. and covered by the CNRS.
References
Abrahamsson, S., Chen, J., Hajj, B., Stallinga, S., Katsov, A.Y., Wisniewski, J., Mizuguchi, G., Soule, P., Mueller, F., Darzacq, X., et al. (2013). Fast multicolor 3D imaging using abberation-corrected multifocus microscopy. Nat. Methods 10, 60-63.
Ayuk, R., Giovannini, H., Jost, A., Mudry, E., Girard, J., Mangeat, T., Sandeau, N., Heintzmann, R., Wicker, K., Belkebir, K., et al. (2013). Structured illumination fluorescence microscopy with distorted excitations using a filtered blind-SIM algorithm. Opt. Lett. 38, 4723-4726.
Baddeley, D., Jayasinghe, I.D., Cremer, C., Cannell, M.B., and Soeller, C. (2009). Light-induced dark states of organic fluorochromes enable 30 nm resolution imaging in standard media. Biophys. J. 96, L22-L24. Ball, G., Demmerle, J., Kaufmann, R., Davis, I., Dobbie, I.M., and Schermelleh, L. (2015). SIMcheck: A toolbox for successful super-resolution structured illumination microscopy. Sci Rep 5: 15915.
Banterle, N., Bui, K.H., Lemke, E.A., and Beck, M. (2013). Fourier ring correlation as a resolution criterion for super-resolution microscopy. J. Struct. Biol. 183, 363–367.
Beach, J.R., Shao, L., Remmert, K., Li, D., Betzig, E., and Hammer, J.A. (2014). Nonmuscle myosin II isoforms coassemble in living cells. Curr. Biol. 24, 1160-1166.
Bergé, M.J., Mercy, C., Mortier-Barrière, I., Vannieuwenhze, M.S., Brun, Y. V., Grangeasse, C., Polard, P., and Campo, N. (2017). A programmed cell division delay preserves genome integrity during natural genetic transformation in Streptococcus pneumoniae. Nat. Commun. 8:1621.
Bertero, M. (1998). Introduction to inverse problem in imaging, Taylor and Francis Group, CRC press, Boca Raton.
Betzig, E., Patterson, G.H., Sougrat, R., Lindwasser, O.W., Olenych, S., Bonifacino, J.S., Davidson, M.W., Lippincott-Schwartz, J., and Hess, H.F. (2006). Imaging intracellular fluorescent proteins at nanometer resolution. Science 313, 1642-1645.
Bouissou, A., Proag, A., Bourg, N., Pingris, K., Cabriel, C., Balor, S., Mangeat, T., Thibault, C., Vieu, C., Dupuis, G., et al. (2017). Podosome Force Generation Machinery: A Local Balance between Protrusion at the Core and Traction at the Ring. ACS Nano 11, 4028–4040.
Brenner, S. (1974). The genetics of Caenorhabditis elegans. Genetics 77, 71-94.
De Chaumont, F., Dallongeville, S., Chenouard, N., Hervé, N., Pop, S., Provoost, T., Meas-Yedid, V., Pankajakshan, P., Lecomte, T., Le Montagner, Y., et al. (2012). Icy: An open bioimage informatics platform for extended reproducible research. Nat. Methods 9, 690–696.
Chen, B.C., Legant, W.R., Wang, K., Shao, L., Milkie, D.E., Davidson, M.W., Janetopoulos, C., Wu, X.S., Hammer, J.A., Liu, Z., et al. (2014). Lattice light-sheet microscopy: Imaging molecules to embryos at high spatiotemporal resolution. Science 346, 1257998.
Chenouard, N., Bloch, I., and Olivo-Marin, J.C. (2013). Multiple hypothesis tracking for cluttered biological image sequences. IEEE Trans. Pattern Anal. Mach. Intell. 35, 2736–2750.
Couturier, L., Mazouni, K., Bernard, F., Besson, C., Reynaud, E., and Schweisguth, F. (2017). Regulation of cortical stability by RhoGEF3 in mitotic Sensory Organ Precursor cells in Drosophila. Biol. Open 6, 1851-1860.
Daniel, K., Icha, J., Horenburg, C,D., Norden, C., Mansfeld, J.(2018). Conditionalcontrol of fluorescent protein degradation by an auxin-dependent nanobody. Nat Commun. 9:3297.
Demmerle, J., Innocent, C., North, A.J., Ball, G., Müller, M., Miron, E., Matsuda, A., Dobbie, I.M., Markaki, Y., and Schmermelleh, H. (2017). Stategic and practical guidelines for successful structure illumination microscopy. Nat. Protoc. 12, 988-1010.
Dertinger, T., Colyer, R., Iyer, G., Weiss, S. & Enderlein, J. (2009). Fast, background-free, 3D super-resolution optical fluctuation imaging (SOFI). Proc. Natl. Acad. Sci. U.S.A. 106, 22287-22292. Ebrahim, S., Fujita, T., Millis, B.A., Kozin, E., Ma, X;, Kawamoto, S., Baird, M.A., Davidson, M., Yonemura, S., Hisa, Y., et al. (2013). NMII forms a contarctile transcellular sarcomeric network to regulate apical cell junctions and tissue geometry. Cur. Biol. 23, 731-736.
Eckart, C., and Young, G. (1936). The approximation of one matrix by another of lower rank. Psychometrika
1, 211–218.
Fenix, A.M., Taneja, N., Buttler, C.A., Lewis, J., Van Engelenburg, S.B., Ohi, R., and Burnette, D.T. (2016). Expansion and concatenation of non-muscle myosin IIA filaments drive cellular contractile system formation during interphase and mitosis. Mol. Biol. Cell. 27, 1465-1478.
Fleurie, A., Lesterlin, C., Manuse, S., Zhao, C., Cluzel, C., Lavergne, J.P., Franz-Wachtel, M., MacEk, B., Combet, C., Kuru, E., et al. (2014). MapZ marks the division sites and positions FtsZ rings in Streptococcus pneumoniae. Nature 516, 260–262.
Gateau, J., Rigneault, H., and Guillon, M. (2017). Complementary Speckle Patterns: Deterministic Interchange of Intrinsic Vortices and Maxima through Scattering Media. Phys. Rev. Lett. 118, 043903. Gho, M., Bellaiche, Y., and Schweisguth, F. (1999). Revisiting the Drosophila microchaete lineage : a novel intrinsically asymmetric cell division generates a glial cell. Development 126, 3573-3584.
Goodman, J. W. (2007). Speckle Phenomena in Optics : Theory and Applications (Roberts, Greenwood Village, Colorado).
Guo, Y., Li, D., Zhang, S., Yang, Y., Liu, J.J., Wang, X., Liu, C., Milkie, D.E., Moore, R.P., Tulu, U.S., et al. (2018). Visualizing Intracellular Organelle and Cytoskeletal Interactions at Nanoscale Resolution on
Millisecond Timescales. Cell 175, 1430-1442.e17.
Gustafsson, M.G.L. (2000). Surpassing the lateral resolution limit by a factor of two using structured illumination microscopy. J. Microscopy 198, 82-87.
Gustafsson, M.G.L., Shao, L., Carlton, P.M., Wang, C.J.R., Golubovskaya, I., Cande, W.Z., Agard, D.A., and Sedat, J.W. (2008). Three dimentional resolution doubling in wide-field fluorescence microscopyby
structures illumination. Biophys. J. 94, 4957-4970.
Gustafsson, N., Culley, S., Ashdown, G., Owen, D.M., Pereira, P.M., and Henriques, R. (2016). Fast live-cell conventional fluorophore nanoscopy with ImageJ through super-resolution radial fluctuations. Nat.
Commun. 7:12471.
He, L., Wang, X., Tang, H.L., and Montell, D.J. (2010). Tissue elongation requires oscillating contractions of a basal actomyosin network. Nat. Cell Biol. 12, 1133–1142.
Heintzmann, R., and Cremer, C. (1999). Laterally modulated excitation microscopy: improvement of resolution by using a diffraction grating. Proc SPIE. 3568, 185–96.
Hell, S.W., and Wichmann, J. (1994). Breaking the diffraction limit by stimulated emission : stimulated-emission-depletion fluorescence microscopy. Opt. Lett. 19, 780-782.
Hess, S.T., Girirajan, T.P.K., and Mason, M.D. (2006) Ultra-high resolution imaging by fluorescence photoactivation localization microscopy. Biophys. J. 91, 4258-4272.
Hu, S., Dasbiswas, K., Guo, Z., Tee, Y.H., Thiagarajan, V., Hersen, P., Chew, T.L., Safran, S.A., Zaidel-Bar, R., and Bershadsky, A.D., (2017). Long-range self-organization of cytoskeletal myosin II filament stacks. Nat. Cell Biol. 19, 133-141.
Klar, T.A., and Hell, S.W. (1999). Subdiffraction resolution in far-field fluorescence microscopy. Opt. Lett. 24, 954-956.
Idier, J., Labouesse, S., Allain, M., Liu, P., Bourguignon, S., and Sentenac, A. (2018). On the Superresolution Capacity of Imagers Using Unknown Speckle Illuminations. IEEE Trans. Comput. Imaging 4, 87–98. Labouesse, S., Negash, A., Idier, J., Bourguignon, S., Mangeat, T., Liu, P., Sentenac, A., and Allain, M. (2017). Joint Reconstruction Strategy for Structured Illumination Microscopy with Unknown Illuminations. IEEE Trans. Image Process. 26, 2480–2493.
Liu, T.L., Upadhyayula, S., Milkie, D.E., Singh, V., Wang, K., Swinburne, I.A., Mosaliganti, K.R., Collins, Z.M., Hiscock, T.W., Shea, J., et al. (2018). Observing the cell in its native state: Imaging subcellular dynamics in multicellular organisms. Science 360, eaaq1392.
Marsh, R.J., Pfisterer , K., Bennett, P., Hirvonen, L.M., Gautel, M., Jones, G.E., and Cox, S. (2018). Artifact-free high-density localization microscopy analysis. Nat. Methods 15, 689-692.
Martin, A.C., Kaschube, M. , and Wieschaus, E.F. (2009). Pulsed contractions of an actin-myosin network drive apical constriction. Nature 457, 495-499.
Mary, H., Fouchard, J., Gay, G., Reyes, C., Gauthier, T., Gruget, C., Pécréaux, J., Tournier, S., and Gachet, Y. (2015). Fission yeast kinesin-8 controls chromosome congression independently of oscillations. J. Cell Sci. 128, 3720–3730.
Meddens, M.B., Pandzic, E., Slotman, J.A., Guillet, D., Joosten, B., Mennens, S., Paardekooper, L.M., Houtsmuller, A.B., van den Dries, K., Wiseman, P.W., et al. (2016). Actomyosin-dependent dynamic spatial patterns of cytoskeletal components drive mesoscale podosome organization. Nat. Commun. 7:13127. Mercer, J. (1909), "Functions of positive and negative type and their connection with the theory of integral equations", Philosophical Transactions of the Royal Society A, 209, 415–446.
Moreno, S., Klar, A., and Nurse, P. (1991). Molecular genetic analysis of fission yeast Schizosaccharomyces pombe. Methods Enzymol. 194, 795-823.
Mudry, E., Belkebir, K., Girard, J., Savatier, J., Le Moal, E., Nicoletti, C., Allain, M., and Sentenac, A. (2012). Structured illumination microscopy using unknown speckle patterns. Nat. Photonics 6, 312–315. Negash, A., Labouesse, S., Chaumet P., Belkebir K., Giovannini H., Idier, J. and Sentenac A. (2018) Two-photon speckle illumination for super-resolution microscopy. J. Opt. Soc. Am. A, 35, 1028-1033.
Nieuwenhuizen, R.P.J., Lidke, K.A., Bates, M., Puig, D.L., Grünwald, D., Stallinga, S., and Rieger, B. (2013). Measuring image resolution in optical nanoscopy. Nat. Methods 10, 557–562.
O’Shaughnessy, E.C., Stone, O.J., LaFosse, P.K., Azoitei, M.L., Tsygankov, D., Heddleston, J.M., Legant, W.R., Wittchen, E.S., Burridge, K., Elston, T.C., et al. (2019). Software for lattice light-sheet imaging of FRET biosensors, illustrated with a new Rap1 biosensor. J. Cell Biol. 218, 3153–3160.
Ovesný, M., Křížek, P., Borkovec, J., Švindrych, Z., and Hagen, G.M. (2014). ThunderSTORM: A comprehensive ImageJ plug-in for PALM and STORM data analysis and super-resolution imaging. Bioinformatics 30, 2389–2390.
drosophila melanogaster stage 9 egg chambers for live imaging. Nat. Protoc. 2, 2467–2473.
Rauzi, M., Lenne, P.F., and Lecuit, T. (2010). Planar polarized actomyosin contractile flows control epithelial junction remodeling. Nature 468, 1110-1114.
Richter, K. N., Revelo, N. H., Seitz, K.J., Helm, M. S., Sarkar, D., Saleeb, R. S., D’Este, E., Eberle, J., Wagner, E., Vogl, C., et al. (2018). Glyoxal as an alternative fixative to formaldehyde in immunostaining and super-resolution microscopy. EMBO J. 37, 139-159.
Rust, M.J., Bates, M., and Zhuang, X. (2006). Sub-diffraction-limit imaging by stochastic optical reconstruction microscopy (STORM). Nat. Methods 3, 793-795.
Shao, L., Kner, P., Rego, E.H., and Gustafsson, M.G.L. (2011). Super-resolution 3D microscopy of live whole cells using structured illumination. Nat. Methods 8, 1044–1048.
Shain, W.J., Vickers, N.A., Negash, A., Bifano, T., Sentenac, A., and Mertz, J. (2017). Dual fluorescence-absorption deconvolution applied to extended-depth-of-field microscopy. Opt. Lett. 42, 4183.
Sibarita, J. B., (2005). Deconvolution microscopy. Adv. Biochem. Engin./Biotechnol. 95, 201– 243 Sivaguru, M., Urban, M.A., Fried, G., Wesseln, C.J., Mander, L., Punyasena, S.W. (2018) Comparative performance of airyscan and structured illumination superresolution microscopy in the study of the surface texture and 3D shape of pollen. Microsc. Res. Tech. 81, 101– 114.
Taylor, M. A., Nöbauer, T., Pernia-Andrade, A., Schlumm, F., and Vaziri, A. (2018). Brain-wide 3D light-field imaging of neuronal activity with speckle-enhanced resolution. Optica 5, 345-353.
Van den Dries, K., Nahidiazar, L., Slotman, J.A., Meddens, M.B.M., Pandzic, E., Joosten, B., Ansems, M., Schouwstra, J., Meijer, A., Steen, R., et al. (2019). Modular actin nano-architecture enables podosome protrusion and mechanosensing. Nat. Commun. 10, 583492.
Van Goethem, E., Poincloux, R., Gauffre, F., Maridonneau-Parini, I., and Le Cabec, V. (2010). Matrix architecture dictates three-dimensional migration modes of human macrophages : differential involvement of proteases and podosomes-like structures. J. Immunol. 184, 1049-1061.
Ventalon, C., and Mertz, J. (2005). Quasi-confocal fluorescence sectionning with dynamic speckle illumination. Opt. Lett., 30, 3350-3352
Ventalon, C.,Heintzmann, R., and Mertz, J. (2007). Dynamic speckle illumination microscopy with wavelet prefiltering. Opt. Lett. 32, 1417-1419
Wicker, K., Mandula, O., Best, G., Fiolka, R., and Heintzmann, R. (2013). Phase optimisation for structured illumination microscopy. Opt. Express 21, 2032.
Zessin, P.J.M., Sporbert, A., and Heilemann, M. (2016). PCNA appears in two populations of slow and fast diffusion with a constant ratio throughout S-phase in replicating mammalian cells. Sci Rep 6, 18779. Zheng, W., Wu, Y., Winter, P., Fischer, R., Nogare, D.D., Hong, A., McCormick, C., Christensen, R., Dempsey, W.P., Arnold, D.B., et al. (2017). Adaptive optics improves multiphoton super-resolution imaging. Nat. Methods 14, 869–872.
implemented in a classical inverted microscope. Illuminated by multicolor lasers, the SLM sends five hundred different speckle patterns per second on the specimen. The fluorescence light is collected onto an sCMOS camera after appropriate filtering. The same set-up is operational for different objectives with numerical apertures between 0.15 and 1.49, and for wavelengths in the range of 450 nm to 600 nm.
(B) Stream of raw data obtained with high-density fluctuation microscopy (dSTORM) or RIM (speckle illumination). One dSTORM image required 30 ms integration time while one RIM image required 2 ms. The sample is fixed macrophages, stained for F-actin, that have been unroofed to leave only the podosomes at the surface of the coverslip, shown in (C).
(C) Super-resolved images of the macrophages F-actin network, obtained by processing 10,000 dSTORM raw images as in (B) using (Nanoj software SRRF; Gustafsson et al., 2016) or 800 raw RIM images using algoRIM, compared to a reference Scanning Electron Microscopy image. Note that RIM reconstruction is closer to the SEM image and does not suffer from the non-linear response to brightness of fluctuation microscopy.
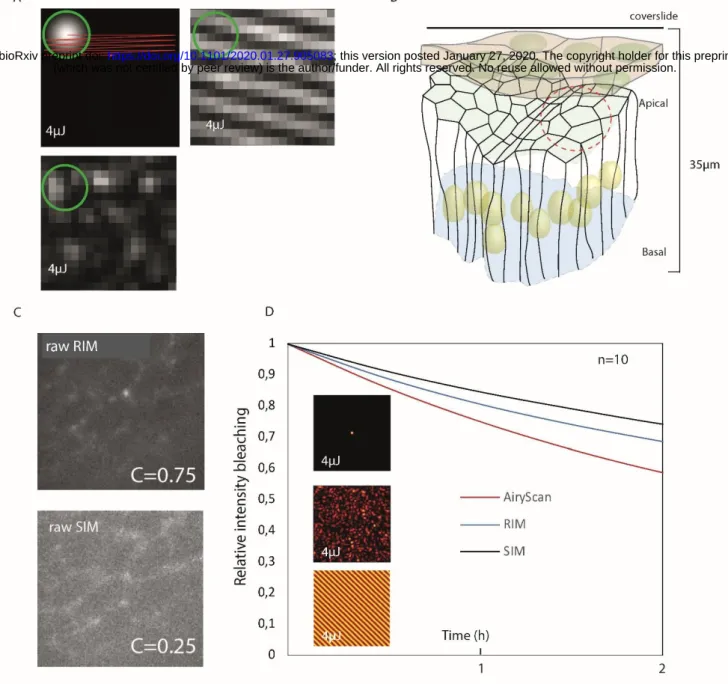
(D) Comparison between RIM and SIM imaging using the same experimental set-up. The RIM raw data are obtained by displaying 200 different random patterns on the SLM while the SIM data are obtained by displaying 30 different orientations and translations of a periodic pattern. Both experiments are performed with the same total number of photons injected into the sample (4 µJ per pixel). The sample corresponds to unroofed fixed macrophages, as in Figure 1C, with tagged vinculin surrounding the podosomes cores attached to the substrate. Right, comparison between RIM and SIM raw images. Left, RIM and SIM reconstructions. The dynamics and the resolution of the reconstructions are similar.
(E) Comparison between RIM and SIM resolution using the commercial ELYRA microscope for two-color imaging. The sample is a calibrated DNA nanoruler (SIM 140 YBY), where two red fluorophores (Alexa 561) attached at the DNA ends are separated by 140 nm, and are equidistant (70 nm) to a green fluorophore (Alexa 488). Both RIM and SIM estimated the red-to-green distance to about 70 nm as evidenced in the graphs displaying the green and red intensities with respect to the distance averaged over n=13 and n=17 nanorulers, respectively, using a co-location analysis. The total RIM imaging process took less than 10 min from the insertion of the sample in the microscope to the reconstruction. In contrast, the total SIM imaging process took about 2 h for completing the calibration, acquisition and checking steps (Ball et al, 2015 and Demmerle et al, 2017). In addition, while three parameters needed to be tuned for the RIM reconstruction scheme, seven were required for the SIM inversion method.
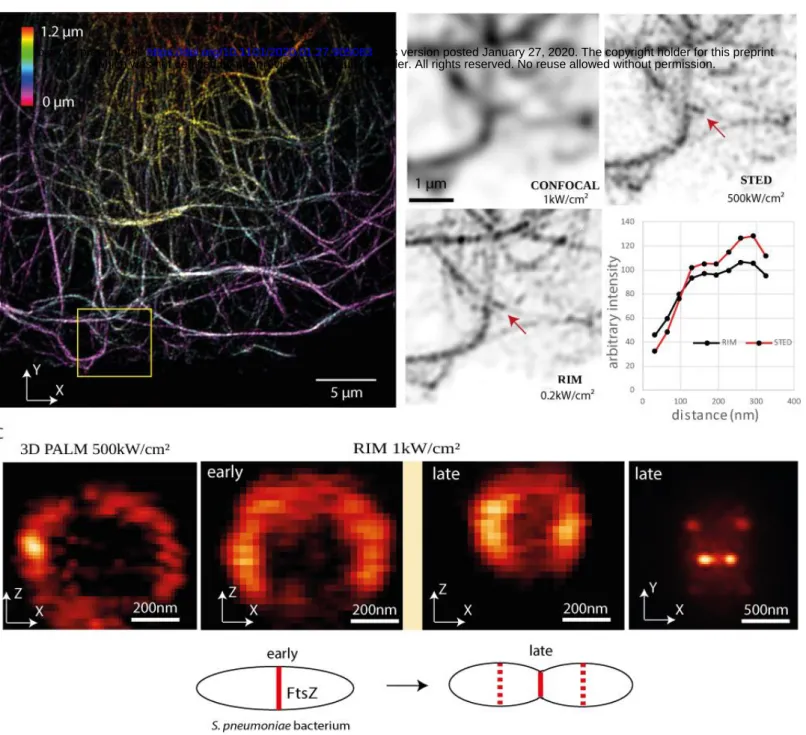
Figure 2: RIM allows high-fidelity super-resolved live imaging in the three dimensions.
(A) RIM 3D view of dense vimentin network from fixed HUVEC cell using a fluorescent antibody dedicated for STED microscopy with emission at 700 nm. The 3D image is made of 12 slices 100 nm apart. The color scale indicates the axial position (Fiji image processing). The yellow square locates the filaments enlarged in (B).
(B) The same vimentin filaments were observed by confocal microscopy (1 kW/cm²), STED microscopy (500 kW/cm²) or RIM at low photon budget (200 W/cm²). The curves depict the intensity recorded along the two dots shown by the arrow in RIM and STED images.
(C) Axial and transverse cuts of 3D RIM images of S. pneumoniae Z-rings containing FtsZ tagged with mEos3.2 taken at different stages of the cell division compared to 3D PALM equipped with adaptive optics. The 3D image is made of 20 slices, 64 nm apart. Early and late FtsZ annular constrictions from two dividing cells are shown (Z-ring diameters of 640 nm or 400 nm) in the axial cut. Right, transverse cut at the equatorial plane of the Z- rings of the two attached daughter cells (late division stage).