To link to this article : DOI:
10.1016/j.combustflame.2017.05.014
URL :
http://dx.doi.org/10.1016/j.combustflame.2017.05.014
This is an author-deposited version published in:
http://oatao.univ-toulouse.fr/
Eprints ID: 18402
O
pen
A
rchive
T
oulouse
A
rchive
O
uverte (
OATAO
)
OATAO is an open access repository that collects the work of Toulouse
researchers and makes it freely available over the web where possible.
To cite this version: Vermorel, Olivier and Quillatre, Pierre and Poinsot,
Thierry LES of explosions in venting chamber: A test case for premixed
turbulent combustion models. (2017) Combustion and Flame, vol. 183. pp.
207-223. ISSN 0010-2180
Any correspondence concerning this service should be sent to the repository administrator:
LES
of
explosions
in
venting
chamber:
A
test
case
for
premixed
turbulent
combustion
models
Olivier
Vermorel
a ,∗,
Pierre
Quillatre
a ,b ,1,
Thierry
Poinsot
ca CERFACS, CFD Team, 42 Avenue G. Coriolis, Toulouse Cedex 01 31057, France b TOTAL S.A., Tour Coupole, Paris La Défense Cedex 92078, France
c Institut de Mécanique des Fluides de Toulouse, CNRS, Avenue C. Soula, Toulouse 31400, France
Keywords:
Gas explosion Large Eddy Simulation Turbulent combustion model Efficiency function
a
b
s
t
r
a
c
t
Thispaperpresentsanew experimentalandLargeEddySimulation(LES) databasetostudyupscaling effectsinventedgasexplosions.Thepropagationofpremixedflamesinthreesetupsofincreasingsize isinvestigatedexperimentallyand numerically.The baselinemodelisthe well-knownlaboratory-scale combustionchamberfromSydney(Kentetal.,2005;Masrietal.,2012);twoexactreplicasatscales6 and 24.4wereset upbyGexCon (Bergen,Norway).The volumeratio ofthethree setupsvaries from 1tomorethan10,000,avariationunseeninpreviousexperiments,allowingtheexplorationofalarge rangeofReynoldsandDamköhlernumbers.LESofgaseousfullypremixedflameshavebeenperformed onthethreeconfigurations,underdifferentoperatingconditions,varyingthenumberofobstaclesinthe chamber,their positionand the typeoffuel(hydrogen, propaneand methane).Particular attention is paidtotheinfluenceoftheturbulentcombustionmodelontheresults(overpressure,flamefrontspeed) comparingtwodifferentalgebraicsub-gridscalemodels,theclosuresofColinetal.(2000)andCharlette etal. (2002),used inconjunction with athickenedflame approach. Meshdependency is checked by performingahighlyresolvedLESonthesmall-scalecase.
Foragivenscaleandwithafixedmodelconstant,LESresultsagreewithexperimentalresults,forall geometricarrangementoftheobstaclesandallfuels.However,whenswitchingfromsmall-scalecasesto medium-scaleorlarge-scalecasesthisconclusiondoesnothold,illustratingoneofthemaindeficiencies ofthesealgebraicmodels,namelytheneedforanapriorifittingofthemodelparameters.
Althoughthisdatabasewasinitiallydesignedforsafetystudies,itisalsoadifficulttestforturbulent combustionmodels.
1. Introduction
Duringtheexplosionofapremixedgascloud,thefirstissueis the pressure increase (the so-calledoverpressure) whichcontrols theseverityoftheexplosionanditsimpactonsurrounding struc-tures.This overpressurecan be devastating,causingfatalities and thedestructionoflargepartsofindustrialfacilities.These phenom-ena aredifficult to predict sincethey resultfroma complexand fully unsteadyinteraction betweenflame propagation, turbulence andgeometry.Theyoccuroveralargespectrumofspatio-temporal scalesandturbulentcombustionregimes.Researchinthisdomain startedinthe1970swiththeprimaryobjectivetodevelop know-how and tools for predicting and minimizing the effect of
acci-∗ Corresponding author.
E-mail address: [email protected] (O. Vermorel).
1 Present address: ENGIE Lab – CRIGEN, 361 Avenue du Président Wilson, 93210
Saint-Denis La Plaine, France.
dentalexplosions[1] .Thisgoalwasfirstreachedthanksto experi-mentalcampaignsandonlyrecentlyusingcomputationalsciences andresources.SafetyComputationalFluidDynamics(SCFD)isthus a relatively new field ofresearch. As formany applications deal-ingwithturbulenceandcombustion,e.g.gasturbineorpiston en-gine applications, the standard numerical approach was and still is the (Unsteady) Reynolds Averaged Navier–Stokes (U)RANS ap-proach, atleastwithinindustry.Thistechniquegradually replaces simple scaling laws, which were formerly used for interpolation andscalingofexperimentaldataandwereshowntobelargely in-applicable especially forexplosion venting, mainlybecauseofthe smallscaleoftheexperimentaldataonwhichtheyarebasedand becauseoftheir inadequatetreatmentofturbulencegeneratedby leaksandobstacles[1,2] .EvenifURANScodesareabletogive cor-rect predictions oftheobserved experimental trends,they gener-allycontainempiricalcoefficientswhichhavetobetunedinorder togive reasonableresults[3,4] .Theneedforbetterprediction ca-pabilities combined withthe growing computational powerhave
madeLargeEddySimulation(LES)analternativeandattractive so-lution.Indeed,LEShastheintrinsiccapabilitytogivemorereliable predictions than URANS methods, as shownby manyauthors in gasturbine[5–8] orpistonengineapplications[9–11] .
Thetypicalresearchconfigurationsusedtostudygasexplosions consistinvesselswithobstaclesfilledwithapremixedflammable mixture.Theflameisignitedandfirstpropagatesinalaminarway inaflow initiallyatrest.Thislaminarphaseisfollowedby a tur-bulentpropagationphaseduetotheinteractionofthefront with theobstaclesandtheturbulencegeneratedbehindtheobstaclesby theexpandinggases.Thisflame-inducedturbulenceincreases com-bustion intensity, leading to flames which can propagate at sev-eral hundreds ofm/swhilethey are oftheorder of0.5m/sina “normal” laminarflame.Intheworstscenario,theinitial deflagra-tion flame can transitionto detonation. This self-acceleration by obstacle-generated turbulence is responsible formany severe in-dustrialexplosions,forexampleonoffshoreplatforms[1,12–14] .
Even ifdetonation is not triggered, a LES SCFDcode must be abletohandledifferentcombustionregimes,fromlaminarto tur-bulent, and their transition. This situation is of course not re-stricted to explosion phenomena and is very common in many combustion systems usingignition devicessuch as internal com-bustion engines or aeronautic engines. Accurate predictions of flame propagation canbe achieved only withreliable models for turbulent combustion whichare theweakest element in simula-tion sub-models. Theturbulent combustionmodelsdeveloped for LES of reacting flows [15–20] all rely on modeling assumptions based on upscaling laws developed under Kolmogorov-type as-sumptions forturbulence scales [21–23] . Experimental databases arerequiredtoassesstheirstrengthsandweaknessesbutthey re-main rareanddelicatetobuild,evenforthesimplestflows.Most available experimental data for turbulent combustion correspond to flows taking place at atmospheric pressure in vessels of the order of a few liters: the volume of mostcar engines chambers vary from 0.1to 2 landgas turbines chambersare only slightly larger. When larger chambers are used (furnaces for example), measurements become difficult. In terms of models, this means thattherangeofDamköhlerandReynoldsnumbersexploredwith thesesystemsremainsnarrow[22,24,25] .Consequently,all turbu-lentcombustionmodelsaretestedoveralimitedrangeofscalesso that evenwrongmodelscan workwithoutrevealingtheir limita-tions becausenoexperimentaldataisavailabletochallengethem. EvenDNScannothelpbecausetherangeofspatio-temporalscales whicharereachedinDNSremainsnarrowanddoesnotallow up-scaling tests [22,26] . Furthermore, many experimental configura-tionsusedformodelvalidation,suchasturbulentbombsorsteady burners,sufferfromthesamelimitations:resultsdependstrongly on the turbulence, either present at ignition time (for turbulent bombs) orinjectedattheinlet(forsteadyburners).Finally,LESin largedomainsarequitedifficulttoperformwithoutmassive com-putingcapacities.
In order to help developingand validatingturbulent combus-tion models, a new experimental database (called SydGex inthe following) ispresentedinthispaper.Althoughoriginallydesigned forsafetystudies,itsusefulnessmaygowellbeyondthisinitial ap-plication.Thedatabaseconsistsinasetofthreeexperimentsof ex-actlysimilarshapesandincreasingsizescaledby1,6and24.4.The smallest experiment is the vented explosion chamber from Syd-neyUniversity[27,28] .Thisisasquarecrosssectionchamberfilled withvariousobstacles(1–3baffleplatesplusacentralsquarecross section obstacle).Comparedtootherlaboratory-scaleexperiments
[29–37] , thisconfiguration is characterized by a small volume of 0.625 l(whilethevolumeintheabovereferencestypicallyranges from2.98l[29] to56.3l[31] ),arelativelylowlengthtodiameter (or height)ratio of5 (ratios from2 [31] to 32[36] in theabove references)andanintermediateblockageratioof0.24forthe
baf-fleplatesand0.5forthecentral obstacle(ratios from0.2[32] to 0.8[32] intheabovereferences).Thisisalsooneofthefew exper-iments(with [32] ) whichprovides data forvarious fuels, namely propane,methaneandhydrogen.Thisconfigurationisparticularly wellsuitedforLESandmodelvalidation:
• Asmentionedbefore,thedimensionsofthecombustion cham-beraresmallandperfectlycompatiblewithLESandthecurrent computationalresources.
• Initialconditionsare perfectlydefined:theflow isatrest.For decades, the question of initial conditions has been a major limitationofourcapacitytoevaluatemodelsforturbulent pre-mixedflames.Iftheturbulenceinwhichtheflamedevelopsis not knownwithprecision,itisimpossibletovalidatea model because a simple tuning of the initial turbulent flow is suf-ficient to match the experimental flame speed. For example, most turbulent flames propagating in fan-stirredbombs have sufferedfromthislimitedprecisionintermsofinitialturbulent state[38–40] .
• Boundary conditionsarealsowell defined.Thethermal condi-tions on the walls are clear since walls do not have enough timetoheatupandtheirtemperatureremainsequaltothe ini-tialtemperature.
This configuration has already been extensively studied with LES.Gubbaandco-workersobtainedveryconvincingresultsfora propane–airmixture[41–44] .Awiderangeofconfigurationswere computedtoexplorevariousaspectssuchastheeffectsoflocation andnumberofthe solid obstaclesaswell asarea blockage ratio. Inthesestudiesanalgebraicflamesurfacedensitymodelwas con-sideredinordertoaccountfortheunresolvedpartofthesub-grid scalereaction rate,eitherwitha constant-basedformulationora dynamicone.ItwasfoundthattheLESpredictionsareslightly im-provedby theuseofthedynamic procedure[42,44] .In [45] ,this workwasextendedtoalean hydrogen–airmixture.Accurate pre-dictionsoftheflameshapeandpeakoverpressurewere again ob-tainedfordifferentnumbersandlocationsofobstacles.
Thetwo otherexperiments (performedbyGexCon inNorway) arescaled-upversions oftheSydneytest rig atscale6and24.4. With a volume of 135 and 9 079 l respectively, these two new configurationslargely exceedthe size ofclassical laboratory-scale experiments discussed above. The corresponding volume ratio of thecombustionchamber thenvariesfrom1(fortheSydneycase) to216forthemedium-scalecaseandto14,526forthelarge-scale case,a rangewhichhasnever beenreachedbeforeinany turbu-lentcombustionexperiment.Sincethegeometryandtheoperating conditionsofthe threesetupsare thesame,the onlyparameters changingfromonecasetoanotherarethevaluesofthe Damköh-lerandReynoldsnumbers.Thisdatabasethusconstitutesaunique setofresultstoaddresstheoverarchingproblemofturbulent com-bustion:howtowriteagoodturbulentcombustionmodeland val-idateitovera widerangeofscales?Here,theconditionsreached in the SydGex database in a classical turbulent combustion dia-gram (Fig. 1 ) cover a much wider range than what is observed inall canonical bombsorengines:u′
/S0
l can reach20,lt/
δ
0 l isof theorderof1500and,evenifdetonationisnevertriggered,flame fronts canpropagate atvelocities closeto 400m/s (thesefigures areextractedfromthesimulationsdescribedthereafter).The methodused heretoanalyze the performance ofthe LES turbulentcombustionmodelsdiffersfromwhatisdoneusuallyfor steadyburnersforexample,whereone ortworegimesaretested extensively using full fields of velocity, species and temperature
[7,15,46] . Forventing chambers, the main qualitative indicator of themodel quality isthe flame positionvisualization (which pro-vides a flame speed)and the quantitative data to capture is the pressurecurveversustimewhichiscontrolledbytwophenomena: theoverallcombustionrateandthemassflowrateattheventing
Fig. 1. Classical turbulent combustion diagram for premixed turbulent flames [22,23] as a function of the length ratio (turbulence integral scale l t /flame thickness
δ0
l ) and velocity ratio (rms (root mean square) velocity u
′ /flame speed S 0
l ). The ap-
proximate locations of the SydGex database are indicated by the three oval curves: Sydney’s small-scale experiment (SS), GexCon’s medium-scale experiment (MS) and GexCon’s large-scale experiment (LS).
chamber exit.The pressurecurve isverysensitive tothereaction ratewhichisthequantitywewanttoinvestigate. Nocomparison withvelocity,temperatureorspeciesfieldwillbeperformedhere butthisiscompensatedbythefactthatthecomparisonisnot per-formedforoneortworegimesbutformorethan 10caseswhere the overall size ofthe setup, thefuel type and theconfiguration (numberandlocationofobstacles)willbechangedsystematically. The SydGex database is presented in Section 2 . The setup of the small-scale Sydney experimentis briefly recalled before pre-senting the two replicasat medium- (Sydney’s experiment × 6) and large-scale (Sydney’s experiment × 24.4). The LES code and sub-grid models are describedin Section 3 . LES of different op-erating conditionswere performed,varying thenumberof obsta-cles, their position and the type of fuel (hydrogen, propaneand methane). Sections 4 (small-scale simulations) and 5 (medium-scaleandlarge-scalesimulations)focusontheinfluenceofthe tur-bulent combustionmodel comparingtwo different sub-grid scale models, namely the algebraic closures of Colin et al. [47] and Charletteetal.[48] ,usedinconjunctionwiththeThickenedFlame (TF)approach[47] .ThisexerciceissimilartothatdonebyDiSarli etal.[49] orWenetal.[50] ,exceptthattheircomparisonof vari-oussub-gridscalecombustionmodelsreliedononlyone configu-ration,whereasmanydifferentconfigurationsofvaryinggeometry andsizeare usedhereto provideamorechallengingassessment ofturbulentcombustionmodels.
2. Experimentalsetup
The SydGex database contains three experimental setups: the Sydney experiment called ‘original’ or ‘small-scale’ (SS) (0.25 m long) configuration and its two upscaled versions, the ‘medium-scale’(MS)(1.5mlong)and‘large-scale’(LS)(6.1mlong) configu-rationsofGexCon.
2.1. Small-scaleexperiment
The original Sydney experiment [27,28] is sketched in Fig. 2 . Thissemi-confinedconfigurationconsistsinasquarecrosssection (0.05 × 0.05 m2), 0.25 m long chamber with solid obstacles. Its volume is0.625 l.Three removablebaffleplatescanbe placedat variousdistancesfromtheignitionsource(overallblockageratioof 0.4)whilethecentralsquareobstacle(1.2cmsquare,blockage
ra-Fig. 2. Explosion chamber configuration of Sydney [27,28] . The vessel is orientated vertically in the experiment: the bottom end of the vessel is on the left of the figure and the top end on the right.
Table 1
Configurations studied for the small-scale (SS) experi- ment of Sydney [28] .
Fuel Configuration
BBBS OBBS OOBS BOOS
LPG X X X X
CNG X H 2 X
tioof0.24)isfixed[28] .Thebottomendofthechamberisclosed andthetopendisopenedouttotheatmosphere.Thevesselis ini-tiallyfilledwithapremixedmixtureoffuelandairatatmospheric pressure andtemperature. Themixtureisthenignitedbylaser at the closedend. Experimental resultsincludepressuresignals and flame front visualizations forthreedifferentfuels, namely hydro-gen (equivalence ratio
8
=0.7), LPG (95%C3H8, 4% C4H10 and1% C5+ hydrocarbonsby volume)(8
=1.0),andCNG (88.8%CH4,7.8% C2H4,1.9%CO2 and1.2%N2withtheremaining0.3%beinga mix-tureofpropane,propene,butaneandpentane)(8
=1.0)[28] .The arrangement of thebaffle plates control theflame speed, theflamefrontshapeandthegeneratedoverpressure.The nomen-clature of[28] is usedhereto namethe differentconfigurations: for example, a configuration named BBOS refers to baffle plates (B) at the first two locations (i.e., close to the ignition point) and a small central obstacle (S) while configuration OOBS refers to a unique baffleplate locatedclose to thecentral obstacle. For each configuration,theexperimentwasrepeatedatleast30times to obtain reliable results.The configurations computed by LESin
Section 4 are summarizedinTable 1 :they allowto studythe in-fluenceofthenumberofgrids(OOBSversusOBBSandBBBS),the influenceofthepositionofthegrids(BOOSversusOOBS)andthe influenceofthefuel(LPGversusPNGandH2).
2.2. Medium-andlarge-scaleexperiment
Themedium-andlarge-scaleexperimentshavebeensetupby GexCon in 2012. Almost all the available measurements and di-agnostics are shownin thispaper, a few additionalresults being availablein[51] .Rawdataareavailableuponrequest.
Themedium-scaleexperimentisareplicaofthesmall-scale ex-periment of Sydneyat scale 6.The combustion chamber is a 1.5 × 0.3× 0.3m3 volume (135l) witha vent opening.Contraryto the Sydney experiment where the vessel was oriented vertically, thevesselwaspositionedhorizontallyonatableduetothehigher intensity of the explosion. The three aluminum grids were posi-tioned vertically inside the vessel. All dimensions of the MS rig
Fig. 3. Top view of the medium-scale (MS) test vessel. Measurements are given in mm. The dots indicate the positions of the four pressure transducers (P1–P4).
Fig. 4. Top view of the large-scale (LS) test vessel. Measurements are given in mm. The dots indicate the positions of the four pressure transducers (P1–P4).
Table 2
Mixture composition and ignition system used in the MS and LS configurations.
MS LS
Composition - Class 2.5 propane - Industrial propane (99.5% purity), 8= 1 (95% purity), 8= 1 - Class 2.5 methane
(99.5% purity), 8= 1
Ignition system Spark generator (car coil) Oscillating spark Electrodes location 15 mm from the wall 50 mm from the wall Interelectrode distance 4 mm 4 mm
(Fig. 3 )correspondtothedimensionsoftheSSexperimentatscale 6(withinamarginof4%duetothemanufacturingprocess).
Thelarge-scaleexperimentatGexCon(Fig. 4 )isareplicaofthe Sydneysmall-scaleexperimentatscale24.4,leadingtoa6.1×1.22 × 1.22m3 (9 079 l)vessel. The vessel ispositioned horizontally, directlyontheground.Theremovablegridsaremadeoutofsteel. The explosion experiments were performedwith stoichiomet-ricmixturesofmethaneandpropaneinair.FortheMStests,class 2.5 methane andpropanewere used whereas industrial propane was used for the LS tests. In order to contain the gas mixture withinthevesselduringmixingandfilling,theopenendwas cov-eredwitha thinplasticsheet.DuringtheMSteststheplasticfoil was clamped over the vent opening andwas not removed prior to ignition. FortheLS tests, theplastic foilwas held in placeby a pneumaticsystemandreleasedjustbeforeignition.Two differ-ent ignition sources were used. For the MS tests, a singlespark generatorbasedonacarcoilwasused.Inthiscase,thespark ac-tivates immediatelyafter itis triggered.For theLStests, ignition is performedwithanoscillatingspark,which ignitesthemixture 5–25msafteritistriggered.AdditionaldetailsaregiveninTable 2 .
Theoverpressurewasmeasuredusing4piezo-electricpressure transducers from Kistler (type 7261 for the LS experiment and
Fig. 5. Experimental overpressure–time traces for the three shots performed on the MS test rig for the BBBS configuration (C 3 H 8 , 8= 1).
701A forthe MS experiment) connected to Kistler charge ampli-fiers(type5073fortheLSexperimentand5011AfortheMS exper-iment).The7261and701Atransducershaveafrequencyresponse of13 kHz and70kHz, respectively.The position of the pressure transducers P1–P4 is given in Figs. 3 and4 . In practice the four pressuresignalsarealways verysimilar:sinceP1isclosest tothe position ofthe pressure transducer used in theSS configuration, onlythepressuresignalextractedatthispositionwillbeshownin thefollowingsections.
TheMS testswere recordedusingaPhantomv210high-speed camera at 2000 fps withfull resolution of1280 × 800 in color. FortheMScase, afastLEDlight-box unitwas litinparallelwith theignitionsourcetomeasureflamepropagationspeedsfromthe high-speedvideorecordings.FortheLSexperiment,video record-ingwas impossibleandthepressure-time tracesarethe only ex-perimentalmaterialavailableforLESvalidation.
Duetotheirsize,theMSandLSexperimentsaremoredelicate to setupand muchmore costly than theSS experiment. Forthis reason, the number of configurations studied was reduced com-paredtotheoriginaldatabaseofMasrietal.Thenumberofshots foreach configurationwas also reduced:instead of30 (ormore) shotsforeachconfigurationoftheSSexperiment, only2–6shots wereperformedhere:allshotsshowedaquite goodrepeatability withlowcyclicvariations (see [51] formoredetails).As an illus-tration, Fig. 5 showsthe overpressure–time traces of three shots performed on the MS test rig for the BBBS configuration (C3H8,
8
=1). The peak pressure (810, 824 and 873 mbar), its rate of change(maximum values of 240, 286and 294bar s−1), and the time takento reach the peak (59.5, 60.1 and 59.3 ms) are very similarfromoneshottoanother.Similarresultswereobtainedfor allconfigurationsforthepeak pressureanditsrateofchangebut larger variations were observed forthe time to reach peak pres-sure,probablyduetovariationsintheignitionsystem. Toremove anydoubtabouttheresults,thisquantitywasnotusedforLES val-idation.Allpressure–time tracesplottedinthefollowing sections willthus be shiftedintime by aquantity1
tpeak=tLESpeak−texp peak in order to match the experimental peak pressure instant texppeak (in practiceallLESpeakpressureinstantstLES
peakarelargerthanthe ex-perimentalpeak pressureinstantstexppeak). Notethat the uncertain-tiesmentioned hereare much smaller than thevariations which areinvestigated: forexample,the meanpeak pressureforthe SS BBBSconfigurationisabout110mbar,itreaches800mbarforthe MSBBBSand1600mbarfortheLSBBBSconfigurations.
ThetestmatricesavailableforLESvalidationontheMSandLS experimentsareshowninTables 3 and4 .
Table 3
Configurations studied for the medium-scale (MS) ex- periment of Gexcon.
Fuel Configuration
BBBS OBBS OOBS BOOS
LPG X X X
CNG X H 2
Table 4
Configurations studied for the large-scale (LS) experi- ment of Gexcon.
Fuel Configuration
BBBS OBBS OOBS BOOS
LPG X X
CNG X H 2
3. Numericalsetup
ThesolverusedforallLESisAVBP[7,52–54] .Allcomputations havebeenperformedwiththesamenumericalsetup.The compu-tationsonlydifferbythescale(SS,MSorLS)andthefuel(andits corresponding chemical scheme). AVBP solves the unsteady com-pressible and reactive multi-species Navier–Stokes equations on unstructured grids.It is a cell-vertex/finiteelement code,explicit in time.Simulations are performedwiththe TTGCfinite element Taylor–Galerkin convective scheme [55] , which is 3rd order in spaceandtime andhasa low dissipativeerror. Thediffusion op-erator (2
1
stencil) relies on a vertex centered formulation com-bined with a finite element discretization. Thisoperator predicts correctdissipationlevelsatthesmallestresolvedscalesand damp-enshighwavenumberoscillations[56] .Anexplicittime-integration isusedforthespecieschemicalsourcetermswithafinite-element basedspatialdiscretization[56] .Gravityisnotaccountedforinthe LESsinceitscontributioninthemomentumandenergyequations is much lower than the contributions of thedifferent fluxesand sourceterms.Thedifferentmodelsusedinallcomputationsarelistedbelow: • Sub-grid scale turbulence is modeled by the WALE viscosity
basedmodel[57] .
• Chemistryis modeled by reduced schemes [58] which match the laminar flame speed, the flame thickness and the burnt gasesadiabatictemperature.CNG andLPG havebeenreplaced bytheirmainrespectivecomponentinthecomputations:CNG wasreplaced byCH4 (88.8%ofCNGvolume)andLPGbyC3H8 (95%ofLPGvolume).Giventheexperimentaluncertainties rela-tivetothemixture(actualcompositionofLPGandCNG, equiv-alenceratio,supposedlyperfectlypremixedmixture)and,more basically, giventhe classical uncertainties found in the litera-tureregardinglaminarflamespeeds(even forthesimplest fu-els such as CH4 or C3H8, discrepancies of 5% to 10% are of-tenobserved), thissimplification seems reasonable.Three dif-ferent reduced chemical schemes have thus been used: two two-step reducedschemes forCH4–air andC3H8–air combus-tion(oxydationandCO–CO2 equilibrium)andoneone-step re-ducedscheme(oxidationonly)forH2–aircombustion[51] . • Ignition is a complex phenomenon (plasma formation, shock
waves,radiativeeffects,...)andits modelingisa taskthat ex-tendsfarbeyondthescopeofthisstudy.Here,calculationsare initializedby asmallhemisphereofburntgases(radius1cm) at the ignition point. This model is acceptable here since it mainlyimpactsthetimetoreachthepeakpressure(aquantity whichwearenotinterestedin,seeSection 2 )andnotthe
mag-nitudeofthepeakpressureitself[45] .Furthermoreitmatches welltherealconditionsofignition:sincetheflowisatrest ini-tially,assuming that theflamewill still belaminarand hemi-sphericalwhenitreachesa1cmradiusisreasonable.
• Thecombustionmodelassociates theThickenedFlame forLES (TFLES)approach[19,47,59,60] toresolvetheflamefrontonthe computational mesh andan efficiencyfunction to account for thelossofwrinklingatthesub-gridscaleduetoflame thicken-ing.Whilevariousothermodelshavebeenusedforexplosions
[43,49,50,61,62] ,wefocus onmethodswhichexplicitlyresolve theinnerflameletstructureinordertocapturecurvature,strain and non adiabaticity effects. The thickening factor F is com-putedinadynamicway:itismaximuminflamezonesand de-creasestounityinnon-reactivezones,usingaflamesensor de-pendingonthelocaltemperatureandmassfractions[59] .Two differentefficiencyfunctionshavebeentested,namelythe for-mulation of Colin et al.[47] and that of Charlette etal. [48] . The efficiency function is defined as the wrinkling
4
1 ratio betweenthenon-thickenedreferenceflameandthethickened flame: E=4
1(
δ
0 l)
4
1(
Fδ
0l)
(1) whereδ
0l is the laminar flame thickness(calculated fromthe temperature gradient) of the non-thickened flame and F is the thickening factor.
δ
0l is considered as constant duringthe wholecomputation,neglectingtheeffectoftheoverpressure.It is equalto 0.34mm forC3H8–aircases,0.41 mm forCH4–air casesand0.12mmforH2–aircases.
In the formulation of Colin et al., the wrinkling factor
4
1 is definedas:4
1=1+β
Colin 2ln(
2)
3cms£
Ret1/2−1¤
Ŵ
Colinµ
1
δ
0 l ,u ′ 1 S0 l
u′ 1 S0 l (2)where
Ŵ
Colin isa function describing theability ofvortices to effectively wrinkle the flame front. S0l is the laminar flame speed (equal to 38.4 cms−1 forC
3H8–air cases, 36.3cm s−1 forCH4–aircasesand128.0cms−1 forH2–aircases),
1
isthe filtersize, u′1 isthe sub-grid scale turbulentvelocity, Ret isa Reynoldsnumberbasedonu′
1andonanestimationofthe tur-bulentintegral length scale lt,andcms=0.28.For thepresent computations, lt is estimated to be equal to the spacing be-tween two bars ofa baffleplate(i.e. 5 mm at SS, 30 mm at MSand122mmatLS).
β
Colinisamodelparameterusuallyset to0.3[46,63,64,65,66] .In theformulationofCharlette etal., thewrinklingfactor has anexponentexpression:
4
1=µ
1+min·
1
δ
0 l ,Ŵ
Charletteµ
1
δ
0 l ,u ′ 1 S0 l ,Re1¶¸
βCharlette (3)where
Ŵ
Charlette plays a role equivalent toŴ
Colin and Re1 is the sub-grid scale turbulence Reynolds number. As for the Colin et al.expression, a modelparameterβ
Charlette hasto be specified. Followingthe original paperofCharlette et al.[48] ,β
Charletteissetto0.5.These algebraic closures for the flame wrinkling potentially havetwodrawbacksforthesimulationsofexplosions:
− a conceptual drawback, since they assume an equilibrium between turbulence motions and flame wrinkling, an hy-pothesiswhich is not justifiedduring thewhole explosion scenario,asthe flame islaminarat early stages,wrinkling upslowlybeforereachingafullyturbulentregime.
− apracticaldrawback,linkedtothepreviouspoint,sincethe outcomeofthesemodelshighlydependsonthevalueofthe modelparameters
β
Colinorβ
Charlette.Fig. 6. Longitudinal cuts of the mesh passing through the middle of the combustion chamber for configuration BBBS SS. (a) Combustion chamber. (b) Zoom around the third baffle plate and the central obstacle. (c) Global view of the computational domain including the plenum which mimics the atmosphere. All dimensions are in mm.
The computational domain includes the ventingchamber and aplenum,locatedatitsoutlet,whichmimicstheatmosphere.For all configurations,meshes are madeof tetrahedral elements. The number of elements is constant for all LES configurations at all scales, around20million. Figure 6 showsatypical meshfor con-figurationBBBSSS.Inthefirsttwothirdsofthecombustion cham-ber (x < 160 mm), the mesh resolution
1x
(calculated fromthe nodal volume)is about0.5, 3 and 12.2 mm respectively forthe SS, MS andLS experiments. This mesh density has been chosen inordertoensurethattheflame,eventhickened,remainsthinner than thedistancebetweenthebarsofabaffleplate.Asan exam-ple,forC3H8–airLES,theresultingmaximumthickeningfactorsF are of theorder of7.3at SS, 44at MS and179atLS (the flame is resolved on 5 grid points). The mesh is progressively coars-enedinthelastthirdofthechamber,wellafterthecentral obsta-cle. Theresolutionattheexitofthecombustionchamber reaches 1.5, 9 and 37 mm respectively for the SS, MS and LS configura-tions.Thewholedomainisinitializedatrest.Theventingchamber is initialized witha perfectlypremixed mixture(8
=1.0forcases with CH4–air or C3H8–air mixtures,8
=0.7 for H2–air mixtures) at atmospheric pressure and temperature. The plenum is filled withaironly.Thewallsoftheventingchamber andtheobstacles aremodeledasnon-slipwalls.Navier–StokesCharacteristic Bound-ary Conditions (NSCBC) [67,68] are used on the borders of the plenum.AllLESwere performedon4096processorsoftheBlueGene/Q machine Turing from GENCI-IDRIS. For SS configurations, about 15msofphysicaltimearesimulated,80msforMSconfigurations and400msforLSconfigurations.Ifthephysicaltime tosimulate increaseswiththesizeoftheconfiguration,thisisalsothecasefor thetimestepwhichisherecontrolledbyconvection(theacoustic CFLnumberis0.7atallscales):itincreasesfromabout0.05
µ
satSSto0.3
µ
satMS and1.4µ
satLS. Asaconsequence,sincethecomputationalgridsarecomparable(20millioncells),the compu-tation cost for one LES is almost constant for all configurations, SS, MS or LS: about 100,000 core-hours for an elapsed time of 24h.
ToverifymeshindependencyfortheSScase,anadditionalLES calledVRLES(VeryRefinedLES)wasperformedon131,072 proces-sors of the BlueGene/Q machine Mira from ALCF (INCITE award) usingafinermeshof973millioncells(Section 4.3 ).
4. LESofthesmall-scaleexperiment
Notethatsomeofthesmall-scaleLESpresentedhereafterhave been already mentioned in[69] .However, for the sake ofclarity andexhaustiveness,thefullsetofsmall-scaleresultsispresented here.
4.1. Basecase:BBBSconfiguration,C3H8
Figure 7 showsLESimagesofflamepropagationcomparedwith experimentsintheSScase[28] .OnlytheLESperformedwiththe efficiencyfunctionofColinetal.isshownherebuttheresultsare qualitativelysimilarwiththeefficiencyfunctionofCharletteetal. Intheearly stageofpropagation, theflame islaminarand hemi-spherical.Att−
1
tpeak=6 ms,it hitsthefirstbaffleplatepassing first through thetwo central passages and then through the lat-eralpassages.Thefourfinger-shapedflamesmergetogetherbefore reaching thesecond baffleplate(t−1
tpeak=8ms).At that point, theflameisstillalmostlaminarsincetheturbulencegeneratedin thewakeofthefirstobstacleisverylow.Whentouchingthe sec-ondbaffleplate,theflamestartsaccelerating(t−1
tpeak=9.6ms). Fourfingersareformedagainbutthistime,theybegintobe wrin-kled by the higher turbulence level encountered behind the ob-stacle(t−1
tpeak=10ms).Betweenthesecondandthirdobstacles, duetothehigherflamefrontspeed,thereisnotenough timefor thedifferentfingerstomergeagain.Theyfinallyhitthethirdbaffle plateandthe centralobstacle(t−1
tpeak=10.8ms),while contin-uing to accelerate. All these phases are well reproduced by LES. The evolution of the speed of the leading point of the flame as a function of its position is shown in Fig. 8 (left). Indications of the corresponding physical time t−1
tpeak are also provided to comparewithoverpressure–timetracesshownafterwards(Fig. 12 ). Thisspeed is controlled by dilatation andby the turbulent com-bustion model.TheLES performedwiththe modelofColin etal. reproduces perfectly the differentphases ofpropagation andthe successiveflame accelerations (especiallyaround the second baf-fleplate)anddecelerations(mainlybetweenthesecondandthird baffleplates).Somediscrepanciesareobserveddownstreamofthe centralobstaclebutthismaybepartlyduetothelimited resolu-tion ofhigh-speed images.In thisarea andconsidering the high flamespeed,thepositionoftheflame frontcanonlybe reported every 2 cm,which is not enough to obtain an accurate estimate ofitsspeed.Atthepeakpressureinstantt−1
tpeak=11.44ms,the leading pointoftheflamefront isalreadyfardownstream ofthe centralobstacle butthe mainpart ofthereaction rateisstill lo-catedaroundtheobstacle.WiththemodelofCharletteetal.,theLESmatchesthe exper-imentsup to thesecond baffleplate. From thethird baffleplate, it starts overestimating the flame front speed. This may be di-rectly attributedtothe modeling ofthe sub-grid scalewrinkling, as confirmed by Fig. 8 (right) which compares the reaction rates (total
ω
˙tot, resolvedω
˙res and consequently sub-grid scale ˙ω
sgs=˙
ω
tot−ω
˙res)obtainedwiththeColinetal.andCharletteetal. mod-els.Thetotalreactionratesofbothmodelsfollowexactlythesame trendsasfortheflamefrontspeed:equalup tothesecondbaffle plateandverydifferentfromthe thirdbaffleplate. Forboth LES,Fig. 7. Flame propagation in the configuration BBBS SS (C 3 H 8 , 8= 1). Left : time sequence of LIF-OH images [28] . Right : time sequence extracted from the LES (visualization of the reaction rate). The corresponding physical times t −1tpeak are given at the top of each image.
Fig. 8. LES of the configuration BBBS SS (C 3 H 8 , 8= 1) with the models of Colin et al. and Charlette et al. Left : evolution of the flame front speed as a function of the flame front position. Black arrows shows the corresponding physical time t −1tpeak (note that 1tpeak is different for each LES as explained in Section 2.2 ). Right : total ( ˙ ωtot ) and
resolved ( ˙ ωres ) reaction rates.
Fig. 9. Field of efficiency function ( Eq. (1) ) with the Colin et al. (bottom) and Charlette et al. (top) models and isoline of temperature T = 1500 K (black line) when the flame interacts with the central obstacle (same location of the flame front). Configuration BBBS SS (C 3 H 8 , 8= 1).
theresolved reactionratesarealmostthesameduringthewhole computation, revealinga lowimpactofthesub-grid scale model-ing on theresolved scales. However, the sub-grid scale modeling itself strongly affects the results,especially from the third baffle plate.Whentheflameinteractswiththecentralobstacle,the sub-grid scale reaction ratecontributes between30% and50% to the total reaction rateandup to70% downstream of thecentral ob-stacle. This highlights the great importance of thesub-grid-scale combustionmodelforthesesimulations,asshownbyDiSarlietal.
[70,71] .
Figure 9 displays a field ofefficiency function E (Eq. (1) ) ob-tained with the two models for the same location of the flame front,whentheflameinteractswiththecentralobstacle.Atthese location andtime, turbulencelevels are high andthe rangeof E values observed are representative of the maximum values ob-tainedintheLES.Whateverthemodelused,theefficiencyfunction activates in thesame locations, mainly aroundthe central obsta-cle, aroundandinthewakeofthesecondandthirdbaffleplates. Butthelevelsofefficiencyfactorsmaybelocallyverydifferent:if they are relatively similar around the central obstacle, thisis no
Fig. 10. Scatter plot of the efficiency function E as a function of the sub-grid scale turbulent velocity u ′
1for the models of Colin et al. ( left ) and Charlette et al. ( right ). The
analytical functions ( Eqs. (2) and (3) ) are also plotted using a constant 1= 0 . 5 mm. Data are extracted from the snapshots displayed in Fig. 9 . Configuration BBBS SS (C 3 H 8 ,
8= 1).
Fig. 11. Probability density function of the efficiency function E for the models of Colin et al. and Charlette et al. Data are extracted from the snapshots displayed in Fig. 9 . Configuration BBBS SS (C 3 H 8 , 8= 1).
longerthecaseupstreamofit,wherethemodelofCharletteetal. predicts muchhigherlevels.Thisisconfirmedby Figs. 10 and11 , whichshowthescatterplotoftheefficiencyfunctionasafunction ofthesub-gridscaleturbulentvelocityu′
1andtheprobability den-sityfunctionofE,respectively.Theanalyticalfunctions(usingEqs. (2) and(3) )arealsosuperimposedtothescatterplots.Themodel of Colin etal. exhibitsa large rangeof efficiency, uniformly dis-tributedovertheturbulenceintensitywhilethemodelofCharlette etal.exhibitsastrongpeakaround 3duetothe“bendingeffect” incorporatedinitsformulationathighu′
1/S0l [48] .Thescatterplot dispersion around the analytical expressions (Eqs. (2) and(3) ) is due to thenon-exactly uniform mesh size.Overall, the model of Charlette et al.generates higher valuesof the efficiencyfunction except for very highturbulence levels (u′
1>12.5 ms−1). Conse-quently, it also predicts higher reaction rates and flame speeds than the model ofColin etal., from thebeginning of the turbu-lent propagation phase (i.e. betweenthe second andthird baffle plates).
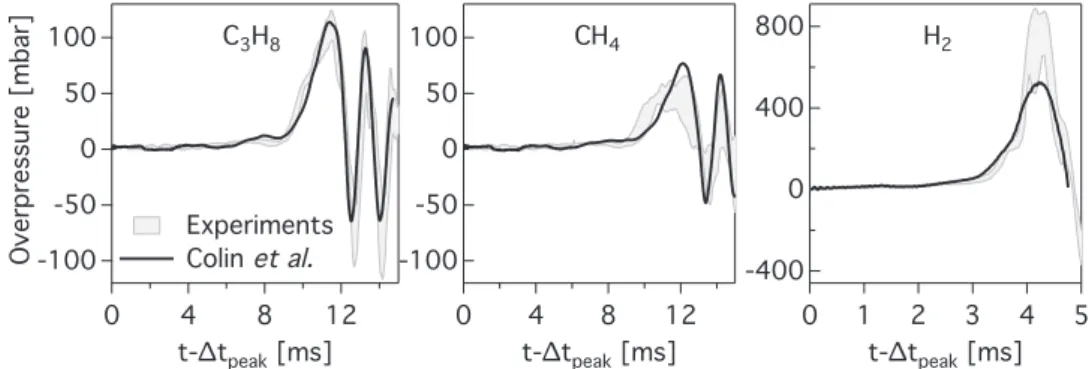
The resulting overpressure–time traces(measured in thebase plate) are plottedinFig. 12 .For theexperimental data,the trace represents the envelope of the different realizations. The model of Charlette etal.predicts higher levelsof overpressure thanthe model of Colin et al. and overestimates the experimental peak value (173 mbar instead of 113 mbar). With the model of Colin etal.,therateofpressurerise,thepeakpressureandthepostpeak phase are correctly described. The pressure oscillations observed after12ms atafrequencyofabout650Hzcorrespondtothe ex-citationofthefirstlongitudinalacousticmodeoftheduct (consid-eringanonzeroimpedanceatitsexit)andareperfectlycaptured byLES[51] .
Fig. 12. Pressure–time traces for configuration BBBS SS (C 3 H 8 , 8= 1). Comparison between experiments (envelope) and LES performed with the models of Colin et al. and Charlette et al.
ThisshowsthatthemodelofColin etal.iswellsuitedfor de-scribing the whole explosion transient. Even the laminar to tur-bulenttransitionphase iscorrectlycaptureddespite the underly-ing equilibrium assumption on which it is based. However, this result is highly dependent on the value of the model constant
β
Colin. Figure 13 (left) shows the overpressure for three different values ofβ
Colin (0.1, 0.3 (standard value) and 1.0). Higherβ
Colin values lead to faster flame propagation and higher overpressure. Forβ
Colin=1.0, the maximum overpressure is about 185 mbar whileit is about113 mbar forβ
Colin=0.3 andonly 67mbar forβ
Colin=0.1.ThesameconclusionholdsforthemodelofCharlette etal.(Fig. 13 (right)):ifaconstantβ
Charlette=0.4isusedinsteadof theoriginalvalue0.5,thepredictionoftheoverpressureisgreatly improved andmatches almost perfectly the resultobtained with the model ofColin et al.withβ
Colin=0.3. This showsthat both modelsareabletoreproducetheexperimentalbehavior,although their formulationsare sensiblydifferent.Butthisalsoshowsthat the choice of the constant for this kind of algebraic closure re-mainsamajorchallenge.Therecentdevelopmentofdynamic mod-els[20,72] ,theoreticallyabletoautomaticallyadjustthemodel pa-rametersduringthe simulation,could bea promisingway-outto solvethisissueinthefuture.For the following parametric variations, only the results ob-tainedwiththemodelofColinetal.willbeshownanddiscussed.
4.2.Parametricvariations
Theeffectofdifferentparametricvariationsarenowstudied: • effectofthenumberofobstacles;
Fig. 13. Pressure–time traces for configuration BBBS SS (C 3 H 8 , 8= 1). Comparison between LES performed with the models of Colin et al. ( left ) and Charlette et al. ( right ) for different values of the model constant ( βColin = 0.1, 0.3 or 1.0; βCharlette = 0.3, 0.4 or 0.5). To illustrate the differences in propagation speed, LES traces are not shifted in time
individually but by a same quantity using the peak pressure instant t LES
peak obtained with βColin = 0.3 and βCharlette = 0.4 for the left and right figures, respectively.
Fig. 14. Comparison of overpressure signals between LES (efficiency model of Colin et al.) and experiments (envelope) when changing the number of baffle plates (SS, C 3 H 8 ,
8= 1).
• effectofthelocationoftheobstacles; • effectofthetypeoffuel.
The objective is to check if the numerical setup used in
Section 4.1 to simulatethe BBBS-C3H8 caseis ableto handlethe different configurations describedin Table 1 without any adjust-ment. All numericalmodels andparameters are kept unchanged, except the laminarflame thickness andthe laminar flame speed requiredtocalculatethethickeningfactorandtheefficiency func-tion,which areadapted to theconsidered mixture(C3H8,CH4 or H2)asmentionedinSection 3 .
The effect ofthe number ofbaffle plates isshown in Fig. 14 . LES overpressure time traces are compared to the experimental results for three configurations with 1, 2 or 3 baffle plates re-spectively, the fuel being C3H8. LES reproduces the overpressure magnitude for any of the three configurations: the flame is ac-celerated when adding obstacles, and the resulting overpressure is higher. As already mentioned by Masri et al. [28] , this re-sult is mainly due to an increasing globallevel ofturbulence in the chamber as the number of obstacles increases.Postpeak os-cillations are correctly captured as well. The effect of the posi-tion of the obstacles is also well captured by LES (Fig. 15 ). For this comparison, only one baffle is used, in first (configuration BOOS) or third position (configuration OOBS). These two config-urations are verydifferent sinceOOBSshowsextensivewrinkling after the baffle plate and around the central obstacle while in BOOS, the flame front isquasi laminarall along thechannel. In-deed forconfigurationBOOS, the slightturbulence introduced by the first baffle is totally dissipated before the flame reaches the central obstacle. Figure 15 thus confirms that, as expected, the model of Colin et al. is able to correctly degenerate towards a
laminar behavior in the absence of turbulence. Figure 16 high-lightsthefuelinfluencefordifferentexplosionsperformedin con-figuration BBBS.H2 explosionsgeneratethehighestoverpressures (and the highest flame front speeds, not shown here), followed by C3H8 and CH4 explosions, as expected from their respective flame speeds: S0
l
(
H2,8
=0.7)
=128cms −1>S0l
(
C3H8,8
=1)
= 38.4cms−1>S0l
(
CH4,8
=1)
=36.3cms−1. Even though LES cor-rectly reproducesthisglobaltrend,itsignificantly underestimates the overpressure for H2. In this case, the overpressure peak is significative (about 0.8 barin the experiments) andthe assump-tionthatthelaminarflamethicknessremainsconstantduringthe wholecomputation(seeSection 3 )isincorrect.Indeed,ifthe pres-sureincreasesfrom1barto1.8bar,itmeansthattheflame thick-nessshouldinfactdecreaseto40%whencomparedtoatmospheric conditions,causingtheflametobe locallyunderresolved.Evenif thisissueislimitedtoarelativelyshortdurationcomparedtothe total duration ofthe explosion,the underestimation ofthe thick-eningandefficiencyfactors(Eqs. (2) and(3) )maybe areasonfor theloweroverpressureobtainedintheLES.Onepossibleapproach to address thisproblem inthe futureis to introducea pressure-dependentflamethicknessintheexpressionoftheefficiency func-tioninordertogetapressure-dependentthickening.ToconcludewiththeSSresults,LESperformedwiththemodel of Colin et al. is able to reproduce the whole transient of an explosion scenario for all configurations and fuels. This was in some ways unexpected since this kind of algebraic closure is a priori not tailoredtohandleout-of-equilibriumsituations such as laminar–turbulent andturbulent–laminartransitions. However, as mentioned intheintroduction,therangeofvariationsintermsof ReynoldsandDamköhlernumbersisnarrowinthiscaseandlarger
Fig. 15. Comparison of overpressure signals between LES (efficiency model of Colin et al.) and experiments (envelope) when changing the position of the baffle plate (SS, C 3 H 8 , 8= 1).
Fig. 16. Comparison of overpressure signals between LES (efficiency model of Colin et al. and experiments (envelope) when changing the type of fuel (CH 4 : 8= 1; C 3 H 8 :
8= 1; H 2 : 8= 0.7). Configuration BBBS SS.
parametric variations are desirable to assess the behavior of the model.ThiswillbethesubjectofSection 5 thankstotheMSand LScases.
4.3. Meshdependency
The previoussection hasshownthe dependenceoftheresults on the turbulent combustion model.At this point, an important question is mesh dependency [73,74] . This issue is all the more importantforthefollowingsince thegridresolutionsusedinthe SS configuration and in the MS and LS configurations differ sig-nificantly (0.5,3and12.2mmrespectivelyintherefined region). In orderto assessthequality oftheLES andinparticularits de-pendencytothegridresolution,aVRLESwasperformedand com-paredtotheLESpresentedinthelastsection.ConfigurationOOBS is considered here.This configurationinduces aweakly turbulent flow forwhich therequirementsin termsofmesh resolutionare expected to be much lower than for the base case BBBS for in-stance.TheefficiencyfunctionofColinetal.isusedinbothcases. ThekeyfeaturesofthisVRLESaresummarizedinTable 5 interms of number of cells and characteristic length scales: on this very finegrid,thelevelofdescriptionofthesimulationcorrespondsto aQuasi-DirectNumericalSimulation(QDNS)oftheflame.TheLES models described above are always activated during the simula-tion. They naturallydegenerate towards DNSif the mesh resolu-tionishighenough.VerifyingthattheircontributioninthisQDNS caseremainsverylowisagoodwaytoestimatethequalityofthe simulation.Theobjectivesofthiscomparisonarethusmanifold:
• assesstheLESdependencytothegridresolution;
• check that LESnaturally tendstowards DNSwhen the resolu-tionishighenough;
Table 5
Grid characteristics for the VRLES and the LES of the OOBS SS configuration. 1x is the grid
size, δ0
l is the laminar flame thickness, l t and
ηk are estimates of the integral and Kolmogorov
length scale respectively. All simulations were performed on BlueGene/Q machines.
LES VRLES Number of cells 20 · 10 6 973 · 10 6 1x [mm] 0.500 0.136 lt / 1x [ −] 11.6 42.6 ηk / 1x [ −] 0.07 0.26 δ0 L / 1x [ −] 0.68 2.5
CPU cost [core-hours] 1 · 10 5 25 · 10 6
• thanks tothisnumericalexperiment, provideacomprehensive databasewhichmaybeusedthereaftertohelpdevelopingand validatingmodels.
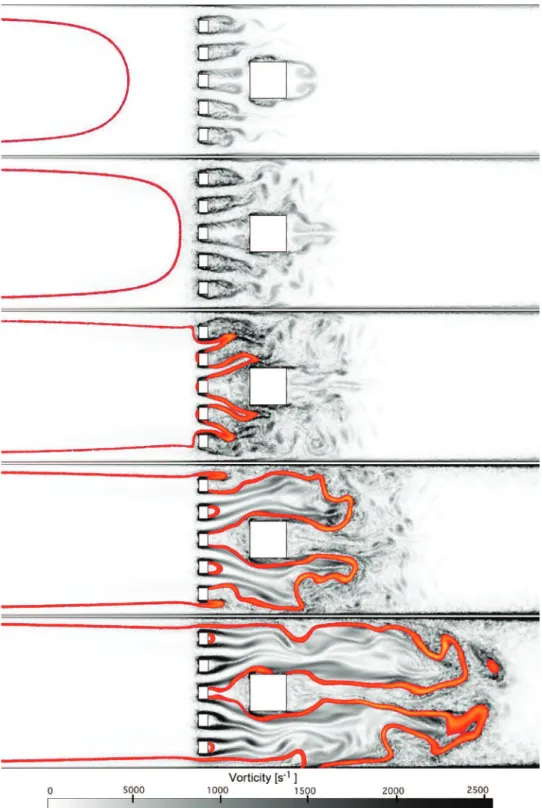
Figures 17 and18 revealverysimilarflamestructureswithLES andVRLESatfivesuccessivetimes.OfcourseVRLESexhibitsmany more turbulent structures, from the laminar propagation phase (top images) where vortex shedding behind the baffle plate is clearly evidenced to the fully turbulent propagation phase (bot-tom images) where the flame is much more wrinkled and dis-torted.Butitconfirmsthatthe20milliongridcombinedwiththe sub-gridmodelsisabletocapturethemainfeaturesofthe explo-sion.Inparticularthe flamepassagethrough thebaffleplateand aroundthecentralobstacle inLESandVRLESisfullycomparable. Thebottomimagesshowthatalotofturbulentstructuresarestill presentwellafterthecentralobstacles(therightborderofthe fig-urecorrespondstox≈20cm).This turbulencesupports theflame
Fig. 17. LES (20.10 6 cells, 1x = 0.5 mm) of flame propagation in configuration OOBS SS (C
3 H 8 , 8= 1). Time sequence at t −1tpeak = 9.3, 10.8, 11.9, 12.8 and 13.5 ms (from top
to bottom). Vorticity field and isoline of heat release.
development even if there are no further obstacles downstream ofthe centralobstacle. Itexplains whytheflame stillaccelerates until theend ofthe explosionchamber, as showninFig. 19 (left) whichcomparestheLESandVRLESflamefrontspeeds.Thisfigure showsthatthe LESandVRLESflames propagateinavery similar way. With VRLES the accelerations and decelerations around the obstacles are slightly morepronounced but thisis mainlya post processingartefactdueto smallpocketsofburntgasesdetaching fromthemainflamefrontundertheactionofsmallvortices (the flame front position is here defined as the leading point where
T>1500 K).This isconfirmedby Fig. 19 (right) whichshowsthat overpressure signalsobtainedwithLES andVRLES overlapalmost perfectly.
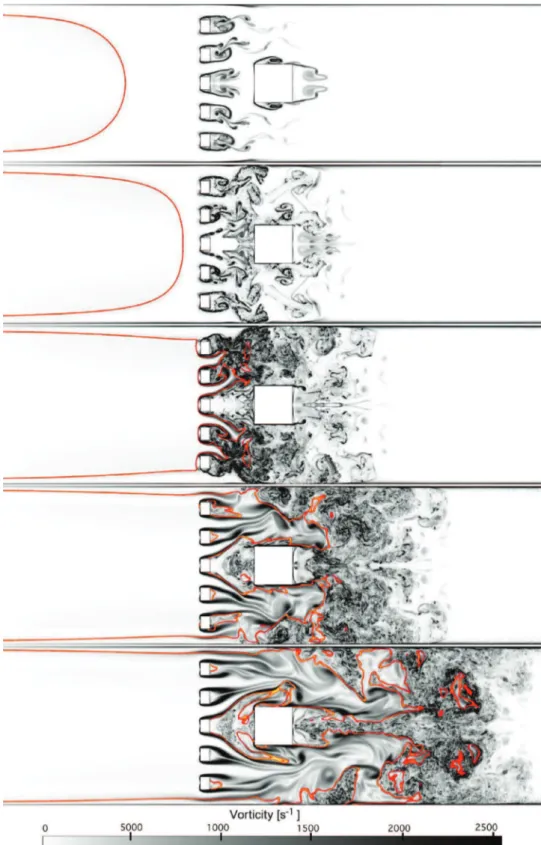
Finally,theevolutionofthetotalandresolvedreactionratesfor theLESandVRLES(Fig. 20 )confirmsthatthedesignationVRLESor evenQDNS(fortheflame)isappropriatesincethereactionrateis almost totallyresolved inthissimulation.Thesub-gridscale reac-tionrateremainsverylowallalongthecomputation,witha con-tribution which doesnot exceed8% of the total reaction ratein therefinedzone,i.e.forx<16cm.Thisalsoillustratesthecorrect
Fig. 18. VRLES (973.10 6 cells, 1
x = 0.136 mm) of flame propagation in configuration OOBS SS (C 3 H 8 , 8= 1). Time sequence at t −1tpeak = 9.3, 10.8, 11.9, 12.8 and 13.5 ms (from
top to bottom). Vorticity field and isoline of heat release.
behavior oftheLES combustionmodelwhichgoesto DNSas ex-pected when the flame resolution is sufficient. For the LES, the sub-grid scale model contributes up to 35% of the total reaction rateattheendoftherefinedzone(x=16cm)andaround23%at the central obstacle location (x ≈ 10 cm). The two totalreaction rate curvesmatch almost perfectly,confirming the grid indepen-dencyoftheresults.
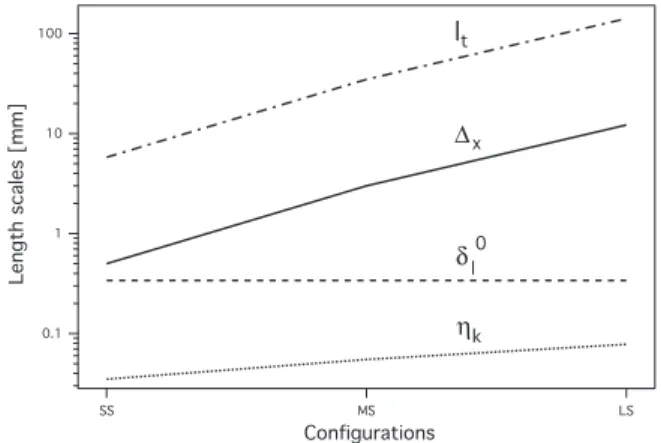
5. LESofthemedium-scaleandlarge-scaleexperiments WhengoingfromtheSSconfigurationtotheMS andtotheLS configurations,the geometryisscaled by afactor 6and24.4, re-spectively. It means that the integral length scale lt increasesby roughly the same factor. Since we have chosen to work at con-stant numericalcost whatever the configuration (similar meshes
Fig. 19. Comparison between VRLES and LES with the model of Colin et al. for configuration OOBS SS (C 3 H 8 , 8= 1). Left : evolution of the flame front speed as a function of the flame front position. Right : Pressure–time traces.
Fig. 20. Comparison between VRLES and LES with the models of Colin et al. for configuration OOBS SS (C 3 H 8 , 8= 1): total ( ˙ ωtot ) and resolved ( ˙ ωres ) reaction rates.
withabout20millioncellsatSS,MSandLS),thegridsize
1x
also scalesbythesamefactor.Consideringanidealizedturbulence (ho-mogeneous isotropic turbulence), the ratioof the integral length scale totheKolmogorov length scaleη
k,maybe expressedas ηltk ∼ Re3t/4. The velocity scale appearing in this turbulent Reynolds number is very difficult to estimate accurately. As a rough esti-mate, itmay be considered asproportional to the laminarflame speed since it is the velocity field createdby the laminar flame which induces turbulence.TheKolmogorov scaleη
k maythus be writtenasη
k∼ νS0
l
3/4
lt1/4.Finally,thecharacteristiclengthscale forcombustion, i.e. the laminarflame thickness
δ
0l,maybe con-sideredasconstant asa firstapproximation, neglectingthe influ-enceoftheoverpressuregeneratedduringtheexplosion.The evo-lutionof thesecharacteristiclength scalesis plottedinFig. 21 .It shows that the smallest andlargest turbulence length scales are not equallyupscaledwiththegridsize.Since thesmallestlength scales increase more slowly than the largest scales and the grid size,theproportionofturbulentsub-gridscalesisexpectedto in-creasefromSStoLS. Thisisevenmoretrueforcombustionsince thelaminarflamethicknessdoesnotincreasewiththesizeofthe configuration.Asaconsequence,thecontributionoftheturbulent combustionmodelisexpectedtoincreaseeven morewhen going fromSStoMSandtoLS.Itmeansthatevenifallnumerical mod-els and parameters are kept constant at all scales, the behavior of the efficiency function will become crucial when the scale of theconfigurationincreases.Notealsothatthenon-dependenceof the thickeningto thepressure, asdiscussedin Section 4.2 , intro-duces an additional modeling uncertainty at medium and large-scales due to the larger levels of overpressure reached in these configurations.
Fig. 21. Evolution of the characteristic length scales l t , ηk , δl0and 1x when going
from SS to LS (for a given fuel and mixture composition).
5.1. Medium-scaleexperiment
As fortheSSexperiment, thebehavior ofthemodels ofColin etal.andCharletteetal.isfirstassessed onthebasecaseofthe MS setup, i.e. configuration BBBS with C3H8. The propagation of the flame is illustrated in Fig. 22 . Experimental images are ex-tractedfromahigh-speedvideoandtheLESonesaretakenfrom the Charlette etal.computation (similarflame structures are ob-served withthemodel ofColin etal.butnot shown here). Con-trarytotheSSexperiment,theMSimagesofFig. 22 aresideviews that donotallowaclearvisualizationoftheflamefrontshape.In particular thefinger-shapedflames whichemergefromthe baffle plates are not visiblein thiscase. Nonetheless, they allowa first qualitative comparison of the flame propagation. The LES flame and the experimental flame proceed globally at the same speed andinthe sameway.As forthe SScase,the flameremains lam-inar afterthefirstbaffleplateandbeginsto wrinkleafterhaving passedthroughthesecondbaffleplate.The overallpropagationis muchlongerintheMScase,withabout28mstogofromthefirst tothethirdbafflecomparedtoabout4msintheSScase.
The evolution ofthe flame front speed (Fig. 23 (left)) reveals an explosion scenario which is very similar to the SScase, with successiveaccelerationsanddecelerationsastheflameprogresses through the channel alongsidethe obstacles. Both models repro-ducethisbehaviorbutwithvaryingdegreesofsuccess:themodel ofCharletteetal.matchesverywelltheexperimentalresultswhile the model of Colin et al. largely underestimates them from the second baffleplate. Downstreamofthe obstacles,the flamefront speed exceeds 350ms−1 intheexperiments andwiththemodel of Charlette et al. whereas it hardly reaches 275 ms−1 withthe modelofColinetal.Thesepredictionsarethedirectconsequence of the sub-grid scale combustion modeling: Fig. 23 (right) shows
Fig. 22. Flame propagation in configuration BBBS MS (C 3 H 8 , 8= 1). Left : time sequence of high-speed experimental images. Right : time sequence extracted from the LES (visualization of the reaction rate). The corresponding physical times t −1tpeak are given at the top of each image.
Fig. 23. LES of the configuration BBBS MS (C 3 H 8 , 8= 1) with the models of Colin et al. and Charlette et al. Left : evolution of the flame front speed as a function of the flame front position. Right : total ( ˙ ωtot ) and resolved ( ˙ ωres ) reaction rates.
Fig. 24. Configuration BBBS MS (C 3 H 8 , 8= 1). Left : pressure–time traces, comparison between experiments (three realizations) and LES performed with the models of Colin et al. and Charlette et al. Right model of Charlette et al., overpressure distribution in the center of the combustion chamber ( Y = 0, Z = 0) and along the longitudinal direction
X for the seven instants t −1tpeak displayed in Fig. 22 .
that, when the flame reaches the central obstacle, the sub-grid scale contribution isapproximately 80%of thetotal reaction rate withthemodelofCharlette etal.(50%intheSScase)andabout 60% withthemodelofColin etal.(30%intheSScase).As previ-ously,thesub-gridscalemodelingdoesnotsignificantlyimpactthe resolved reaction rate, which meansthat the globalreaction rate andtheresultingflamespeedaredirectlyproportionaltothe sub-grid scalecontribution.Asexpectedsincetheoverpressure gener-ated in the chamber is strongly linked to the flame front speed,
Fig. 24 (left)showsthat theLESwiththemodelofColinetal. un-derestimatesthepeakpressurewhilethemodelofCharletteetal. predictsitremarkablywell.Figure 24 (right)givesadditionaldetails forthemodelofCharletteetal.,showingthespatialdistributionof
theoverpressurefortheseveninstantsdisplayedinFig. 22 .Since thepressureisalmosthomogeneousintheYandZdirections,only profilesalongthelongitudinaldirectionXareplotted.
TheconclusionreachedherefortheMS caseis opposite com-paredtotheSSconfiguration:theCharlette etal.modelseems to performbetterthantheColinetal.model.Thishighlightsthe lim-itedpredictivecapacities ofthiskindofconstant-coefficients sub-gridscalemodeling.Ofcourse,thisdoesnotmeanthatthemodel of Charlette et al. is better suited for MS configurations or that themodelofColinetal.isunadaptedforlargersizecases.It sim-plyshowsthat thescales andflow conditionsintheMS case di-vergetoowidelyfromtheSScasetoallowauniquefixed-constant modeltobehavewelloversucharangeofvariationsandthatthe
Fig. 25. Comparison of overpressure signals between LES (efficiency model of Charlette et al.) and experiments (three realizations) when changing the type of fuel (configu- ration BBBS MS).
Fig. 26. Comparison of overpressure signals between LES (efficiency model of Charlette et al.) and experiments (three realizations) when changing the number of baffle plates (MS, C 3 H 8 , 8= 1).
SS–MScasesconstitute achallengingtest caseforturbulent com-bustion sub-grid scale models.For thefollowing tests, themodel ofCharletteetal.with
β
Charlette=0.5isretainedsinceitprovides thebetterpredictionsontheMSbasecase.The influence of fuel type on the overpressure is shown in
Fig. 25 . As for the SS experiment, stronger overpressure magni-tudes are obtained with C3H8 compared to CH4. LES performed withthemodelofCharletteetal.matchexperimentalresultswith an approximate35%reduction inpeakpressurewhen goingfrom C3H8toCH4.Figure 26 illustratestheeffectofthenumberofgrids comparing configurations BBBS and OOBS. Results are similar to the ones obtainedin the SS experiments.The flame propagation (notshown)issimilarinbothconfigurationsuptothesecond ob-stacle position sincethe turbulenceinduced by thefirst bafflein the BBBS case is very weak. From the second obstacle position, theflamestronglyacceleratesinconfigurationBBBSwhereasit re-mainslaminarinconfigurationOOBS.Thefinalflamespeed down-stream of the central obstacle hardly reaches 275 ms−1 in con-figurationOOBSincomparisonwiththe350ms−1attainedinthe BBBSconfiguration.Theresultingoverpressuretracesshowalarger peak pressure in the BBBS configuration (about 800 mbar) com-paredtotheOOBSconfiguration(about540mbar).Onceagain,LES capturesthepeakmagnitudeandpostpeaktransient.
5.2. Large-scaleexperiment
As mentionedinSection 2.2 ,noimagesoftheflame propaga-tionareavailableforthelarge-scaleexperiment.Theoverpressure generatedinthechamberisthus theonlymaterialavailablehere
forcomparison.Forthesakeofconcisionandsincethesamekind ofagreementbetweenLESandexperimentsisobtainedatLS com-paredtoMS, onlythemaximumpressurepeakis reportedinthe following figures.Moreprecisely, sinceshot-to-shotvariations are more importantinthisLSrigcomparedtothe MSrig,both min-imum andmaximumexperimental values ofthemaximum pres-surepeak willbe comparedtoLES.Note thattheLES flamedoes not propagatemuchfasterthaninthecorrespondingMS configu-rations (about400m/sdownstreamofthecentralobstacleversus 350m/sforconfigurationBBBSforinstance)anddoesnot transi-tiontodetonation.
Focusing first on the base case BBBS, the predictions of the modelsofColinetal.andCharletteetal.arecomparedinFig. 27 . As for the MS case, the overpressure is strongly underestimated withthemodelofColinetal.whileitisfairlywellpredictedwith themodelofCharletteetal.ForthisBBBSLScase,themagnitude oftheoverpressureisabout1620mbar(intheLES),comparedto about800mbarfortheMSconfiguration(ratio2.0)and110mbar for the SSconfiguration (ratio 14.7) with the same arrangement ofbaffleplates.Onceagain, thepressuretransientisalsowell de-scribed byLES(notshown).Forthefollowingconfigurations,only themodelofCharletteetal.isconsidered.
ParametricvariationsfortheLSexperimentfocusedonthefuel type (C3H8 versus CH4) andthenumberofgrids (onefor config-uration OOBSand three for configuration BBBS). Figure 27 (right) showsthe influenceofthe numberofbaffleplates:asforthe SS andMScases,LEScorrectlypredictstheincreaseofpressurewhen adding obstacles. The ratio betweenthe peak pressures obtained inthethree bafflesconfigurationandinthesinglebaffle
configu-Fig. 27. Comparisonbetween LS experiments (minimum and maximum values over the different experimental realizations) and LES performed with the models of Colin et al. and Charlette et al. Left : influence of the type of fuel. Right : influence of the number of baffle plates.
ration isapproximately1.2, which ismuch lower thaninthe MS case (ratio 1.5) and SS case(1.55). The comparison betweenLES and experiments when changing the type of fuel is displayedin
Fig. 27 (left).ThelargerflamespeedobtainedusingC3H8compared toCH4 leadstoastrongerpeakpressurewithC3H8,asatsmaller scales. Theratiobetweenthepeakpressures obtainedusingC3H8 andCH4 isabout1.2fortheLScase,1.5fortheMS caseand1.8 fortheSScase.TheseobservationsshowthatgloballytheSS con-figurations are the most sensitive to parametric variations (geo-metric orphysical). Thisalso illustrates thatupscaling effects are highly non-linear andtrying to extrapolate the characteristic pa-rameters ofanexplosion,typically theoverpressure,usingsimple scalinglawsisfarfromobvious.
6. Conclusions
Anewexperimentaldatabasehasbeenpresentedtostudy up-scaling effectsinaventedexplosion configurationandmore gen-erally the performances of premixedturbulent combustion mod-els. This database which uses three venting chambers, the origi-nal Sydney setup [28] andtwo Gexcon replicas scaled by 6 and 24.4, allows to test and validate different numerical approaches and models over a wide range of turbulent combustion regimes, with unambiguous initial andboundary conditions.Mesh depen-dencywas testedusingahighlyresolved quasi-DNSsimulation(1 billionpoints).Itisalsoadifficulttestwhereflamescanalternate betweenlaminarandturbulentregimes.
Two LES sub-grid scale combustion models (the algebraic modelsofColinetal.andCharletteetal.)werecomparedinterms of flamepropagation,flame topologyandgeneratedoverpressure. Foragivenscaleandwithasinglefixedand“wellchosen” model constant, LES results match experimental findings, for all geo-metric arrangements of the obstacles and for methane, propane andhydrogen.However,whenswitchingfromsmall-scalecasesto medium-scale orlarge-scale cases,this conclusion doesnot hold andthesamemodelhasdifficultycapturingallscaleswithoutany coefficient change.Thisresultillustratesoneofthemain deficien-cies ofthesealgebraicmodels,i.e. theneed foran a priori fitting ofthe modelparameters.At thesametime,it alsohighlightsthe need for large variations of Reynolds and Damköhler numbers offeredbythepresentdatabaseinordertocorrectlytestmodels.
Possiblesolutionstoovercomethelimitationsofalgebraic mod-els istousemorerefinedmodels,suchasthepromisingdynamic modelrecentlydevelopedbyWangetal.forinstance[20,72] .This model,takingadvantageoftheknownresolvedflowfieldto auto-maticallyadjust modelparametersduringthesimulation,hasthe capacity ofproviding a much better precision overa wide range
ofscales.Itisalsoaprioriabletobetterhandleout-of-equilibrium situations betweenturbulence motionsand flamedynamics such aslaminar–turbulentorturbulent–laminartransitions.
Acknowledgments
The authors thank Professor A. Masri (University of Sydney, Australia) and GexCon (Bergen, Norway) for providing experi-mental data. This work was supported by Total and ANRT un-der the CIFRE-2010-597 . It was performed using HPC resources from GENCI-IDRIS (Grant 2013-x20132b5031). An award of com-puter time was provided by the Innovativeand Novel Computa-tionalImpactonTheoryandExperiment(INCITE)program.This re-searchusedresourcesoftheArgonneLeadershipComputing Facil-ity,whichisaDOE OfficeofScienceUserFacilitysupportedunder ContractDE-AC02-06CH11357 .
Supplementarymaterial
Supplementary material associated with this article can be found,intheonlineversion,at10.1016/j.combustflame.2017.05.014 . References
[1] D. Bjerketvedt , J.R. Bakke , K.V. Wingerden , Gas explosion handbook, J. Hazard. Mater. 52 (1) (1997) 1–150 .
[2] British Gas , Review of the applicability of predictive methods to gas explosions in offshore modules, Department of Energy, London, 1990 .
[3] G. Ferrara , A.D. Benedetto , E. Salzano , G. Russo , CFD analysis of gas explosions vented through relief pipes, J. Hazard. Mater. 137 (2) (2006) 654–665 . [4] A.D. Benedetto , E. Salzano ,CFD simulation of pressure piling, J. Loss Prev. Pro-
cess Ind. 23 (2010) 498–506 .
[5] S. James , J. Zhu , M. Anand , Large eddy simulation as a design tool for gas tur- bine combustion systems, AIAA J. 44 (2006) 674–686 .
[6] P. Moin , S.V. Apte , Large-eddy simulation of realistic gas turbine combustors, AIAA J. 44 (4) (2006) 698–708 .
[7] L.Y.M. Gicquel , G. Staffelbach , T. Poinsot , Large eddy simulations of gaseous flames in gas turbine combustion chambers, Prog. Energy Combust. Sci. 38 (6) (2012) 782–817 .
[8] T. Poinsot , Prediction and control of combustion instabilities in real engines, Proc. Combust. Inst. 36 (1) (2017) 1–28 .
[9] O. Vermorel , S. Richard , O. Colin , C. Angelberger , A. Benkenida , D. Veynante , Towards the understanding of cyclic variability in a spark ignited engine using multi-cycle LES, Combust. Flame 156 (8) (2009) 1525–1541 .
[10] C. Rutland , Large-eddy simulations for internal combustion engine – a review, Int. J. Engine Res. 12 (5) (2011) 421–451 .
[11] D. Goryntsev , A. Sadiki , J. Janicka , Analysis of misfire processes in realistic di- rect injection spark ignition engine using multi-cycle large eddy simulation, Proc. Combust. Inst. 34 (2013) 2969–2976 .
[12] G. Ciccarelli , S.B. Dorofeev , Flame acceleration and transition to detonation in ducts, Prog. Energy Combust. Sci. 34 (4) (2008) 499–550 .
[13] V.D. Sarli , A.D. Benedetto , G. Russo , Using large eddy simulation for under- standing vented gas explosions in the presence of obstacles, J. Hazard. Mater. 169 (1–3) (2009) 435–442 .
![Fig. 1. Classical turbulent combustion diagram for premixed turbulent flames [22,23] as a function of the length ratio (turbulence integral scale l t /flame thickness δ l 0 ) and velocity ratio (rms (root mean square) velocity u ′ /flame speed S](https://thumb-eu.123doks.com/thumbv2/123doknet/3068570.86638/4.892.512.801.119.330/classical-turbulent-combustion-turbulent-turbulence-thickness-velocity-velocity.webp)