To cite this version: Pastor, Marie-Laetitia and Garnier, Christian and
Pescay, Christophe Comparison of two non destructive tests in carbon/epoxy
composites. (2010) Journal of Materials Science and Engineering, vol. 4 (n°
10). ISSN 1934-8959
This is an author-deposited version published in:
http://oatao.univ-toulouse.fr/
Eprints ID : 10897
Any correspondance
concerning this service should be sent to the repository
administrator: staff-oatao@listes-diff.inp-toulouse.fr
Comparison of two Nondestructive Tests in
Carbon/Epoxy Composites
Marie-Laetitia Pastor1, Christian Garnier2 and Christophe Pescay1
1. Institut Clément Ader (ICA), Université Paul Sabatier Toulouse, IUT de Tarbes, 1 rue Lautréamont, B.P.1624, 65016
, Tarbes 65016, France
2. Laboratoire Génie de Production, Ecole Nationale d’Ingénieurs de Tarbes,, 47 avenue d’Azereix, B.P. 1629, Tarbes 65016, France
Abstract: An investigation of two nondestructive methods (ultrasounds and infrared thermography) is carried out. The defect detection by both methods is first examined. The determination of the position and the dimensions are studied. And finally, the feasibility and the time of the experimental protocol setting up are analysed. The aim is to compare two nondestructive methods: ultrasounds and infrared thermography applied to composites samples. So, three different specimens are tested. It appears that the majority of the defects is detected very quickly with infrared thermography compared to ultrasounds method. However, certain defects are not visible by infrared thermography.
Key words: Ultrasounds, infrared thermography, NDT, composites.
1. Introduction
Aeronautical composite components are subjected to extreme conditions which may cause in-depth defects such as cracks, delamination, and so on. For safety reasons, it is necessary to detect these defects in order to repair, to reinforce or to change the damaged parts [1]. So it is important to use nondestructive methods to detect them in a fast and easy way. The repair or the reinforcement of aeronautical structures can often be carried out on the plane. Thus, it is interesting to detect defects in-situ. Today, the only NDT method which enables the certification is the ultrasonic testing [2]. It enables easily and precisely to detect many defects such as delamination, disbanding, and so on [3]. Nevertheless, it is a very slow process. So, in order to stage with this disadvantage, since the last twenty years, optical methods, in particular IR thermography,
Corresponding author: Marie-Laetitia Pastor (1979- ), female, Ph.D., assistant professor, research field: infrared thermography. E-mail: marie.laetitia.pastor@iut-tarbes.fr.
are applied in non destructive tests. Thanks to thermography IR, it is possible to analyze structures on plane. In fact, many defects in composites are revealed by IR thermography such as impact damage, delamination, disbanding, and so on [4, 5].
In the present work, an investigation of two nondestructive methods (ultrasounds and thermography IR) is carried out. The first part of the study consists in detecting defects by two nondestructive methods. So, three specimens with different defects are tested. The aim of the second part is to determine the position and the dimensions of defects by ultrasounds and thermography IR. So the parameters obtained by both nondestructive methods are compared to the theoretical dimensions of defects. And finally, the setting up of experimental protocols and the test times are analyzed according to the applied method.
The specimens are carried out from 8 woven plies carbon/epoxy composite. Specimens are rectangular
plates with a thickness almost equal to 2.8 mm. Different known defects are inserted in the specimens.
Table 1 Mechanical and thermal properties in composite [6].
Density Young’s modulus (GPa) Specific heat (J·kg-1·K-1) Thermal conductivity (W·m-1·K-1) Thermal expansion coefficient (10-6·K-1) Celerity (m·s-1)
Composite 1.4-1.7 129-154 902-1037 3.9-6.6 -0.44 – 0.16 2600-2700
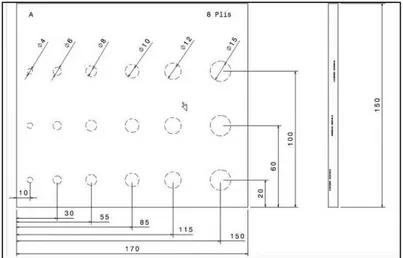
Fig. 1 Geometries of the three tested specimens.
2.1 Properties
The use of infrared thermography and ultrasounds requires some mechanical and thermal properties which are mentioned in Table 1.
2.2 Geometries
Three specimens with different defects are tested
(Fig. 1). A and B specimens have approximately the
same dimensions. They are 150 mm long and 100 mm wide. However defects are different. The defect present in A specimen is a delamination located in the middle of the plate. This defect was experimentally produced. The defect in B specimen is a peel ply located between two plies. This defect was intentionally inserted in the
composite. So the form and the position of the defect are well known.
Dimensions of C specimen are 170 mm long and 150 mm wide. Several identical defects are present in the composite. The position and the diameter of the defects are plotted in Fig. 2. The defects are Teflon coated fibre glass. These defects were intentionally inserted in the composite.
3. Ultrasounds
The ultrasounds method consists in analyzing the propagation of the high-frequency mechanical sound waves inside material [7, 8]. In fact, for high frequencies, the ultrasounds do not propagate in the air. The reflected sound waves enable to identify defects
A specimen B specimen
inside material. Thus the position, the depth and the shape of the defects can be determined.
3.1 Experimental Procedure
A transducer connected to a portable sound encoder called Omniscan enables to propagate the sound waves
Fig. 2 Geometry of C specimen defects.
in the material and to capture the reflected waves (Fig. 3). In order to improve the propagation of the sound waves, a gel is applied to the materiel. The ultrasounds tests are performed at 5 MHz with celerity equal to 2600 m·s-1. The first fast ultrasounds test is carried out to adjust the software parameters in order to detect the most precisely possible the defects in the tested specimen. The operator moves the transducer on all the surface of the specimen and looks at the reflected sound signals. For the tested specimen size, the ultrasounds tests last approximately 30 min.
3.2 Ultrasounds Results
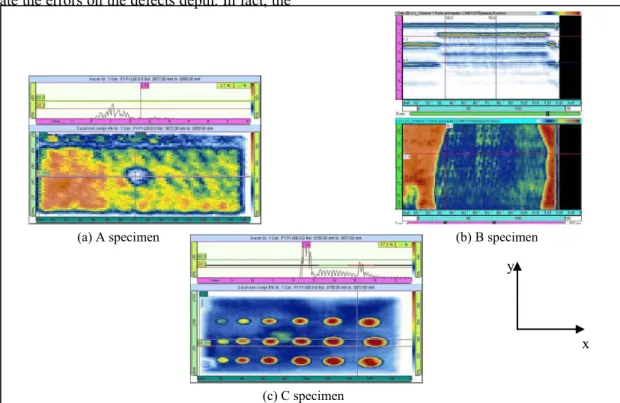
The ultrasounds tests are highlighted defects in the three tested specimens (Fig. 4).
For A specimen, the delamination was not detected by ultrasounds on the face opposed to the impact. In fact, the fibres are pulled out. Air is thus present between fibres. Consequently the sound waves do no propagate. In Fig. 4a, the observed defect is the impact. The ultrasounds limit is reached. Nevertheless, dimension and localisation are determined. The defect is circular and the diameter is equal to around 22±0.25 mm. It is located 73±0.25 mm from the right side along
the x axis and 50±0.25 mm from the bottom along the y axis.
For B specimen, the defect is located at 1±0.25 mm depth (Fig. 4b). Defect dimensions are 89±0.25 mm long (x axis) and 80±0.25 mm wide (y axis). It is locat-
Fig. 3 Ultrasounds device.
ed at the plate centre.
With ultrasounds, defect diameters are always overestimated compared to theoretical diameters inserted in the C specimen. The smaller is the defect diameter, the more important is the error. For the defects which are 4 mm in diameter, the error is equal to 100%. For the defects which are 15 mm in diameter, the error is equal to 13%. The errors can be explained by the dilatation of the images (Fig. 4c). The same remarks can be made for the defect position. However, the error value is a little weaker for the position along
the y axis than the ones along the x axis. In this case, the defect size is not considered any more. Only the defect alignment is taken into account. The defects depth was also determined. However, it is very difficult to calculate the errors on the defects depth. In fact, the
theoretical value of the defects depth is not well-known. The defects are located respectively at 2 plies, 4 plies and 6 plies. In theory, the plies are 0.25 mm in
Fig. 4 Defects in the three tested specimens.
thickness but in practice, it is difficult to have exactly 0.25 mm. The plies thickness varies from 0.25 to 0.35 mm. This variation comes from the composite compaction during manufacture. Thus, only an interval allows evaluating the error on the defects depth. They vary from 9% to 30%. Nevertheless, it is interesting to remark that all the defects of C specimen were detected.
4. Infrared Thermography
Periodic heat energy, generated by halogen lamps, is transferred to the material [9-11]. Thermal waves are propagated by conduction inside the material and are reflected on the boundaries. The wave reflection is disturbed by defects. The IR camera measures temperatures which are modified due to defects.
4.1 Experimental Setup
The temperature field is captured by an infrared CEDIP camera which features a focal plane array of 320×240 pixels. The thermal resolution of the camera is about 20 mK. Two halogen lamps are located at 300 mm from the specimen and heat it (Fig. 5). The
Fig. 5 Thermography IR device.
acquisition frequency of the films is equal to 50 Hz and the films last 30 s. The specimen is heated during 10 s
(a) A specimen (b) B specimen
x y
by halogen lamps. The temperature recording includes the heating time (10 s) and the beginning of specimen cooling (20 s).
4.2 Thermography Results
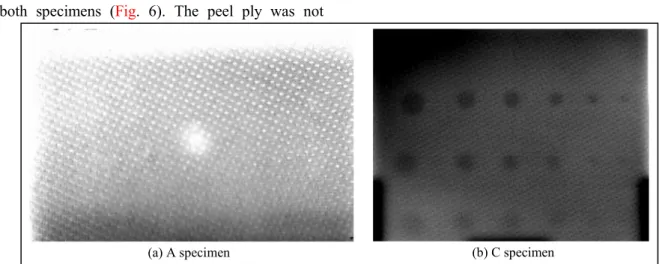
Infrared thermography tests are highlighted defects in both specimens (Fig. 6). The peel ply was not
detected by thermography IR. This is certainly due to the fact that the peel ply is well stuck to composite
Fig. 6 Defects detected by thermography IR in two tested specimens.
fibres. Thus, they constitute one and only one material and consequently it has the same conductivity as the resin. The experimental protocol was improved in order to try to detect the defect but that is not sufficient. So, this method presents some limits.
For A specimen, the delamination was detected by thermography IR very quickly (around 10 s) and very easily. After one test, the defect was detected (Fig. 6a). The specimen is heated on the same face as the temperature field is measured. Like with the ultrasounds method, the dimension and the localisation are determined. The defect is circular and the diameter is approximately equal to 12±2 mm. It is located 70±1 mm from the right side along the x axis and 41±1 mm from the bottom along the y axis. The measurements precision depends on the pixel size and the image quality. It was checked that the measurement method is reproducible by taking several measurements on a well-known specimen.
For C specimens, defects were detected by heating them on the back face and by measuring the temperature on the front face. With thermography IR, defects diameters are always underestimated compared
to theoretical diameters inserted in the specimen. The major inconvenient with thermography IR is that the small diameters are not correctly detected. The defects are visible but the diameters determination is not exact. There is an error on the diameter size only for the smallest one. The error is equal to 50%. The defect position along y axis is determined at ±1 mm. They are the same ones as the theoretical values. Nevertheless, there is an error on the defect position along the x axis. The error is all the more important since the defect diameters are small. For defects which are 4 mm in diameter, the error is equal to 40%. For defects which are 15 mm in diameter, the error is equal to 3%. It is interesting to remark that all the defects of C specimen were detected.
5. Comparison
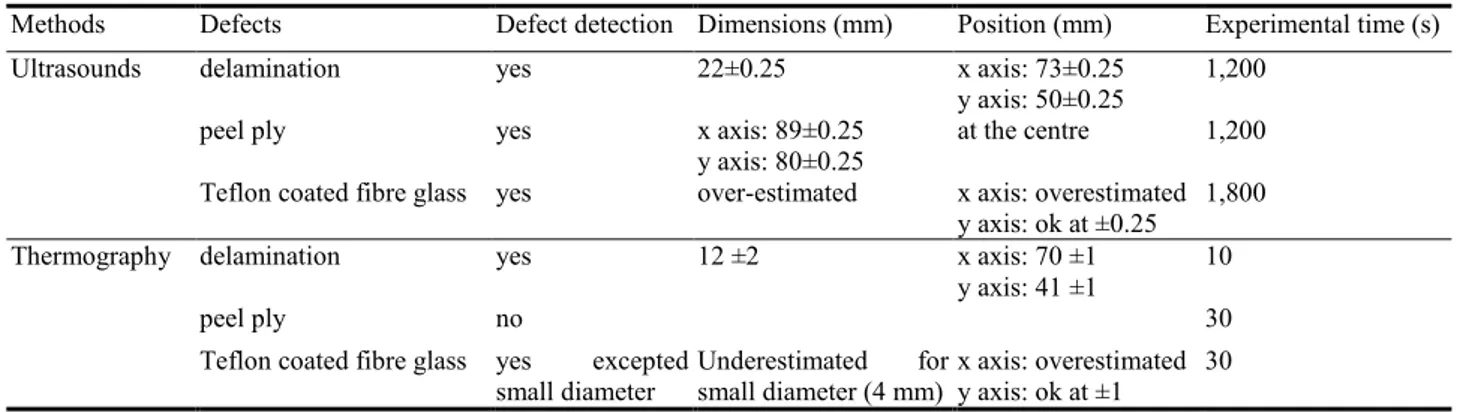
Both nondestructive methods enable to identify defects in different composite plates. Nevertheless, defects localisation and dimensions, experimental protocol setting up and experimental time differ from one method to another. Table 2 sums up the results obtained with both nondestructive methods.
The major advantage of the thermography is the experimental time. In 30 s, it is possible to know if the specimen or an industrial structure has a defect. However, according to the nature of the defects and/or the way in which they stick to adhesive or fibres, the thermography IR does not enable to detect them. It is important to note that for both nondestructive methods,
the defects position is not exact. Nevertheless, with thermography IR, defect dimensions are correctly determined except for small defects. In fact, under 6 mm, defects are detected with difficulty. The advantage of ultrasounds is that the defects depth can
Table 2 Comparison of ultrasounds and thermography results.
Methods Defects Defect detection Dimensions (mm) Position (mm) Experimental time (s)
Ultrasounds delamination yes 22±0.25 x axis: 73±0.25
y axis: 50±0.25 1,200
peel ply yes x axis: 89±0.25
y axis: 80±0.25 at the centre 1,200 Teflon coated fibre glass yes over-estimated x axis: overestimated
y axis: ok at ±0.25 1,800
Thermography delamination yes 12 ±2 x axis: 70 ±1
y axis: 41 ±1 10
peel ply no 30
Teflon coated fibre glass yes excepted
small diameter Underestimated small diameter (4 mm) for x axis: overestimated y axis: ok at ±1 30 be evaluated. For the moment, it is not possible to
determine the depth with thermography IR. But some works are in progress in this domain.
The inconvenient of ultrasounds is that in order to detect the more precisely possible the defects (location and dimension), it is necessary to sweep all the surface of the specimens. It is very long and tiresome. Moreover, it is important to adjust perfectly the Omniscan in order to determine defects dimension and position otherwise the effects edge can appear.
6. Conclusions
This paper examines two nondestructive methods: ultrasounds and thermography IR. The CND tests lead to the following conclusions:
1. Ultrasounds enable to detect all the defects whereas thermography IR does not detect a piece of peel ply in the composite.
2. Ultrasounds overestimate the defect diameter size. 3. With infrared thermography, defects under 6 mm are detected with difficulty.
4. The defect position is always overestimated with both methods.
5. The major difference between both nondestructive methods is the time to identify defects. Thermography IR is approximately 60 times faster than ultrasounds.
6. Further investigations are in progress in order to determine the defects depth by thermography IR and to carry out others CND tests on industrial specimens.
References
[1] M.L. Pastor, X. Balandraud, M. Grédiac, J.L. Robert, On the fatigue response of aluminium specimens reinforced with carbon-epoxy patches, Composite Structures 83 (2008) 237-246.
[2] S.K. Burke, S.M. Cousland, C.M. Scala, Nondestructive characterization of advanced composite materials, Mater Forum 18 (1994) 85-109.
[3] B. Djordjevic, H. Reis, NDE 1 (1998).
[4] B. Hay, J. Filtz, J. Batsale, Techniques de l’ingénieur R 2 955 Traité mesures et contrôles (2000).
[5] D. Pajani, Techniques de l’ingénieur R 2 740 Traité mesures et contrôles (2000).
[6] D. Gay, Matériaux composites , Edition Lavoisier, 2005 [7] Y.D. Huang, L. Froyen, M. Wevers, Quality control and
nondestructive tests in metal matrix composites, Journal of Nondestructive Evaluation 20 (2001) 113-132.
[8] A. Birk, R. Green, Nondestructive Testing Handbook, volume 7: Ultrasonic Testing, 2 edition, 1991.
[9] C. Meola, G.M. Carlomagno, M.D. Foggia, O. Natale, Infrared thermography to detect residual ceramic in gas turbine blades, Appl. Phys. A 91 (2008) 685-691.
[10] M.L. Pastor, X. Balandraud, M. Grédiac, J. Robert, Infrared Physics and Technology 51 (2008) 505-515. [11] M. Heller, J. Williams, S. Dunn, R. Jones, Composite
![Table 1 Mechanical and thermal properties in composite [6].](https://thumb-eu.123doks.com/thumbv2/123doknet/3689146.109436/3.892.83.811.213.695/table-mechanical-thermal-properties-composite.webp)