SPATIAL FUNCTIONAL SPECIALIZATIONS WITHIN INDUSTRIES: IMPLICATIONS FOR LOCAL EMPLOYMENT CREATION. CASE STUDY OF THE ELECTRICITY SECTOR IN CANADA, 1971-2001 Cédric BRUNELLE and Mario POLÈSE
INRS
Urbanisation, Culture et Société
NOVEMBER 2007Spatial Functional Specializations within
Industries: Implications for Local
Employment Creation. Case Study of the
Electricity Sector in Canada, 1971-2001
Cédric BRUNELLE and Mario POLÈSE
Spatial Analysis and Regional Economics Laboratory (SAREL)
Institut national de la recherche scientifique Urbanisation, Culture et Société
Cédric Brunelle
[email protected] Mario Polèse
Inédits, collection dirigée par Mario Polèse :
Institut national de la recherche scientifique Urbanisation, Culture et Société
385, rue Sherbrooke Est Montréal (Québec) H2X 1E3 Téléphone : (514) 499-4000 Télécopieur : (514) 499-4065
www.ucs.inrs.ca
TABLE OF CONTENTS
LIST OF TABLES ... IV
LIST OF FIGURES ... IV
ABSTRACT / RÉSUMÉ ... V
INTRODUCTION ... 1
1. FROM INDUSTRIAL TO OCCUPATIONAL – FUNCTIONAL – URBAN SPECIALIZATION ... 3
2. A CASE STUDY: THE ELECTRICITY SECTOR IN CANADA ... 7
3. EXPECTED FUNCTIONAL LOCATION PATTERNS ... 11
4. DATA AND METHODOLOGY ... 13
5. FINDINGS ... 15
5.1 Location Curves ... 15
5.2 Functional Specialization... 19
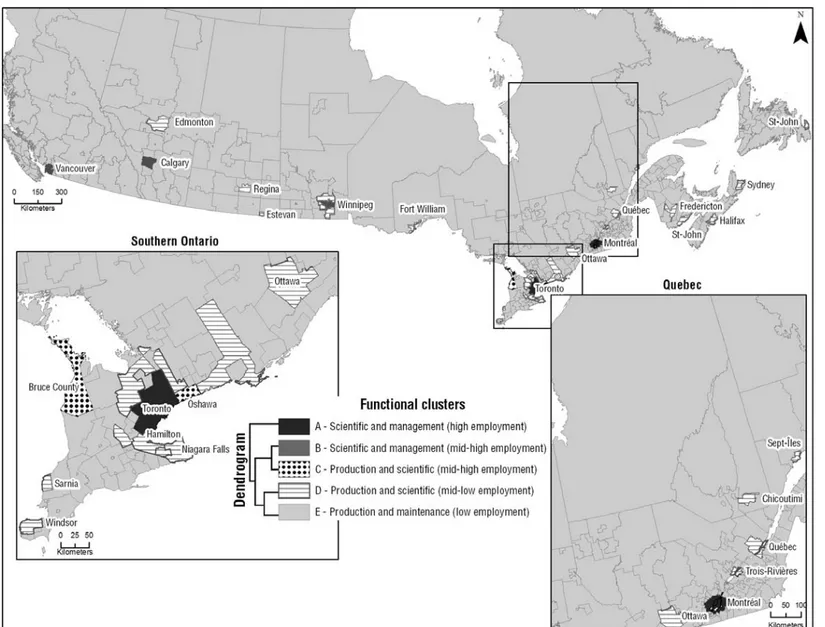
5.3 Functional Clusters ... 21
6. CLOSING THOUGHTS ON THE LOCAL DEVELOPMENT POTENTIAL OF WIND FARMS ... 25
CONCLUSION ... 27
REFERENCES ... 29
iv
List of Tables
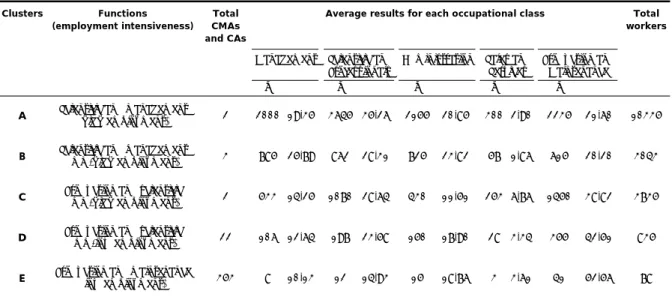
Table 1 Cluster Analysis Results Based on Five Occupational Classes within the Electricity Sector, Canada 2001 ... 21
Table 2 Spatial Functional Specialization* within the Electricity Sector:
Management/Blue Collar Workers. Four Canadian Provinces, 1971, 2001 ... 31
Table 3 Spatial Functional Specialization* within the Electricity Sector: Scientific
& Professional/ Blue Collar Workers. Four Canadian provinces, 1971, 2001 ... 31
List of Figures
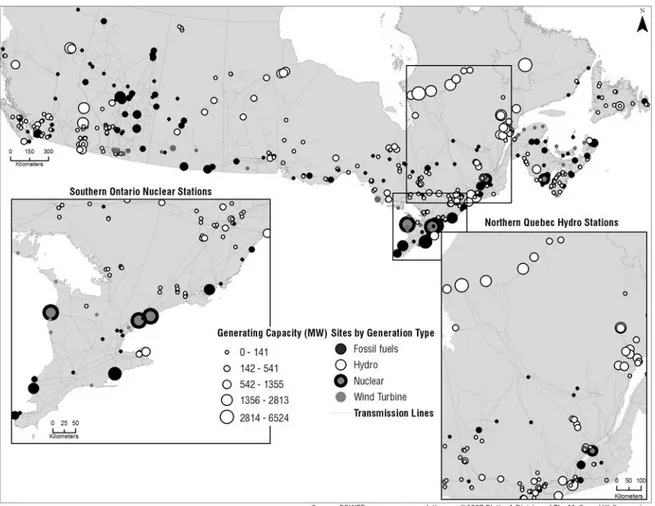
Figure 1 Electricity grids and generation facilities by type. ... 8
Figure 2 Location Curves. Employment in the Electricity Industry, Canada 1971, 2001. ... 16
Figure 3 Employment by Occupation, Electricity Sector, Canada 1971-2001. ... 16
Figure 4 Location curves. Three Occupational Classes, Electricity Sector, Canada 1971, 2001. .. 17
Figure 5 Spatial Functional Specializations within the Electricity Sector, 1971, 2001. ... 20
Figure 6 Spatial Functional Specialization within the Electricity Sector, CMAs and CAs 2001. ... 23
Abstract / Résumé
Empirical studies of location have generally focused on industries; less so on the location of functions within industries. This paper looks at the electricity sector in Canada from 1971 to 2001, using a center-periphery model. The industry is vertically integrated: power generation, distribution, and retailing are mainly done by a single firm. Location patterns are thus examined for occupational groups within the industry: production workers, management, scientific personnel, etc. The spatial distribution of occupations is found to be generally consistent with center-periphery relationships. However, differences exist depending on power sources: fossil fuels, hydro, nuclear, etc. The choice of energy is not without consequence for local economies. The paper also finds growing functional specialization between large metropolitan areas and non-metropolitan locations.
Keywords: Regional Development; regional economics; energy; functions; Canada
Alors que les études empiriques de localisation ont généralement porté sur les industries, peu d’études ont considéré les fonctions à l’intérieur des industries. Cette étude se penche sur le secteur de l’électricité au Canada de 1971 à 2001, en utilisant un modèle centre-périphérie. L’industrie est intégrée verticalement : la production d’électricité, la distribution et la commercialisation sont généralement effectuées par une firme unique. Les structures de localisation sont donc examinées par type de professions: travailleurs de production, gestionnaires, personnel scientifique, etc. L’analyse montre que la distribution spatiale des types de professions est généralement conséquente avec les relations centre-périphéries. Des différences existent cependant selon la source énergétique : combustibles fossiles, hydro, nucléaire, etc. Le choix d’une source d’énergie n’est pas sans conséquence pour les économies locales. L’étude trouve par ailleurs une croissance de la spécialisation fonctionnelle entre les grandes agglomérations métropolitaines et les localisations non-métropolitaines.
Introduction
The origins of this paper lie in the recent decision of the Quebec government to promote wind powered electricity production – wind farms – in the Gaspé in eastern Quebec, a traditionally declining region. Our initial motivation was to assess the potential of wind farms as possible engines of local economic development. Specifically, might wind farms improve the ability of localities to attract (and hold) skilled and other knowledge workers? This in turn led us to look at occupational classes. What kind of jobs would most likely be created locally and what kind elsewhere? However, little data exists on the wind power industry in Canada; it is still too young and too small. The industry is not identified in available Statistics Canada data. We thus chose to examine the next best thing: ‘The Electric Power
Generation, Transmission and Distribution Industry’ as defined in NAICS.1 We are fortunate in having access to spatialized industry employment data, cross-tabulated by occupational classes for Canada over a thirty-year period; these dada provide the basis for this paper (see Data and Methodology).
The industry – henceforth simply referred to as the electricity sector – is characterized by a high level of vertical integration. Although recent legislative changes have opened the door to competition for power generation in some provinces, the industry is still dominated by large public corporations, responsible for all stages from power generation (production) to distribution and retailing. Occupations in the industry are thus very diverse, ranging from engineers and line repairmen to sales personnel and managers. In this paper, employment in the electricity sector is grouped into five occupational classes. Location patterns for each class are analysed via a center-periphery model. The basic premise underlying our approach is that the rules which drive the location of different occupational groups are not fundamentally different from those which drive the location of different industries. Just as high-tech industries typically concentrate in larger metropolises, skilled – knowledge-rich – occupations are expected to be more heavily attracted to large urban centres. By the same token, blue collar occupations should be proportionally more present in smaller cities and remote locations – characteristic locations of primary industries. There is no reason a priori why location determinants of particular industries should not also hold for posited occupational groups – functions – in vertically-integrated industries.
In this paper, the spatial distribution of occupations within the electricity industry is examined for two time periods (1971 and 2001). Are functional specializations – by place – hardening or softening over time? What does this mean for peripheral places which house –
1
2
or have the potential to house – power generation facilities? As we shall see, the answer is not necessarily straightforward. Differences in power generation technologies are also a factor. Not all power generation choices – nuclear, fossil fuel, hydro, wind, etc. – necessarily produce the same spatial division of functions. We begin by briefly considering the literature on functional specialization and on the use of occupational data in regional analyses. We then look more closely at the electricity industry in Canada, posting the spatial functional specialisations we expect to observe.
1. FROM INDUSTRIAL TO OCCUPATIONAL – FUNCTIONAL – URBAN SPECIALIZATION2
Empirical studies of location have generally focused on industries, much less on occupations or functions within industries. Yet, the value of occupational data for understanding the spatial dynamics of employment has long been recognized. Thompson and Thompson (1985, 1986, 1987) are among the earliest and most prolific authors who stressed the importance of considering occupations and functions in addition to industrial classifications, introducing what they call the ‘occupational-functional approach’ (Thompson, 1986). Regions, they argue, may specialize along specific occupations and functions rather than along industries and sectors by taking full advantage of a multi-location structure: ‘an industry can be
disassembled and only part of it targeted to take advantage of the special locational needs and preferences of the many different operations’ (Thompson and Thompson, 1986, 21).
They suggest that studies and strategies dealing with local regional economies should ‘distinguish carefully between what [a region] makes and what [a region] does’ (Thompson and Thompson, 1987, 547). Feser (2003), some fifteen years later, uses almost the exact same terminology. In sum, occupations are sometimes a better indicator – it is argued – of the knowledge (or skill) content of regional economies than industrial structures.
The existence (and growth) of multi-establishment and multi-location firms adds another dimension to the industry-occupation distinction. Treating industries and sectors as homogeneous ensembles – considering the final goods produced rather than the tasks or functions performed at each location – can lead to misleading models based on the assumption that all activities are performed at a single location. Quoting Markusen J.R. (1995, 346):
In these models, a firm is generally synonymous with a plant or production facility; that is, a firm is an independent organization that produces one good in one location. Multiplant and multiproduct production, whether horizontal or vertical, are generally excluded from the analysis. This is potentially troubling. After all, industries characterized by scale economies and imperfect competition are often dominated by multinationals.
At the global level, multi-location structures, through horizontal (or vertical) integration, allow industries to profit from national differences, notably by a fragmentation of the value-chain (Krugman et al., 1995; Defever, 2006) or by internalizing different part of the value chain, thus resulting in vertical or horizontal integrations of new products and functions (Helpman, 1984; Markusen J.R., 1984, 1995). What is true at the international level may be even truer at the national level (Krugman and Venables, 1995). Industries facing low
2
4
transport and communication costs – plus a quasi total absence of barriers to trade within nations – will often find it advantageous to spatially split functions.
In the end, the sum of individual firm decisions, based on local advantages for specific functions, will determine regional occupational structures through the concentration of similar occupations in similar regions. The concentration of functions at the regional level can influence future regional growth, depending on the knowledge and skill level required for each task or function performed locally (Feser, 2003; Thompson and Thompson, 1987). As human capital and endogenous growth theory would suggest, the more knowledge is concentrated spatially, the greater the region’s growth potential (Braczyk et al. 1998; OECD, 1996; Romer, 1986, 1989, 1994). Quoting Thompson and Thompson (1987, 553) again: ‘the local
occupational mix is the most powerful determinant of the current level of local income but also, through its effect on educational levels, acts to influence the local propensity to invent and innovate’. Along the same lines, Feser (2003) and Koo (2005) show that specific clusters of
occupations are found in different metropolitan areas, arguing that occupational mixes within metropolises impact future economic development through skill and knowledge spillovers. More recently, Duranton and Puga (2005) have argued that there has been an important transformation in the structures of contemporary urban economies, from a ‘sectoral’ towards a ‘functional’ urban specialization. They found that the concentration of industries fell over the last thirty years, while the spatial specialization of regions significantly grew during the same period. Percentage deviations (from the national average) in the number of executives and managers compared to production workers substantially increased in large US urban areas between 1950 and 1990, but decreased in smaller US locations. Building on a theoretical model, Duranton and Puga (2005, 365) argue that there are advantages for firms to spatially separate functions: ‘Firms previously organised as a single unit become multi-unit
organisations. Multi-unit firms locate their headquarters separately from their own production plants, but close to other headquarters and business service firms. They also locate their plants close to other manufacturing facilities with which they can share intermediate suppliers’.
Duranton and Puga (2005, 365) conclude that the specialization of large US cities in managerial occupations is in large part explained by decreasing transport and telecommunication costs, which allows firms to split production and headquarters functions: ‘firms can locate their production facilities in environments with greater same sector
specialisation and their headquarters in business centers where business service employment is abundant’. Their findings are consistent with other studies which observe the formation of
‘occupational agglomerations’ (Barbour E. and Markusen A, 2004) or ‘knowledge clusters’ (Feser, 2003; Koo, 2005) resulting from the spatial division of labour within industries.
5
Considering the growing spatial division of labour – fragmentation – within firms, one might expect total employment to become less concentrated over time. However, findings for the US, Canada and Europe suggest that this is not what is happening; decentralisation is limited to manufacturing, while services – notably high-order services – are centralizing (Brülhart, 2006; Desmet, K. and Fafchamps, M., 2005; Polèse and Shearmur, 2006), which is not inconsistent with Duranton and Puga (2005). This is instructive on the way we should approach the relationship between occupations and industries. Perhaps the dichotomy is not as sharp as Thompson and Thompson and others have suggested, specifically for industries characterized by distinctive occupational mixes. It is self-evident, for instance, that management consultancies will have very different occupational structures from that of furniture manufacturers. In such cases, industry location patterns will, depending on their characteristic skill mixes, display similar patterns to those of certain occupational classes with analogous skill mixes. Staying with the same example, we would expect management consultants (an occupational class) and management consultancies (an industry class) to display a similar hierarchical pattern, with the highest concentration in the largest urban areas; while we would expect production workers (an occupational class) and employment in furniture manufacturing to equally display similar patterns, but this time favouring small and medium-sized cities. While it is true that falling transport and telecommunication costs have accelerated the movement towards multi-location structures for firms, this does not hold to the same degree for all sectors. The extent to which a sector is functionally specializing over space will in part depend on the extent to which it is vertically or horizontally integrated. Some sectors are still predominantly single firm with single locations. Other sectors – such as the electricity sector (the subject of this paper) – are multi-locational by their very nature, in part because they are ‘natural’ monopolies with an important network component. For industries characterized by high levels of horizontal (and vertical integration), an occupational approach appears to be almost unavoidable if we are to properly understand its spatial dynamics.
2. A CASE STUDY: THE ELECTRICITY SECTOR IN CANADA
As noted above, the electricity sector in Canada is a multi-location and multi-occupational industry. All activities in the sector have long been performed within vertically integrated organizations, generally public corporations in Canada. The generation, distribution, and retailing of electricity – the latter two being natural monopolies – is generally carried out by provincially-owned corporations: Newfoundland & Labrador Hydro; Nova Scotia Power; Hydro-Quebec; Ontario Power Generation; Atomic Energy of Canada Ltd.; Hydro Manitoba; Saskatchewan Power Corporation, B.C.-Hydro, and so on. Besides power generation, transmission, and distribution, most of these corporations engage in other activities such as the design, production and maintenance of major infrastructures. A typical example is Hydro-Quebec – the largest in the industry – which, besides its distribution division Distribution), transport division (HQ-TransEnergie), and power generation division (HQ-Production), has its own equipment division (HQ-Equipments), research center (IRHQ) comprising five laboratories, as well as its own engineering and project management consultancy (Société d’Énergie de la Baie-James).
Similar integrated corporations – though not always on the same scale – are found in each province. Power generation facilities, substations, transmission lines, and distribution networks extend across Canada, linking production facilities to consumption centers in larger cities (Figure 1). With such broad and widely different activities within a single industry, the range of occupations is predictably diverse: engineers, cartographers, biologists, managers, line maintenance workers, sales personnel, legal councillors, production workers, and so on. Other features of the industry also potentially affect employment location patterns. Power generation facilities are a source of regional differentiation, depending on the primary energy source used and the size and capacity of each facility (Figure 1). Because of different regional endowments in energy resources – large rivers, uranium deposits, natural gas, coal, oil, and wind – and because the industry is provincially controlled (each province favouring is resource), significant differences exist between Canadian provinces. Quebec and British Columbia both produce more than 85 percent of their electricity via hydro-electric facilities, while Ontario and Alberta produce less than twenty-five percent of their electricity from this source. In Quebec and British Columbia, the presence of powerful rivers has long orientated energy policies, leading to the development of large hydroelectric projects with important scale economies and low marginal production costs. In Ontario, the presence of uranium deposits was undoubtedly a factor in that province’s choice of the nuclear route. In Alberta, the availability of large oil, coal and natural gas deposits led the province to favour steam or combined cycle generation facilities. Different natural resources and different technologies will, we may reasonably assume, produce different occupational structures and also different location patterns.
8
Figure 1 — Electricity grids and generation facilities by type.
State control of the industry also has regional implications. Again, Hydro-Quebec provides a good example. Being provincially controlled, with the Quebec government as the sole shareholder, has meant politically laden corporate decisions, whether in matters of price setting (Bernard et al. 1997) or project development.3 One of Hydro-Quebec’s formal objectives – inscribed in its charter – is to promote economic development; a yearly assessment of its regional activities is published periodically (Hydro-Quebec, 1996-2006). Complying with regional objectives takes many shapes: subsidizing local industries via preferential pricing (most notably the aluminium industry); choosing local subcontractors; sharing local revenues from power generation (royalties are paid to certain Native groups), and preferential hiring of local residents.
3
Public opposition has often forced the Hydro-Quebec to abandon major projects, as in the case of Grande Baleine evaluated at $544 million (Bernard and al. 1992) or the more recent Suroît project (BAPE, 2003). Projects must be approved by a public hearing body, the Bureau d’Audiences Publiques sur l’Environnement (BAPE), mandated to assess environmental and social impacts.
9
The recent call for tenders for wind power project proposals in the Gaspé region of Eastern Quebec (Hydro-Quebec, 2005) is an example of a regionally targeted policy aimed at helping particular communities. Hydro-Quebec’s call for proposals stipulated that 60 percent of the projects’ expenditures must be made within the province, with 30 percent of the projects’ expenses to be made in the Gaspé region. Along with the Quebec government and regional agencies, Hydro-Quebec launched a series of promotional campaigns meant to foster the development of local “niches of excellence” (Quebec, 2007) for wind power generation in the Gaspé region. What the ultimate regional impact of such policies will be remains an open question, the initial motivation for this paper.
3. EXPECTED FUNCTIONAL LOCATION PATTERNS
Not withstanding its unique institutional and technological features, there is no a priori reason why the spatial distribution of functions within the industry should not display patterns consistent with the findings of other studies. Managers – an occupational class – should exhibit a hierarchal Christallar type distribution, characteristic of high-order services in general. Managers should thus be more concentrated in large metropolitan areas. Proximity to clients, subcontractors, governmental organizations and a diversity of talent and know-how are major factors for management functions, as they are for most high-order services (industries): legal services; advertising; consulting, etc. Proximity to political decision centers – an advantage for state-owned corporations – can sometimes reinforce economic centrality, facilitating interaction with elected officials and the bureaucracy. Technology and network configurations may also make some places more ‘central’ than others. Power lines, substations and electric production facilities are generally structured to supply large cities, the main consumption points. Large Canadian cities such as Montreal, Toronto, Calgary and Vancouver are natural hubs for power grids and activities which require coordination and management. By the same token, we should expect scientific, professional and other knowledge-rich occupations to exhibit a similar hierarchical pattern. Like managers, such occupational groups are sensitive to technological externalities, namely the non-pecuniary externalities resulting from social interaction and knowledge spillovers. However, although scientific and professional occupations should as a rule tend towards large metropolitan areas, we expect technological differences in power generation to influence the spatial distribution of some functions. Different technologies require different knowledge and skills. Nuclear power plants, for instance, requiring high security standards, may have a large number of engineers and scientific personnel on-site. Such differences may cause spatial distributions to deviate from ‘typical’ location patterns. Production and maintenance workers should exhibit distribution closer to that of medium-tech or resource-oriented industries. We would expect production and maintenance workers to be concentrated in peripheral areas in cases where the primary resources – say dammed rivers – are located in remote paces, producing a typical Weberian weight-loss industry pattern. Technological differences may also indirectly affect the spatial distribution of functions by influencing the location of generation facilities. Manners (1962) argues that although location choice for thermal production facilities is complex, certain factors predominate: proximity of oil, coal or natural gas, availability of cooling water, and proximity to sewage sites. Richetto (1980) found for United States that environmental factors and public opinion were the most important factors for nuclear plants. Bernard (1992) notes that social acceptability, the environment, and relations with Native peoples were decisive factors in the abandonment of
12
the Grande-Baleine hydroelectric project in Quebec. Sugiura (1993) found that proximity to water was the predominant location factor for most types of generation facilities, with proximity to large urban centers coming second. Generation facilities are not the only infrastructures requiring personnel. Power transmission lines and local grids all require at least a minimal presence of maintenance workers. In such cases, the expected distribution would probably be closer to that of retailing with a fairly dispersed distribution over space. This would equally be true for sales personnel. On the temporal dimension, following from Duranton and Puga (2005), we anticipate changes pointing towards a growing functional specialization of urban centres within the electricity industry, notably with respect to managerial and to scientific (and professional) functions. Along the same lines, we should expect to see the emergence of specific functional clusters across Canada: locations with distinctive occupational mixes. In sum, we should expect large metropolitan areas to be functionally specialized in management and scientific and professional functions and more remote locations to be specialized in production and maintenance functions. However, some variability is to be expected given differences in generation technologies and provincial energy policies.
4. DATA AND METHODOLOGY
The analysis is based on Statistics Canada’s 2001 National Occupational Classification Statistics (NOC-S) and 1981-1991 Standard Occupational Classifications (SOC). The industry definition is that 2002 North American Industry Classification System (NAICS): sector 2211 – Electric Power Generation, Transmission and Distribution. The data is drawn from the SAREL4 database, which ensures comparability over time in industry definitions and across spatial units. Spatial units are Census Metropolitan Areas (CMAs) and Census Agglomerations (CA) in 1971 and 2001, based on 1991 geographies. The changing definitions of occupational classes over time required building a concordance between earlier classification systems and newer ones in order to ensure longitudinal comparability. Occupational classes were created following guidelines prescribed by Statistics Canada (StatCan, 2002), resulting in six aggregate occupational classes:
Managers, directors and related occupations (A; B0; B1 and B3 of Statistics Canada 2001 NOC-S)
Natural sciences, engineering, mathematics, social sciences (C; E0; E211; E212 and E213 of Statistics Canada 2001 NOC-S)
Religion, education, health care, arts, recreation (D; E1; E214; E215; E216 and F of Statistics Canada 2001 NOC-S)
Administration and related activities (B2; B4 and B5 of Statistics Canada 2001 NOC-S) Retail and services (G of Statistics Canada 2001 NOC-S)
Agriculture, fishing, forestry, mines, construction, transport (H, I and J of Statistics Canada 2001 NOC-S)
Although such broad occupational aggregates are not optimal for pin-pointing skill categories, the use of cross-tabulations (between occupational and industry classes) leaves us little choice if we are to ensure a sufficient number of cases (jobs) per spatial unit. For the electricity sector, five occupational classes were retained:
Management
Scientific and Professional Occupations (mainly Engineers) Administrative Support (mainly Clerical)
4
Spatial Analysis and Regional Economy Laboratory (SAREL) – INRS-Urbanisation, Culture et Société (INRS-UCS), Montreal. The data is based on special Statistics Canada tabulations for INRS-UCS.
14
Sales and Services Personnel
Production and Maintenance (Blue Collar)
To analyse spatial distributions, we employ a centre-periphery model, using the typology proposed by Polèse and Shearmur (2006). Spatial units – 384 in all for Canada5 – are aggregated into five classes, based on size and distance criteria. The typology posits economic landscapes in which large metropolitan areas and nearby places define the ‘centre’. A metropolis (Metro) is defined as having a population of more than 500,000; other urban areas range from 10,000 to 500,000. Rural places are all those with populations below 10,000. Distance is defined by travel time from the metropolis; places within an hour travel time are classified as Central, those more distant are classified as Peripheral. More precisely, the five spatial classes are defined thus:
Metro: Metropolitan areas with population over 500,000
Cu: Central urban areas with populations between 10,000-500,000, located within an hour travel time of a metro area
Cr: Central rural areas with a population below 10,000, located within an hour travel distance of a metro area
Pu: Peripheral urban areas with population between 10,000-500,000 range, located beyond an hour travel distance of a metro area
Pr: Peripheral rural areas with a population below 10,000, located beyond an hour travel distance of a metro area
Three methods are used for analysing location patterns. First, location quotients are calculated for occupational categories by spatial class, which allows us to derive location curves as in Polèse and Shearmur (2006). Second, to analyse functional specializations over time, following Duranton and Puga (2005), we calculate percentage deviations from the provincial (or national) mean for each spatial class for the ratio of management and scientific/professional workers to blue collar workers in 1971 and in 2001 for Canada and for the four largest provinces. Finally, we perform a hierarchical cluster analysis on the five occupational classes for the year 2001, in order to identify specific functional clusters. We use Ward distance criteria in order to maximise inter-group variance and minimize intra-group ones (Ward, 1963). The number of clusters retained – five – is based on the gap observed between the semi-partial R square values obtained in the cluster analysis. The resulting functional clusters are mapped (Figure 6).
5
5. FINDINGS
5.1 Location Curves
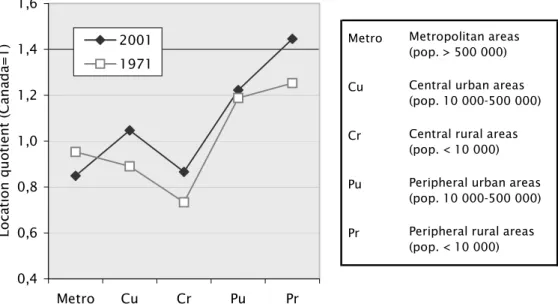
The interpretation of the location curves (Figures 2 and 4) is fairly straightforward. Quotients on the extreme left refer to the largest cities (Metro) and to peripheral rural locations (Pr) at extreme right hand side. A downward sloping curve is indicative of a hierarchical distribution, while an upward slopping curve suggests a Weberain resource-oriented – weight-losing – industry. Consumer-oriented activities, such as retailing, should on the other hand exhibit fairly horizontal – flat – curves, employment being more evenly distributed over space.
Let us begin by considering the electricity sector as a whole (Figure 2): peripheral-rural locations (Pr) show the highest relative concentrations with some presence in central-urban locations (Cu). The curves also show that employment has shifted from metropolitan centres (Metro) towards central urban (Cr) and peripheral rural (Pr) locations between 1971 and 2001. Small and remote locations continue to exhibit the highest concentrations. In short, for the industry as a whole the primary feature structuring the spatial distribution of employment appears to be the location of power generation-sites. This fits with what we know about power generation in Canada: over the last thirty years, some of the biggest hydroelectric projects were developed in remote locations such as in the James Bay region in Quebec and in non-urban parts of British Columbia, Manitoba and Newfoundland. On the other hand, the large nuclear power plants in southern Ontario explain the concentration of employment in central urban locations (Cu), often close to but not in Toronto, confirmed by Figure 1. In short, for the electricity sector, the choice of the primary resource (water or nuclear fuel in this instance) and the technologies involved are the chief factors driving employment distribution. The industry overall – as illustrated on Figure 2 – behaved very much like a Weberian resource-oriented sector, and increasingly so.
On the basis of Figure 2, one would naturally be tempted to conclude that the electricity sector does indeed favour peripheral locations. While it is true that employment overall is concentrated in peripheral locations, the occupational structure of industry suggests that this is largely due to blue collar employment (Figure 3). Other occupations exhibit different location curves, as we shall see shortly; but for the industry as a whole, their impact is largely swamped by the weight of blue collar (production and maintenance) workers.
16
Metro
Cu
Cr
Pu
Pr Peripheral rural areas (pop. < 10 000) Metropolitan areas (pop. > 500 000) Central urban areas (pop. 10 000-500 000) Central rural areas (pop. < 10 000) Peripheral urban areas (pop. 10 000-500 000) 0,4 0,6 0,8 1,0 1,2 1,4 1,6 Metro Cu Cr Pu Pr Loca tion q u otient (Can ad a=1) 2001 1971
Figure 2 — Location Curves. Employment in the Electricity Industry, Canada 1971, 2001.
0 10 000 20 000 30 000 40 000 50 000 1971 1981 1991 1996 2001 N u mber of em ployees
Production and maintenance Scientific and professional Administrative
Managers Sales and services
Figure 3 — Employment by Occupation, Electricity Sector, Canada 1971-2001.
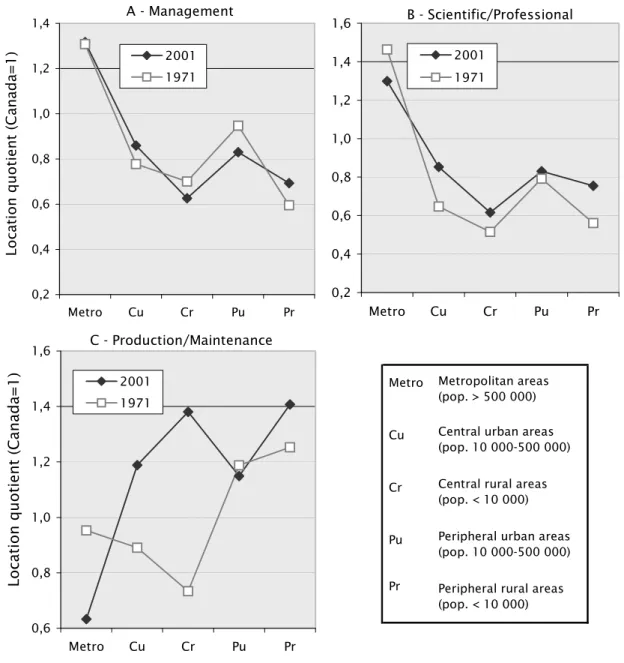
The industry location curves (Figure 2) suggested that only a limited number of employees are found in metropolitan areas. This no longer holds when management and scientific and professional occupations are considered (Figure 4A, B and C). As predicted, these occupations exhibit distributions closer to the hierarchical central place model. By contrast, production and maintenance workers are almost totally absent from large metropolitan areas (Metro) in 2001. Comparing the metropolitan with non-metropolitan locations, functional
17
specialization within the industry seems to have significantly increased over the last thirty years. The curves on Figure 4C suggest an exodus of power generation facilities out of large metro areas and towards neighbouring (central) towns and rural communities, and to a lesser extent towards more remote rural locations.
Metro Cu Cr Pu Pr Lo cation quotient (C anada=1)
Peripheral rural areas (pop. < 10 000) Metropolitan areas (pop. > 500 000) Central urban areas (pop. 10 000-500 000) Central rural areas (pop. < 10 000) Peripheral urban areas (pop. 10 000-500 000) A - Management 0,2 0,4 0,6 0,8 1,0 1,2 1,4 Metro Cu Cr Pu Pr Lo cation qu otie n t (Ca n ada= 1 ) 2001 1971 B - Scientific/Professional 0,2 0,4 0,6 0,8 1,0 1,2 1,4 1,6 Metro Cu Cr Pu Pr 2001 1971 C - Production/Maintenance 0,6 0,8 1,0 1,2 1,4 1,6 Metro Cu Cr Pu Pr 2001 1971
Figure 4 — Location curves. Three Occupational Classes, Electricity Sector, Canada 1971, 2001.
The spatial distribution of management occupations has remained remarkably stable between 1971 and 2001 (Figure 4A). There is nothing to suggest that management functions were any less sensitive to agglomeration economies in 2001 than thirty years earlier. The shift (in total industry employment) towards central urban locations – largely an Ontario phenomenon –
18
and towards remote rural locations does not seem to have carried a large number off managers along. Both the Cu and Pr have improved their relative positions, though still well below that of large metropolitan areas. Whether it be nuclear plants located in towns in Ontario or large hydro projects in northern Quebec or British Columbia, a minimal management presence is required.
Like managers, the overall spatial distribution of scientific and professional occupations has remained generally stable over time, with a continuing high concentration in large metropolitan areas, reflected in sharp downward sloping curves in both 1971 and 2001. However, the relative employment creation effect of generation faculties is, it appears, greater for scientific than for management personnel. Both the Cu and the Pr classes significantly improve their standing to the detriment of large metropolitan areas. These scientific cohorts undoubtedly include a large component of engineers. It is fairly obvious that nuclear plants and major hydro projects cannot function properly without the on-site presence of engineers. Given this, it is surprising that this occupational group should nonetheless remain so highly concentrated in large metropolitan areas, where generation facilities are largely absent. This suggests that scientific personnel in metropolitan and in non-metropolitan locations are carrying out different – although complementary – tasks. For (blue collar) production and maintenance occupations the location curves (Figure 4C) – generally upward sloping – are almost the exact opposite of the two preceding classes. Rural locations – both central and peripheral – are dominant for production and maintenance occupations. For peripheral locations, proximity to natural resources – notably harnessed rivers – is the primary structuring factor, as noted earlier, while the concentration of blue collar employment in central places mainly reflects the location of fossil-fuel, small-scale generations and nuclear plants for which natural resource proximity is less of a constraint. Figure 4C suggests that it is the latter which have mainly expanded over the last thirty years. Various examples confirm this. At the Ontarian Darlington nuclear generating station, located in the central urban city of Clarington, the number of production and maintenance workers has nearly tripled since it became operational in 1988. Similarly, at Quebec’s Gentilly II nuclear station, located near the central urban city of Trois-Rivières, the number of production workers has more than doubled since it became operational in 1983.
Besides nuclear facilities, the growth of production workers in central locations can also be attributed to an increase of small-scale production-sites. Technological innovations have made smaller generation facilities cost-effective, added to the market opportunities opened up by deregulation and lower transport costs. Gas turbines, microturbines, small-hydro, and wind powered facilities are examples of new technologies which can benefit from locating near consumption centers (IEA, 2002). Meanwhile, new large-scale generation-sites have
19
tended to favour the movement of production-sites towards peripheral rural locations. Over the last thirty years, several large hydroelectric facilities have been developed, in Quebec, British Columbia, Newfoundland, and Manitoba (Figure 1). A good example is Hydro-Quebec’s development of one of the world largest hydroelectric complexes – project La Grande – located in the remote James-Bay region in northern Quebec. The development of Canada’s largest nuclear production-site – the Ontario Bruce generating station, is responsible for the location of some 3500 workers in peripheral rural Bruce County.
Unlike knowledge-rich occupational groups, the location curves for blue collar workers show major location shifts between 1971 and 2001, although basically upward-slopping for both years. Three parallel processes appear to be at play: a) a crowding-out of power generation plants from large urban areas, fuelled undoubtedly by a combination of rising land and labour costs in large urban centres and increasing environmental concerns, the latter further heightened by NIMBY6 – especially for nuclear power – resulting in new plants being built in less densely populated locations; b) the development of ever more distant and large scale power generation facilities – mainly hydro – in provinces which have the appropriate natural geography; c) the continuing concentration of knowledge-rich functions in large metropolitan areas. The last, especially, suggests a growing functional specialization between locations that house generation facilities and large metropolitan areas, the subject to which we now turn.
5.2 Functional Specialization
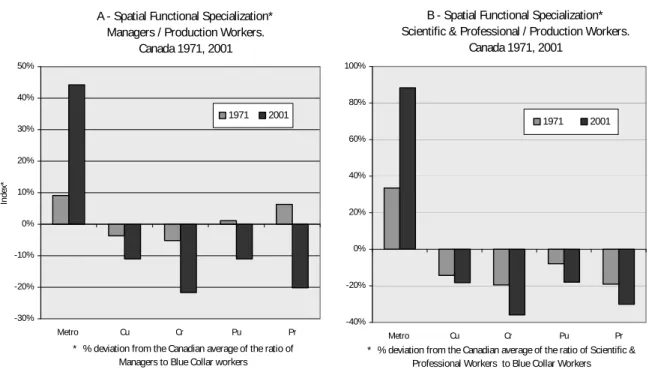
Figure 5A and B show results for two occupational comparisons, using the functional specialization index developed by Duranton and Puga (2005). The basic difference with their index is that our spatial typology includes a distance as well as size criterion. Again, the interpretation is fairly straightforward: the greater the difference between two spatial classes – as measured by their deviation from the national norm – the greater the functional specialization in terms of the two occupations compared. For both cases shown in Figure 5A and b, functional specialization between large metropolitan areas and other areas has, it appears, increased dramatically over thirty years. Only metropolitan areas show indexes above the national average for both ratios, the difference growing over time. In 1971 the relative proportion of managers (compared to blue collar workers) was some 9 percent above the national average in metropolitan areas; but rose to 43 percent in 2001. For scientific and professional personnel the equivalent numbers are 34 percent and 68 percent. On the other hand, all non metropolitan classes show consistent – and widening – negative deviations from the norm. Indeed, for managers, the sign has gone from positive to negative for peripheral rural (Pr) locations. These locations have, in sum, been increasingly specializing
6
20
in production and maintenance occupations over the thirty year period, compared to more knowledge-rich functions. The vertical integration of the electricity sector is undoubtedly a factor facilitating the trend towards spatial functional specialization, but it is not the only one.
A - Spatial Functional Specialization* Managers / Production Workers.
Canada 1971, 2001 -30% -20% -10% 0% 10% 20% 30% 40% 50% Metro Cu Cr Pu Pr In d ex * 1971 2001
* % deviation from the Canadian average of the ratio of Managers to Blue Collar workers
B - Spatial Functional Specialization* Scientific & Professional / Production Workers.
Canada 1971, 2001 -40% -20% 0% 20% 40% 60% 80% 100% Metro Cu Cr Pu Pr 1971 2001
* % deviation from the Canadian average of the ratio of Scientific & Professional Workers to Blue Collar Workers
Figure 5 — Spatial Functional Specializations within the Electricity Sector, 1971, 2001.
Table 2 and 3 in Appendix give the same information for the four largest provinces. The small numbers of observations in each spatial class make generalizations hazardous. However, some things are worth noting. For both functional specialization indexes, Quebec and British Columbia show the highest positive values (deviations) for the metropolitan class, suggesting that management and scientific functions are more centralized in these two provinces. Recall that these were also the two provinces that relied most heavily on hydroelectric power, which, we know, is in large part supplied by large-scale hydroelectric installations. Once the dams are built and running, relatively few managers and scientific personnel, we may assume, are needed on-site to keep the facility running. In contrast, the negative values (deviations) from the national norm for rural peripheral places are significantly lower in Ontario than in the two aforementioned provinces, suggesting quite different power generation technologies, requiring a more important on-site presence of managers and scientific personnel. Indeed, for the later class, peripheral rural places in Ontario have significantly improved their position over thirty years (going from negative to positive) which is precisely the opposite of what has happened in British Columbia and Quebec. In sum, scale economies as well as differences in generation technologies influence spatial functional specializations in the sector.
21
5.3 Functional Clusters
Table 1 shows the cluster analysis results. Clusters are created based on two dimensions – relative proportions for each occupational class and relative size based on the average number of employees. Clusters are derived from the two highest proportions observed for each occupational class, also taking into account the average total number of employees. Figure 6 maps the results.
Table 1
Cluster Analysis Results Based on Five Occupational Classes within the Electricity Sector, Canada 2001 Clusters Functions (employment intensiveness) Total CMAs and CAs Total workers n % n % n % n % n %
A Scientific and management (high employment) 2 2000 19,35 3645 35,26 2155 20,85 300 2,90 2235 21,60 10335 B Scientific and management (mid-high employment) 3 785 25,79 862 28,31 725 23,82 57 1,86 615 20,20 3043 C Production and scientific(mid-high employment) 2 533 14,25 1070 28,64 430 11,51 253 6,76 1450 38,82 3735 D Production and scientific(mid-low employment) 22 106 12,64 197 23,58 150 17,90 28 3,34 355 42,51 835 E Production and maintenance(low employment) 353 8 10,13 12 14,93 15 18,76 3 3,61 41 52,56 78
Production and Maintenance Average results for each occupational class
Management Scientific and Professionals
Administration Sales and Services
Clusters A and B – Scientific and management functions – are specific to the largest metropolitan areas, differentiated by the total number of employees. Unsurprisingly, Toronto and Montreal are the core centers for scientific and management functions, followed by Vancouver, Calgary and Winnipeg. These correspond to the largest metropolitan areas of the five largest provinces in Canada. As noted earlier, agglomeration economies and complementarities between scientific and managing functions provide the rationale for spatial clustering. Cluster E – Production and maintenance functions – is by far the most geographically dispersed. The distribution and transportation of electricity requires a minimal number of maintenance workers in almost all locations. The cluster includes almost all smaller and remote locations, while having the lowest mean employment level, with seventy eight employees per spatial unit.
Cluster D – Production and scientific – lies in between the previous two. With a mid to low employment mean slightly above eight hundred workers, it generally corresponds to the location of regional service centres and central urban places. Cities such as Edmonton, Regina, Ottawa, Quebec, Fredericton, St John, St John’s, and Halifax fall in this middle
22
position. Once again, the city’s position in the urban hierarchy is a factor. However, some locations do not fit the pattern. An example is the small city of Esteban, in southern Saskatchewan, which falls in cluster D because of its coal deposits and thermal generation sites. Several cities in southern Ontario – Windsor, Sarnia and cities near Toronto – densely populated or dependant on energy intensive manufacturing are other examples. Quebec’s aluminium producing towns, Chicoutimi and Sept-Iles, fall into the latter group.
Cluster C – Production and Scientific functions – is the main exception to the urban hierarchical model. Although similar to cluster D, it pin-points relatively high levels of employment in specified locations. With some 3,700 workers on average, it falls just below the employment levels of the largest metropolitan clusters. The cluster does not belong to a clear urban size class. The two spatial classes strongest on cluster C are peripheral rural (Pr) and central urban (Cu). However, what the two have in common is the location of some of the largest nuclear generating stations in the land (Figure 1): Bruce County – mainly rural – which is home to the 6523 MW Bruce generating station and the Oshawa area – highly urban – where the 3794 MW Darlington generating station is located. These nuclear facilities display high proportions of production and scientific workers; an average of 1,400 production workers and 1,000 scientific workers (Table 1). For Bruce County, characterised by smaller communities, these numbers are far from trivial. The nuclear plant is clearly a major factor in the local economy.
Summarizing, the spatial clusters observed here are driven by three major forces: a) urban hierarchies, b) the choice of a generation technologies, and c) an attraction/repulsion trade-off between network constraints, proximity to consumption centers and socially acceptable/secure distance from urban centers. Managers and scientific workers are pulled towards large metropolitan areas in a mutually complementary relationship. Production and maintenance workers are pulled towards remote locations, close to production-sites and infrastructures. Nevertheless, differences observed between southern Ontario and Quebec confirm that energy choices – mainly nuclear and fossil fuel in the former case and hydro in the latter – are structuring factors influencing spatial functional specialization. Whereas Quebec shows very centralized functional clusters, Ontario shows a more diffused spatial pattern with more differentiated clusters (Figure 6). This is consistent with the results in Appendix (Table 2 and 3) which suggests higher functional specializations in Quebec and British Columbia than in Ontario and Alberta. Finally, the growing attraction of central locations for production and scientific workers, as displayed by the location curves (Figure 4), is consistent with clusters D and C. Once again, this can be explained by the trade-off between lower transport costs (attraction) and social acceptability and land prices (repulsion). Clusters D and C are often located at the meeting points of networks and production-sites, in high consumption areas and in central locations.
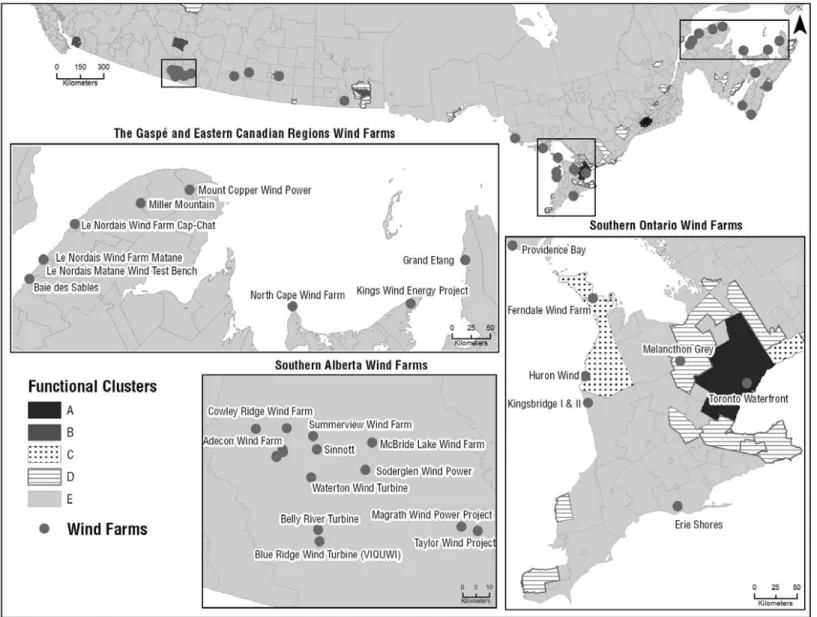
6. CLOSING THOUGHTS ON THE LOCAL DEVELOPMENT POTENTIAL OF WIND FARMS
Before concluding, we propose some thoughts on the potential of wind powered facilities as tools for local economic development in declining Canadian regions. Figure 7 maps functional clusters and wind farms in Canada. Although there is a time gap between the two datasets, the results suggest that wind farms in Canada are mainly located near low power generation and maintenance clusters – cluster E – with the exception of southern Ontario, explained by the presence of fossil fuel and nuclear facilities. Chances for a radical shift in the functional structures of remote regions such as the Gaspé and other eastern Canadian regions or southern Alberta thus appear low. The observed trend towards sharpening functional specialization suggest that employment resulting from new wind facilities will mainly bring blue collar workers to these areas, already specialized in such functions. New scientific and management jobs resulting from wind farms will most often be created in larger metro areas.
Even assuming targeted developing strategies, our findings suggest that wind farms are unlikely to reverse the increasing spatial functional specialization within the industry (Figure 5). ‘Niches of excellence’ in wind power7 – if any – will most likely emerge in or near large metropolitan areas, with (already) high concentrations of scientific and managing personnel. The technology of wind power is very different from that of (large) nuclear plants, which requires significant concentrations of scientist personnel on site. Nonetheless, the arrival of wind power facilities will bring in some knowledge workers, but not in large numbers. Without necessarily altering the trends described above, these workers – when added to blue collar type functions – will, hopefully, provide a new (but small) economic base for these otherwise fragile economies.
7
The term ‘niche of excellence’ was introduced by Quebec’s government under its ACCORD regional developing program. It refers to the possible creation of regional technological clusters in targeted sectors – wind energy in the case of the Gaspé region (Government of Quebec, 2007).
Conclusion
This paper looked at spatial functional specialization within a vertically-integrated industry. As expected, we found that management and scientific occupations are attracted to large metropolitan areas whereas production and maintenance workers are more often found in peripheral locations, close to power generation facilities. We also found that spatial functional specialization sharpened markedly within in the Canadian electricity industry between 1971 and 2001, which is consistent with trends observed elsewhere for all industries (Duranton and Puga, 2005). Large metropolitan areas are increasingly specializing in knowledge–rich functions compared to smaller places. As elsewhere, we may assume that this trend is in large part driven by new information technologies, which make it less and less costly for firms to separate their production facilities from their scientific and management facilities. However, this would appear to be especially true for the electricity industry. In an extreme (futuristic) scenario, one could imagine large hydroelectric facilities (dams, turbines, transmission lines, etc.) in remote areas being entirely managed and monitored from a computer centre at the head office (in Montreal, Vancouver, etc.). If any problems arise, workers are flown in and back. This is clearly an overstatement, but technological change does appear to have favoured increasing functional specialization over time. There is nothing to suggest that the trend will be reversed. Technological change has also produced transformations in the spatial distribution of power generation sites. The ‘crowding-out’ of power plants from large metropolitan areas to nearby communities (often rural) was facilitated by the arrival of new ‘mobile’ and cost-effective generating technologies, mainly for fossil fuels and nuclear energy, further accentuating the spatial division of functions between metropolitan and non-metropolitan areas. Technology also matters at another level. Our results suggest that different power generation technologies – nuclear, fossil fuel, hydroelectric, etc. – produce different patterns of spatial functional specialization. The choice of a generating energy source or technology is not without consequence for local economies. It would appear that hydroelectric-based power grids – prevalent in Quebec and B.C. – produce sharper, more centralized, functional hierarchies than power systems based on fossil fuels and, especially, on nuclear fuel, the latter the most common in Ontario. Only large power facilities, notably nuclear, are likely to generate significant numbers of knowledge-rich jobs in non-metropolitan areas. Finally, the chances of wind farms generating large numbers of local knowledge-rich jobs appear low.
References
Barbour, E. and Markusen, A. 2004. Regional Occupational and Industrial Structure: Does the One Imply
the Other? Minneapolis. University of Minnesota Ed
Bureau d’Audiences Publiques sur l’Environnement (BAPE). 2003. Projet de centrale à cycle combiné du
Suroît à Beauharnois par Hydro-Québec: http://www.bape.gouv.qc.ca/sections/archives/suroit/ (last accessed June 5th 2007)
Braczyk, H.-J., Cooke, P., and Heidenreich, M. 1998. Regional innovation systems. London: UCL Press Brülhart, M. 2006. The Fading Attraction of Central Regions: an Empirical Note on Core – Periphery
gradients in Western Europe, Spatial Economic Analysis 1(2): 227-235 Christaller, W. 1935. Die zentralen Orte in Süddeutschland. Jena, Fisher
Defever, F. 2006. Functional fragmentation and the location of multinational firms in the enlarged Europe.
Regional Science and Urban Economics 36 (5): 658-77
Desmet, K. and M. Fafchamps (2005) Changes in the spatial concentration of employment across US counties: a sectoral analysis: 1972-2000. Journal of Economic Geography 5: 261-284
Duranton, G. and Puga, D. 2005. From sectoral to functional urban specialisation. Journal of Urban
Economics 57(2): 343-70
Feser, E. J. 2003. What Regions Do Rather than Make: A Proposed Set of Knowledge-based Occupation Clusters. Urban Studies 40: 1937-58
Government of Quebec (Quebec). 2007. ACCORD project: Gaspesie-Îles-de-la-Madeleine Niche of Excellence. Ministry of Economic Development, Innovation and Exportation:
http://www.mdeie.gouv.qc.ca/page/web/portail/en/developpementRegional/nav/accord/49156/49464.h tml?iddoc=49464 (last accessed June 5th 2007)
Helpman, E. 1984. A Simple Theory of International Trade with Multinational Corporations. The Journal of
Political Economy 92(3): 451-71
Hydro-Québec (2005). Électricité produite à partir d'éoliennes totalisant 2000MW de puissance installée.
Approvisionnements en électricité: besoins québécois. H.-Q. Distribution. Montréal
Hydro-Québec (1996-2006). Profils Régionaux des Activités d'Hydro-Québec. Hydro-Québec. Montréal, Direction Générale HQ: http://www.hydroquebec.com/publications/fr/index.html (last accessed June 5th 2007)
International Energy Association (IEA). 2002. Distributed Generation in Liberalised Electricity Markets. Paris: OECD-IEA
Koo, J. 2005. How to Analyze the Regional Economy With Occupation Data. Economic Development
Quarterly 19(4): 356-72
Krugman, P. and Venables, A. J. 1995. Globalization and the Inequality of Nations. The Quarterly Journal
of Economics 110(4): 857-80
Krugman, P., Cooper, R.N. and Srinivasan, T.N. 1995. Growing World Trade: Causes and Consequences.
Brookings Papers on Economic Activity 1995(1): 327-77
Manners, G. 1962. Some Location Principles of Thermal Electricity Generation. The Journal of Industrial
Economics 10(3): 218-30
Markusen, A. and Shrock, G. 2001. Occupational Advantage: Detecting and Enhancing Occupational Mix
in Regional Development. Minneapolis. University of Minnesota Ed.
Markusen, J. R. 1995. The Boundaries of Multinational Enterprises and the Theory of International Trade.
30
Markusen, J.R. 1984. Multinationals, Multi-Plant Economics and the Gains from Trade. Journal of
International Economics 16: 205-226
OECD. 1996. The Knowledge-Based Economy. Paris: Organisation for Economic Co-Operation and Development: http://www.oecd.org/dataoecd/51/8/1913021.pdf (last accessed July 2d 2007)
Platts. 2007. POWERmap. Platts : A Division of the Mecgraw-Hill Company: www.powermaps.platts.com
(last accessed May 28th 2007)
Polèse, M. and Shearmur, R. 2006. Growth and Location of Economic Activity: The Spatial Dynamics of Industries in Canada 1971-2001. Growth and Change 37(3): 362-95
Romer, P. 1986. Increasing Returns and Long-Run Growth. Journal of Political Economy 94: 1002-1037 Romer, P. 1989. Human Capital and Growth: Theory and Evidence. NBER working paper no.W3173 Romer, P. 1994. Origins of Endogenous Growth. Journal of Economic Perspectives 8(1): 3-22
Richetto, J. P. 1980. The Environment as a Factor for Locating Nuclear Electrical Facilities in the United States. Geografiska Annaler. Series B, Human Geography 62(1): 39-46
Spatial Analysis and Regional Economy Laboratory (SAREL). 1971-2001. Integrated database on employment in Canada. Montreal: Institut National de la Recherche Scientifique – Urbanisation,
Culture et Société (INRS-UCS)
Statistics Canada (StatCan). 2001. Standard Occupation Classification. Statistics Canada:
http://www.statcan.ca/english/concepts/occupation.htm (last accessed May 28th, 2007)
Sugiura, Y. 1993. Spatial Diffusion of Japanese Electric Power Companies, 1887-1906: A Discrete Choice Modeling. Annals of the Association of American Geographers 83(4): 641-55
Thompson, W.R. 1985. From Industries to Occupations: Rethinking Local Economic Development.
Economic Development Commentary 9: 12-18
Thompson, W. R. 1986. Cities in Transition. The Annals of the Political and Social American Academy of
Science 488(1): 18-34
Thompson, W. R. and Thompson, P. R. 1987. National Industries and Local Occupational Strengths: The Cross-hairs of Targeting. Urban Studies 24(6): 547-60
Venables, A. J. 1996. Equilibrium Locations of Vertically Linked Industries. International Economic Review 37(2): 341-59
Weber, A. 1929. Alfred Weber’s Theory of the Location of Industries. Chicago: University of Chicago. Translation of ‘Weber, A. 1909. Über den Standort des Industrien. Tübingen’.
Ward, J.H.T. 1963. Hierarchical Grouping to Optimize an Objective Function. Journal of the American
Appendix
Table 2
Spatial Functional Specialization* within the Electricity Sector: Management/Blue Collar Workers. Four Canadian Provinces, 1971, 2001 Urban class Year Alberta British
Columbia Ontario Québec 2001 +27,07% +97,6% +34,4% +44,7% 1971 +3,42% +10,3% +6,1% +17,8% 2001 +22,6% -55,9% -6,9% -17,2% 1971 -1,1% -9,6% -3,0% -2,7% 2001 -30,3% -21,9% -22,3% -18,1% 1971 +1,3% -9,6% -3,9% -9,6% 2001 -35,5% -47,6% -18,2% -20,2% 1971 -10,8% -5,1% -1,0% -4,0% 2001 -42,3% -44,0% -7,9% -26,3% 1971 -6,2% -5,5% -7,6% -12,0% Pr Metro Cu Cr Pu
* percent deviation from the provincial average in the number of Managers per Production & Maintenance Worker.
Table 3
Spatial Functional Specialization* within the Electricity Sector:
Scientific & Professional/ Blue Collar Workers. Four Canadian provinces, 1971, 2001 Urban class Year Alberta British
Columbia Ontario Québec 2001 +20,6% +92,0% +66,7% +83,2% 1971 +12,8% +23,7% +36,0% +31,0% 2001 -62,6% -44,2% -19,8% -26,6% 1971 -9,9% -12,6% -21,6% -5,0% 2001 -37,2% -68,2% -42,6% -36,2% 1971 -19,2% -7,3% -25,6% -14,1% 2001 -13,9% -35,7% -35,2% -35,5% 1971 -9,9% -10,7% -15,7% -16,5% 2001 -23,4% -48,8% +1,1% -56,8% 1971 -18,9% -17,6% -18,8% -15,6% Pr Metro Cu Cr Pu
* percent deviation from the provincial average in the number of Scientific & Professional Workers per Production & Maintenance Worker.