HAL Id: hal-01609214
https://hal.archives-ouvertes.fr/hal-01609214
Submitted on 7 Nov 2018
HAL is a multi-disciplinary open access
archive for the deposit and dissemination of
sci-entific research documents, whether they are
pub-lished or not. The documents may come from
teaching and research institutions in France or
abroad, or from public or private research centers.
L’archive ouverte pluridisciplinaire HAL, est
destinée au dépôt et à la diffusion de documents
scientifiques de niveau recherche, publiés ou non,
émanant des établissements d’enseignement et de
recherche français ou étrangers, des laboratoires
publics ou privés.
Removal of lead(II) from aqueous solution using
modified palygorskite, contribution of inverse gas
chromatography
L. Boudriche, Rachel Calvet, Alain Chamayou, B. Hamdi, H. Balard
To cite this version:
L. Boudriche, Rachel Calvet, Alain Chamayou, B. Hamdi, H. Balard. Removal of lead(II) from
aqueous solution using modified palygorskite, contribution of inverse gas chromatography. Journal of
Chromatography A, Elsevier, 2015, 1408, p. 207-216. �10.1016/j.chroma.2015.07.011�. �hal-01609214�
Removal of lead(II) from aqueous solution using modified
palygorskite, contribution of inverse gas chromatography
L. Boudriche
a,b,∗, R. Calvet
c, A. Chamayou
c, B. Hamdi
b, H. Balard
d aC.R.A.P.C., BP 248, Alger Rp, 16004 Alger, AlgeriabL.P.C.M.A.E., Faculté de Chimie, USTHB, BP 32 El Alia, Bab Ezzouar, 16111 Alger, Algeria
cUniversité de Toulouse, Mines Albi, CNRS, Centre RAPSODEE, Campus Jarlard, F-81013 Albi Cedex 09, France dLab. Chimie Physique, (ENSCMu) ENSISA-W, 11, rue Werner, 68093 Mulhouse Cedex France
Keywords: Palygorskite Attapulgite
Inverse gas chromatography Adsorption
Heavy metal Isotherm
a b s t r a c t
Four modified palygorskite powders that had been milled in mortar, in air jet mill, in Pulverisette0 vibrating ball mill and treated with hydrochloric acid were used as adsorbents for lead removal from an aqueous solution. The adsorbents were characterized by nitrogen adsorption, size measurement, mercury porosimetry and scanning electron microscopy. Inverse gas chromatography at infinite dilution and finite concentration was also implemented to determine surface properties of the four samples, in particular the irreversibility indexes, a measurement of high-energy sites.
In a second part, batch adsorption experiments were carried out to study the effect of mechanical and chemical treatments on lead adsorption properties of the powder. The isotherm analysis indicated that the Langmuir model could represent the adsorption data. The sample ground in Pulverisette0 presented the highest cationic exchange capacity and led to the highest adsorption capacity despite the relatively low specific surface area and the complete destruction of the fibrous morphology of the raw powder. A correlation was shown between the cationic exchange capacity and irreversibility indexes obtained with isopropanol.
1. Introduction
Heavy metals, such as cadmium, lead, chromium, mercury, and copper, are released into the environment as a result of several industrial activities including manufacturing of microelectronics, electroplating, metal finishing, battery, tannery, processes in the metallurgical, and fertilizer industries. These metals lead to con-tamination of air, water and soil and consequently they can be absorbed by animals and plants. Due to their accumulation in the food chain and in the human body, they can present a risk for human health[1].
Conventional methods to treat contaminated effluents can be classified into several categories: adsorption (activated carbon, clays)[2–4], precipitation[5,6], physico-chemical techniques (e.g. electrolysis, solvent extraction, membrane separation)[7–9]and biological techniques (e.g. biosorption, phytoextraction)[10–12].
∗ Corresponding author at: C.R.A.P.C., BP 248, Alger Rp, 16004 Alger, Algeria. Tel.: +213 696521747; fax: +213 24325774.
E-mail address:boud lil@yahoo.fr(L. Boudriche).
However, for economic and practical reasons, many laboratories show more and more interest in the use of new adsorbents based on natural materials[13,14]. Thus, materials such as natural or syn-thetic zeolites, tuffs, volcanic ash and especially clays are used in the treatment of liquid effluents loaded with pollutants.
In the current study, four modified palygorskite samples were used to remove lead metallic ions from aqueous solutions. Among them, three were obtained using different milling processes, and one by an acid treatment. These mechanical and chemical acti-vations of palygorskite[15,16]induced changes in microstructure morphology and surface chemistry. All these modifications were expected to deeply change interaction capacities of the samples with the media, which was a lead(II) ion containing solution. These interactions could be assessed using inverse gas chromatographic analysis (IGC). Indeed, among the vapour adsorption techniques, inverse gas chromatography (IGC) is getting increasing attention as it offers several advantages such as the possibility of using a variety of probes and a broad range of temperatures[17]. This technique is very helpful to determine interactions between specific probes and the solid under investigation packed into a column in order to predict behaviour of the solid with its environment. After deter-mination, by IGC at infinite dilution, of classical parameters such
as dispersive component of the free energy (!d
s) or specific free energy of adsorption (− "Gspa), this study focused, particularly, on the determination of irreversibility indexes of palygorskite, using IGC at finite concentration with the isopropanol probe. This param-eter leads an assessment of amount of adsorption sites having a high energy of interaction on the palygorskite surface during the solid–gas adsorption process. This parameter will be correlated with another parameter characteristic of the surface clay, the cation exchange capacity, during solid–liquid adsorption process in the presence of a pollutant. Thus, the second part in this study cov-ered the adsorption performance of this clay towards a pollutant in the static mode. The adsorption capacities of palygorskite towards Pb(II) ions were assessed using the plot of adsorption isotherms in equilibrium conditions.
2. Adsorbents elaboration and characterization 2.1. Adsorbent elaboration
The palygorskite used in this study, is a hydrated magnesium aluminium silicate, from the Ghoufi region, in the North-East of Algeria. According to Bradley[18], palygorskite is a fibrous clay mineral; its structure (Fig. 1) consists of ribbons of a 2:1 phyl-losilicate, linked by periodical inversion of the apical oxygen of the continuous tetrahedral sheet and thus the octahedral sheet is discontinuous[19].
A rock palygorskite was first coarsely crushed and sieved to obtain a size fraction less than 1 mm. This raw sample was then processed to obtain four modified palygorskite powders imple-mented in the lead adsorption experiments:
- A crushing in an agate mortar and sieving in order to select the fraction having a diameter below 350 !m.
- A milling in a pancake air jet mill AS 50 supplied by the Hosokawa Micron Company. The injection and grinding pressures were 4.0 × 10⁵and 3.5 × 10⁵Pa, respectively.
- A milling for 60 h in a lab-scale vibratory ball mill called “Pulverisette0”, provided by the Fritsch Company. This device consisted in an agate vibrating vessel equipped with a 5 cm ball. The vibration amplitude of the vessel was fixed at 2 mm and 10 g samples were ground per experiment.
All the grinding processes were described in a previous study
[16].
- A chemical activation according to a protocol also described in a previous study[15]. It consisted in an hydrochloric acid treatment carried out under reflux system at the boiling point of the HCl solution for 6 h. The experiment was done with an 0.5 M HCl con-centration. After reflux, the solution was filtered and the residue washed with distilled water several times until elimination of all the chloride ions.
2.2. Characterization techniques
Particle size distribution measurements were performed using a Laser diffraction method on a Malvern Mastersizer 2000 device. The samples were analyzed using a dry-way feeder (Scirocco, Malvern) with a dispersion pressure of 3.5 × 10⁵Pa. Specific attention was paid to the Sauter mean diameter d32defined as follows:
d32=
!
n id3i!
n id2i (1) where niis the number of particles with size di.The true density # of samples was measured with a helium pyc-nometer (AccuPyc 1330-Micromeritics). The measurements were carried out with about 2–3 g of powder in a 5 mL cell. This tech-nique is based on measuring a change in pressure of helium in a calibrated volume with and without a sample.
The Sauter mean diameter d32and true density # allowed the calculation of the external specific surface area, aext, according to the Eq.(2):
aext= 6
# · d32 (2)
Particle morphology was investigated using a scanning electron microscope (Philips XL 30 model ESEM-FEG) operating at 3 kV.
The BET specific surface areas, meso- and micropore volumes were calculated using nitrogen adsorption at 77 K (ASAP 2010, Micromeritics). The same technique allowed the determination of the meso- and micropores volumes applying BJH and t-plot models, respectively. Size limits proposed by the International Union of Pure and Applied Chemistry are between 2 and 50 nm for mesopores and less than 2 nm for micropores. The samples were gassed out before analysis, at 378 K for 24 h at a pressure of 8 × 10− 1Pa.
Meso- and macro-pores volumes, having a distribution between 3.2 nm and 1 !m were determined by mercury porosimetry using a Micromeritics Autopore III WIN 9420 porosimeter.
2.3. Characterization results
The scanning electron microscope of the raw material exhib-ited a fibrous morphology with fibres having an average length less than 3 !m (Fig. 2a). This fibrous structure was preserved within crushing in the mortar (Fig. 2b) or grinding in a pancake air jet mill (Fig. 2c) despite the fibres became shorter and more disorganized. On the contrary, fibre morphology was totally destructed after 60 h milling in Pulverisette0 (Fig. 2d). After acidic treatment, the fibrous structure was also maintained (Fig. 2e).
Other characterizations (IR spectrum, PXRD pattern, adsorption isotherm, etc.) of the raw material and the processed ones were presented in previous works[15,16,21].
Different characteristic parameters such as the equivalent diam-eters (d50, d32), external specific surface area (aext), density (#), specific surface area measured by nitrogen adsorption (aBET), porous volumes (Vmicro, Vmeso, Vporous) were determined. The main results of characterization of the processed materials are presented inTable 1.
The highest specific surface area was obtained for the sample treated with the acid solution. Indeed, acid treatment leads to the remove of carbonates that generates porosity and to the increase of specific surface area.
The mesoporous volume, Vmeso, determined by nitrogen adsorp-tion and according to the BJH model characterizes the mesopores with diameters between 2 and 50 nm. The porous volume, Vporous, obtained by mercury porosimetry includes larger pores diame-ters, from 3 to 1000 nm, i.e. meso- and macropores. It can be observed that Vporousis slightly lower than Vmeso, except for the sample ground with Pulverisette0. A possible explanation is that measurement made by mercury porosimetry was performed on a tablet and the compression could modify the porous network. Nevertheless, Vporous and Vmeso are similar; they indicate low macroporosity.
Comparing the different samples, whatever the porous volume considered (Vmicro, Vmesoor Vporous), the highest one was observed for the sample treated with hydrochloric acid. It is also the result of the removal of carbonates that generates porosity.
Fig. 1. (a) Crystal structure of palygorskite “from Galan[20, Fig. 1]. Reproduced with kind permission of the Mineralogical Society, publisher of Clay Minerals” and (b) its polyhedral representation “from McKeown et al.[19, Fig. 1]. Reproduced with kind permission of the Clay Minerals Society, publisher of Clays and Clay Minerals.”
Table 1
Characteristic parameters of modified palygorskite samples.
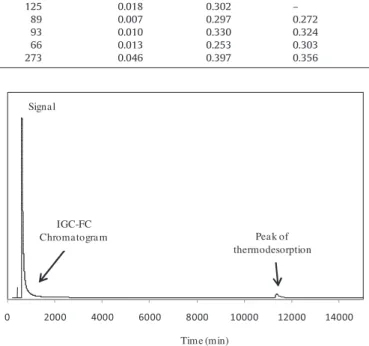
Sample d50(!m) d32(!m) #(g.mL− 1) aext(m2.g− 1) aBET N2(m2.g− 1) Vmicro(mL.g− 1) Vmeso(mL.g− 1) Vporous(mL.g− 1)
Raw palygorskite 143 23.56 2.57 0.09 125 0.018 0.302 – Milled in mortar 25 10.65 2.46 0.23 89 0.007 0.297 0.272 Milled in air jet mill 6 2.66 2.87 0.78 93 0.010 0.330 0.324 Milled in Pulverisette0 (60 h) 3 1.77 2.40 1.41 66 0.013 0.253 0.303 Treated with HCl (0.5 M) 265 97.27 2.40 0.02 273 0.046 0.397 0.356
3. Characterization of adsorbent surface properties by inverse gas chromatography (IGC)
3.1. Theoretical part
Inverse gas chromatography (IGC) can be carried out according to two different implementations at: infinite dilution (IGC-ID) and finite concentration (IGC-FC).
3.1.1. IGC-ID analysis
This technique reflects the interaction developed between a probe and high energy sites on the solid. It consists on the injection of negligible quantities of probes molecules (vapour) with known properties (polarities, ramification). Experimentally, the infinite dilution domain was defined by the fact that the retention time or volume remained constant in function of the injection probe vol-ume, this linear chromatography correspond to the Henry’s region. Then, depending on the chemical nature of the probe molecule, the IGC-ID provides different parameters:
- The dispersive component of the surface energy (!d
s), obtained
by injection of linear alkanes. This parameter indicates the ability of the solid surface to have non-specific interactions with probe molecules[22].
- The nanomorphological index IM($t), established by injection of branched or cyclic alkanes, delivers information about the rough-ness of the solid surface at the molecular scale[23].
- The specific component of the surface energy (− "Gasp), deter-mined by injections of polar probes, gives access to polar interactions, mainly the acid–base interactions[23].
More details regarding the calculations of various parameters obtained from IGC-ID experiments were given in a previous paper
[16].
3.1.2. IGC-FC analysis
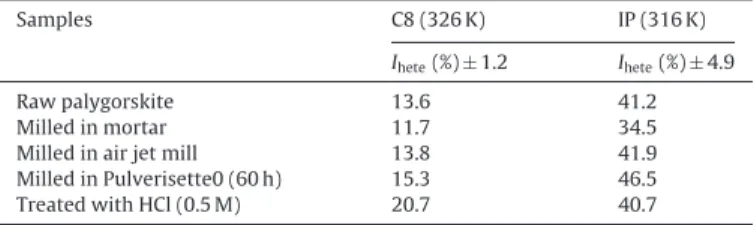
This technique includes injecting some microlitres of liquid probe (1–20 !L) into the column in order to cover the surface of the solid with a probe mono-layer. A strong asymmetric chro-matographic peak is obtained (Fig. 3). The more rapid method is “the elution characteristic point method” (ECP) that allows the acquisition of part of the desorption isotherm from a unique chro-matographic peak. According to this method, the first derivative of the isotherm is related to the retention time for each point of the rear diffuse profile of the chromatogram by the Conder’s equation
(3):
"
∂N ∂P#
L,tr =mRTJD (tr− t0) (3)where N is the number of desorbed molecules, P the partial pressure of the probe at the output of the column, L the column length, trthe retention time of a characteristic point on the rear diffuse profile of the chromatogram, t0the retention time of CH4, D the flow rate at the output of the column, J the James–Martin correction factor, mthe mass of adsorbent, R the Perfect gas law constant, and T the oven temperature. 0 2000 4000 6000 8000 10000 12000 14000 Signal Peak of thermodesorption IGC-FC Chromatogram Time (min)
Fig. 3. Experimental chromatogram and the associated thermodesorption peak obtained on palygorskite with isopropanol probe at 316 K.
After the integration of Eq.(3), the desorption isotherm can be obtained, and so the specific surface area of the solid and the BET constant of the organic probe can be calculated using a special software from the ADSCIENTIS society (Wittelsheim, France).
At the end of the chromatogram, the temperature of the chro-matograph oven is increased up to the conditioning temperature, leading to a secondary small peak corresponding to the amount of probe adsorbed irreversibly on the solid surface at the analysis temperature.
3.1.2.1. Irreversibility index. An irreversibility index (Iirr)[24]can be calculated from the ratio of the area of the thermodesorption peak to the total area of the chromatogram, as expressed in Eq.(4): Iirr= S Sth
rv+ Sth (4)
where Srvis the area of the main chromatographic peak and Sththe area corresponding to the thermodesorption peak.
The irreversibility index provides an assessment of the propor-tion of high energy sites depending on the nature of the probe. For example, with an isopropanol probe, the Iirrestimates the sites able to develop hydrogen bonds.
3.1.2.2. Distribution function of the energies of adsorption. Estima-tion of the surface heterogeneity of a solid using the adsorpEstima-tion energy distribution function (DF) is generally based on a physical adsorption model, which admits that the global isotherm may be considered as a sum of local isotherms of adsorption on isoenergetic domains (patchwork model)[24–26].
Thus, the distribution function of the relative abundance of each type of domain, having the same characteristic energy of interac-tion (ε), is given by the following integral (Eq.(5)):
N(T, P) = N0
$
˝
Table 2
Variation of the dispersive components of the surface energies (!d
s), the nanomorphological indexes IM($t), and the specific free energies of adsorption of acidic probes (− "Gspa) of modified palygorskite samples, determined by IGC-ID at 403 K.
Samples !d
s(mJ.m− 2) ± 4% IM($t) ± 5% − "Gspa kJ.mol− 1± 4%
2,3,4-TMP Cyclo8 CHCl3 CH2Cl2
Raw palygorskite 164 0.69 0.22 14 17
Milled in mortar 147 0.67 0.24 13 17
Milled in air jet mill 159 0.59 0.20 14 17
Milled in Pulverisette0 (60 h) 116 0.73 0.33 14 17
Treated with HCl (0.5 M) 133 0.71 0.26 12 14
Table 3
Values of the specific surface areas (aBET) and irreversibility indexes (Iirr) of modified palygorskite, obtained by nitrogen adsorption and IGC-FC (with n-octane C8 and
isopropanol IP).
Adsorption N2 IGC-FC
C8 (326 K) IP (316 K)
aBET± 0.3 (m2.g− 1) aBET± 2.8 (m2.g− 1) Iirr± 0.2 (%) aBET± 4.1 (m2.g− 1) Iirr± 0.6 (%)
Raw palygorskite 125.2 114.5 0.1 70.9 8.3
Milled in mortar 85.8 84.2 1.8 65.7 10.8
Milled in air jet mill 93.3 75.6 1.2 60.0 15.9
Milled in Pulverisette0 (60 h) 66.3 62.6 1.2 47.0 23.4 Treated with HCl (0.5 M) 272.6 135.4 2.1 100.0 10.4
where N(T, P) is the number of molecules adsorbed at pressure P and temperature T, N0is the number of the molecules which can
form a monolayer, '(ε, T, P) is the local isotherm corresponding to adsorption sites having the same characteristic adsorption energy ε, $(ε) is the so-called distribution function of the adsorption ener-gies (DFAE) describing the enerener-gies which exist at the gas–solid interface, ˝ is the physical domain of the adsorption energy, and ε is the characteristic energy.
3.1.2.3. Heterogeneity index. The index of surface heterogeneity, Ihete, defined in Eq.(6)can be determined by comparing the com-puted DF with the DF describing a homogeneous surface that fits the left descending branch of the experimental DF towards the lowest interaction energies[24]:
Ihete=A − AA H (6)
where A is the area under the experimental DF and AHis that under the homogeneous DF.
The distribution functions were computed using a special soft-ware from the ADSCIENTIS society (Wittelsheim, France). 3.2. Experimental conditions
The IGC measurements were performed with two GC devices (Agilent 7890A and 6890) equipped with sensitive flame ionization detectors (FID). Helium was used as carrier gas with a flow rate of 30 mL.min− 1. The injector and detector temperatures were 403 K and 473 K, respectively. The columns were filled with a mixture of palygorskite powder and glass beads. The amount of powder in the column was chosen according to the pressure drop, which had to be lower than 105Pa in order to avoid leaks at the septum and fittings. A reproducibility study was made on the raw material, namely three columns were prepared with the raw palygorskite, and ana-lyzed to obtain a standard deviation. That gave the quantities after the (±) sign appearing in the results ofTables 2–4.
3.2.1. IGC-ID experiments
The IGC-ID study was done with an oven temperature of 403 K, using stainless steel columns of 20 cm in length, with 6.35 mm in diameter. The columns were conditioned overnight at 423 K. The oven temperature for the analysis was chosen equal to 403 K to
allow for a good separation between the peak of methane and the peak of the probe.
The probes used were linear alkanes (hexane C6, n-heptane C7 and n-octane C8), two branched alkanes, the 2,3,4-trimethylpentane (2,3,4-TMP) and the 2,5-dimethylhexane (2,5-DMH), a cyclic alkane, the cycloctane (Cyclo8) and polar probes (chloroform CHCl3and dichloromethane CH2Cl2). These probes had chromatographic grade (>99%) purity.
3.2.2. IGC-FC experiments
For IGC-FC, the chromatographic columns were 10 cm in length and 6.35 mm or 3.18 mm in internal diameter. The conditioning temperature was 423 K. According to the Conder criterion [27], analysis temperature was fixed at 326 K with the n-octane (C8) and at 316 K with the probe isopropanol (IP) (Aldrich, purity >99%) used to study the surface chemistry. This criterion states that vapour con-tribution of the probe to the flow of carrier gas should not exceed 5% of the initial flow at the maximum of the chromatographic peak. 3.3. Results and discussion
3.3.1. IGC-ID
Table 2displays the values of the dispersive components of sur-face energy, !d
s, the morphological indexes, IM($t), and the specific components of surface energy with acidic probes, − "Gspa , of mod-ified palygorskite samples, used as adsorbents in this study.
The !d
s initial value of 164 mJ.m− 2 is typical of a phyllosili-cate, this high value is attributed to the insertion of the alkanes probes into the fibrous channels of the palygorskite or into struc-ture defects between fibres[21].
Table 4
Heterogeneity (Ihete) index values, measured by IGC-FC for n-octane and isopropanol probes, on modified palygorskite.
Samples C8 (326 K) IP (316 K) Ihete(%) ± 1.2 Ihete(%) ± 4.9
Raw palygorskite 13.6 41.2 Milled in mortar 11.7 34.5 Milled in air jet mill 13.8 41.9 Milled in Pulverisette0 (60 h) 15.3 46.5 Treated with HCl (0.5 M) 20.7 40.7
10 15 20 25 30 35 40 n-octane
Energy (kJ/mol)
χ(ε)(µmol/(kJ/mol)/m2) Raw palygorskite
Treated with HCl (0.5 M) Milled in mortar Milled in air jet mill Milled in pulverisette 60 h 0.05 0.10 0.15 0.00 10 15 20 25 30 35 40 Isopropanol Energy (kJ/mol)
χ(ε)(µmol/(kJ/mol)/m2) Raw palygorskite
Treated with HCl (0.5 M) Milled in mortar Milled in air jet mill Milled in pulverisette 60 h
0.05 0.10 0.15
0.00
Fig. 4. Distribution functions of the adsorption energies with n-octane (left) and isopropanol (right) probes measured on adsorbent samples.
Chemical and mechanical treatments to elaborate adsorbents, affected the values of the !d
s of the raw material, a decrease was
observed whatever the process, especially after 60 h of grinding in the Pulverisette0 from 164 mJ.m− 2to 116 mJ.m− 2. This change
reflects the disappearance of structural defects under mechanical stresses, reducing the ability of alkane probes to adsorb on the solid surface.
The nanomorphology index IM($t) parameters did not change
significantly with grinding and chemical activation, except for the sample milled in Pulverisette0. The IM($t) parameters obtained by
injecting the cyclooctane and the 2,3,4-trimethylpentane probes, had a high value in comparison to the other samples, reflecting the reduction of surface roughness during 60 h of milling in Pul-verisette0.
The basic character of the adsorbents was assessed by inject-ing acidic probes (chloroform and dichloromethane). The specific interaction parameters, − "Gspa, obtained by injecting the two
probes, remains constant, meaning that no chemical change occurs at adsorbents surface after chemical and mechanical treatments. Basic probes (ether, acetone, DMSO, DMF, methanol, toluene and 1,4-dioxane) were also injected but not eluted at the analysis temperature. The acidic character of the palygorskite surface can explain the retention of the basic probes. Therefore, the Guttman’s acidic and basic numbers usually used to characterize the acid–base interactions could not be calculated.
In summary, the IGC-ID parameters obtained in this study indi-cates that the sample milled in Pulverisette0 during 60 h, is the most strongly affected by the mechanical treatment. But IGC-ID parameters are clearly related to the adsorption sites having the greatest energy of interaction[23]. Other experiments were carried out using the IGC-FC mode.
3.3.2. IGC-FC
3.3.2.1. Specific surface area. The specific surface areas and irreversible indexes were measured by IGC-FC (Table 3) using n-octane and isopropanol probes.
The specific surface areas obtained with nitrogen and n-octane were similar except for the sample treated with the acid solution. This gap could be due to the uncertainty on the molecular areas of the organic probes, which were computed from the adsorption isotherm data measured on non-porous solids. The higher the spe-cific surface area and the porosity, the higher the uncertainly on the molecular areas of organic probes and higher the discrepancy between the nitrogen specific surface area and the organic probes as observed for palygorskite treated with HCl.
The specific surface areas obtained with isopropanol were lower whatever the sample. It could be explained not only by the uncer-tainty in the molecular area of the probe but also by the more irreversible character of isopropanol adsorption compared to that of n-octane, as testified by their respective irreversible indexes (Iirr) (Table 3). Of course, this irreversible adsorption contributed to the decrease in the measured specific surface areas, computed from the reversible part of the adsorption phenomenon.
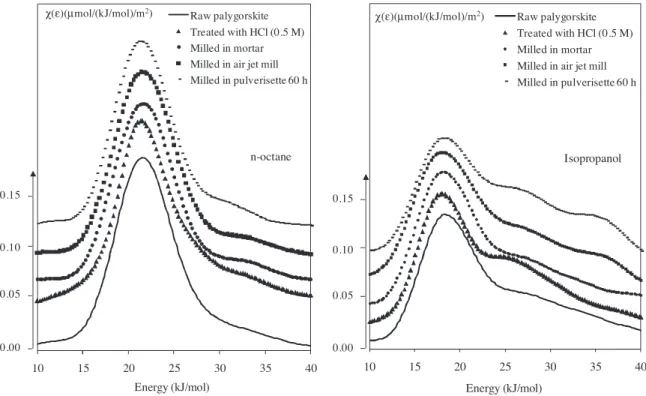
The specific surface areas varied in the same way regardless of the three probes used. Indeed, the specific surface area values of the sample treated with HCl were higher with the three probes, than those of raw palygorskite, in contrast to the values obtained for the sample milled in Pulverisette0, which were the lowest. The increasing of specific surface area was attributed to the elimina-tion of carbonates with the acid treatment effect, and consequently to the creation of new porosity accessible to probes. On the other side, the decrease in the specific surface area after milling can be explained by the alteration of the internal structure of particles (physical alteration, such as the disappearance of porosity)[16]. 3.3.2.2. Surface energetic heterogeneity. The heterogeneous char-acter of the solids was studied by determining the distribution functions (DF) of the adsorption energies of both n-octane and iso-propanol probes (Fig. 4). The first one, an apolar probe, is mainly sensitive to the surface morphology, and the second one, a polar probe, is more sensitive to the surface functionality, especially the presence of silanol groups.
The distribution functions (DF) of the adsorption energies obtained with n-octane, which exchanges only dispersive interac-tions with the solid surface, are essentially monomodal. Comparing the heterogeneity indexes obtained with this same probe (Table 4), the sample treated with the acid solution leads to a value higher (20.7%) than those obtained with the other samples (around 13%). The high specific surface area and porosity of the sample treated with acid can explain the high Iheteobserved with n-octane, which is sensitive to the solid morphology. The results obtained with n-octane demonstrate that the mechanical treatment did not cause significant changes in surface morphology of palygorskite fibres on the contrary of the acid treatment.
With isopropanol, which is sensitive to the surface functionality, the DF exhibits a monomodal shape with a tail extending towards the high energies. However differences can be noted:
- The sample treated with HCl shows a weak shoulder at 26 kJ.mol− 1, probably related to the dissolution of carbonate impurities which liberates high energetic sites.
- The sample milled in Pulverisette0 during 60 h, reveals two shoul-ders at high energies at 27 kJ.mol− 1and 35 kJ.mol− 1, traducing the appearance of polar sites under mechanical effect that could strongly interact with the isopropanol probe.
The highest isopropanol hetegeneity index was obtained for the sample milled with the Pulverisette0 (46.5%) testifying the appear-ance of high energy sites, which are able to develop hydrogen bond. In conclusion regarding surface energetic heterogeneity, the acid treatment leads to significant modifications of the surface mor-phology, which is related to the removal of carbonates and the appearance of porosity. The mechanical treatment, especially the Pulverisette0 seems to release high energy sites, able to develop hydrogen bonds probably silanol groups.
4. Lead adsorption studies 4.1. Pb(II) adsorption experiments
The solutions of Pb(II) were prepared by dissolving lead nitrate (Pb(NO3)2, Aldrich, ≥99%) in deionized water. Lead solutions and palygorskite powder were placed in a 500 mL reactor equipped with a four blade stirring propeller. Adsorption capacity of the treated samples was studied with 5 g of powder in 500 mL of waste solution. Different lead concentrations, ranging from 100 to 7000 mg.L− 1, were prepared, with an initial pH of 5.3. The con-tact time for which the adsorption reached equilibrium was set at 5 h despite a previous study showed that the pH was stabi-lized after half an hour of stirring. The mixtures were agitated at a speed of 400 rpm. Then, the samples were collected and filtered with polypropylen filter cartridges (0.45 !m-pore diameter) and analyzed by inductively coupled plasma (ICP) thereafter. The ICP spectrometer used was an Ultima2 model from Horiba JobinYvon company. Lead was analyzed at 220.3 nm wavelength.
The adsorption capacity of Pb(II) ions could be calculated using Eq.(7):
Qe=
%
C0m− Ce&
· V (7) where Qe(mg.g− 1), the adsorption capacity, is the amount of metal ions adsorbed at equilibrium per unit mass of adsorbent, C0(mg.L− 1) and Ce(mg.L− 1) are the Pb(II) ion concentrations before adsorption and at equilibrium, respectively, V (L) is the initial volume of the Pb(II) ion solution, and m (g) is the weight of the adsorbent.The data from isotherm measurements were fitted using the Langmuir[28]and Freundlich[29]models. The first one assumes monolayer adsorption on a surface containing a finite number of
0 50 100 150 200 250 300 350 400 450 0 1000 2000 3000 4000 5000 6000 Qe (mg/g) Ce (mg/L) Palygorskite milled in mortar
Palygorskite milled in air jet mill Palygorskite treated in HCl 0.5 M Palygorskite milled in Pulverisette 0
Fig. 5. Adsorption isotherms of Pb(II) at 298 K on modified palygorskite powders.
homogeneous adsorption sites, with no lateral interaction between the adsorbed molecules. While, the Freundlich model suggests a multilayer adsorption on adsorbent.
The Langmuir equation is expressed as follows: Qe= b · Qm·1 + b · CCe
e (8)
where Qm(mg.g− 1) and b (L.mg− 1) are the maximum adsorption capacity and the Langmuir constant, respectively.
The linearized Langmuir equation is written as follows: Ce Qe = Ce Qm+ 1 b · Qm (9)
The constants Qmand b are obtained from slope and intercept of the linear plot of Ce/Qeversus Ce, respectively.
The Freundlich equation is expressed as follows:
Qe= Kf· Ce1/n (10)
The Freundlich constants Kfand 1/n can be determined from the intercept and slope of the linear plot of ln Qeversus ln Ce, respec-tively. Kf is related to adsorption capacity, n is the intensity of adsorption and Ceis the equilibrium concentration of ions (mg.L− 1). The Freundlich model in linear form is given by the following equation:
ln Qe= ln Kf+1nln Ce (11)
4.2. Results and discussion
Adsorption lead isotherms on the four palygorskite samples obtained by grinding processes, in mortar, air jets mill and Pul-verisette0 or by acid treatment are displayed inFig. 5.
All adsorption isotherms obtained with the four palygorskite samples displayed the same shape: in the case of low concentra-tions of Pb(II) in the solution at equilibrium, Ce, a rapid increase in the adsorption capacity, Qe, was observed towards Ce, whereas at high Cevalues, Qetended towards a constant value. The con-stant value indicates the saturation of high energy sites involved in the adsorption process. The values of the isotherm parameters obtained from both linearized Langmuir and Freundlich models, for the adsorption of Pb(II) on modified palygorskite, are gathered in
Table 5.
The correlation coefficients (R2) obtained by applying the linear Langmuir model closer to the unity as compared to those obtained by applying the Freundlich model, means that the adsorption
Table 5
Values of Langmuir and Freundlich isotherm parameters (Qm, b, Kf, n and R2), for the adsorption of Pb(II) on modified palygorskite samples.
Langmuir isotherm model Freundlich isotherm model
Qm(mg.g− 1) b(L.mg− 1) R2 Kf(mg.g− 1) n R2
Milled in mortar 142.8 0.057 0.999 9.64 2.849 0.844 Milled in air jet mill 333.3 0.008 0.997 14.93 2.564 0.946 Milled in Pulverisette0 (60 h) 500.0 0.023 0.998 157.27 8.264 0.748 Treated with HCl (0.5 M) 200.0 0.006 0.996 8.66 2.638 0.919
Table 6
Maximum adsorption capacity Qmtowards Pb(II) for adsorbents of natural origin.
Adsorbent Qm(mg.g− 1) Refs.
Zeolite 70.6 [30]
Active carbon 47.6 [31]
Bioadsorbent 37.5 [13]
Kaolinite 13.3 [32]
Palygorskite (South Africa) 62.1 [1]
Palygorskite (China) 104.3 [33]
process of Pb(II) on palygorskite samples is governed by the Lang-muir isotherm model.
Then, according to the Langmuir isotherm model, the maximum monolayer adsorption capacity, Qm, of palygorskite samples are classified as follows: Qmsample milled in Pulverisette0 > Qm sam-ple milled in air jet mill > Qmsample treated with HCl > Qmsample milled in mortar. Whatever the palygorskite samples, Qmappears to be higher than those obtained in literature for some natural adsorbents under optimal adsorption conditions (Table 6).
Maximum adsorption capacities Qmof the samples under test were compared to different parameters characterizing the parti-cles. For example, the specific surface areas, aN2, of palygorskite samples measured with nitrogen adsorption do not seem to explain the difference in their lead adsorption capacities. The sample milled in Pulverisette0 with the lowest specific surface area (Table 1), has the highest Qm. Previous works[34,35]on the same clay led to opposite results, i.e. the adsorption capacity increased with specific surface area.
The external specific surface area, aext, calculated from the Sauter diameter d32gives us information on the external diffusion of Pb(II) ions towards the particles surface because it determines the number of sites available to lead ions adsorption. This parame-ter can explain the enhanced adsorption capacity of milled samples. Indeed, for milled adsorbents, Qmincreases with increasing aext
Table 7
Cation exchange capacities (CEC) for the four palygorskite powders.
Adsorbents CEC (Meq/100 g) Treated with HCl (0.5 M) 20.45 Milled in mortar 15.11 Milled in air jets mill 25.12 Milled in Pulverisette0 (60 h) 30.11
(Table 1). A large aextmay promote a larger diffusion of Pb(II) ions at the particles surface. But the acid activated sample does not obey this variation because it presents the smallest aextwith a Qmhigher than that of the sample milled in a mortar. If aextcan be linked to Qm, it does not seem to be the only factor involved. Qmcould also be related to the variations of porous volumes. It can reasonably be thought that large pores volume will promote the retention of Pb(II) ions and hence their removal from the solution. Comparing the dif-ferent samples, whatever the porous volume considered (micro, meso or macro), the highest porous volume was observed for the sample treated with hydrochloric acid, despite its lower Qm com-pared to the other adsorbents. Once again, porous volume could not be linked to adsorption capacity.
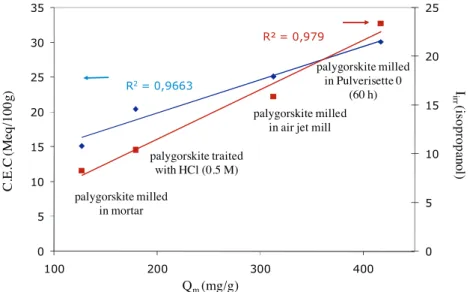
Another parameter characterizing the surface, the cation exchange capacity (CEC) was determined (Table 7). It is a rele-vant indicator of the cations number accessible to ions exchange. The variation of this parameter was compared to those of the irre-versibility index (Iirr) determined by IGC with isopropanol (Table 3). It can be noticed that the two parameters, CEC and Iirrmeasured with isopropanol, increase simultaneously with Qm(Fig. 6).
CEC and Iirr involve specific interactions. Iirrcorresponds to a measurement of hydrogen bond between the isopropanol probe molecule and silanol or aluminol groups on the palygorskite surface (Fig. 7a). These sites contribute in part to CEC (Fig. 7b). Indeed, CEC is a measurement of exchanged cations, which can have two origins:
R2= 0,9663 R² = 0,979 0 5 10 15 20 25 0 5 10 15 20 25 30 35 100 200 300 400
I
irr(is
oprop
ano
l)
C.
E.
C
(M
eq
/1
00
g)
Q
m(mg/g)
palygorskite milledin mortar
palygorskite traited with HCl (0.5 M)
palygorskite milled in air jet mill
palygorskite milled in Pulverisette 0
(60 h)
Fig. 7. (a) Hydrogen bonds between palygorskite surface and isopropanol probe involved in the Iirrdetermined by IGC and (b) electrostatic interactions between palygorskite surface and hydronium.
- Counterions of the negative charges on the palygorskite surface as Fe2+, Al3+contained in the palygorskite structure[36,37]. - The variable charge due to the presence of silanol or aluminol
sites that can bind H3O+ions depending on the pH value. The silanol or aluminol groups, neutral or ionized, seem to be the common factor between the two parameters, CEC and Iirrobtained with isopropanol. The higher the CEC and the Iirr, the more silanol groups there are on the surface increasing its reactivity and its adsorption capacity leading to a higher Qm.
Upon grinding of muscovite, Papirer already observed a corre-lation between CEC and another IGC parameter[38], the dispersive component of the surface energy, !d
s, determined by IGC at infinite dilution. They concluded that the variation of the grinding condi-tions can lead to significant changes of the surface characteristics of muscovite involved in applications like the use of micas as filler for polymers, as mentioned by the authors, or in the adsorption process, the subject of the present work.
It may be thought that grinding in Pulverisette0 contributes to generate silanol sites[16]. These silanol sites can develop hydro-gen interactions with the injected isopropanol, which contributes to increase irreversibility index. Furthermore, in aqueous medium, they can be ionized depending on pH and greatly contribute to enhancement of the lead adsorption capacity also measured by the CEC.
5. Conclusion
The adsorption capacity of palygorskite Qmin contact with a solution of toxic metal ion, lead, was investigated. The adsorbents used were palygorskite powders modified by an acid treatment or different grinding processes.
The adsorption isotherms obtained were consistent with the Langmuir model in the range of lead concentrations studied.
All the adsorbents used exhibited very good adsorption proper-ties towards lead. However, Qmvaried depending on the different samples. It was demonstrated that the type of treatment influ-enced significantly the behaviour of the adsorbents in solution. Specific surface area, porous volumes, or external surface were not the parameters explaining the Qmvariation of the samples. This last one was related to the cation exchange capacity, CEC, and the irreversibility index, Iirr, determined by IGC at finite concentration with the isopropanol probe. Despite the complete disappearance of the fibrous structure, the sample obtained by grinding in the Pul-verisette0 had the highest Qmin correlation with the highest CEC and Iirr probably due to the new sites generated by grinding like silanol groups.
References
[1]J.H. Potgieter, S.S. Potgieter-Vermaak, P.D. Kalibantonga, Heavy metals removal from solution by palygorskite clay, Miner. Eng. 19 (2006) 463–470.
[2]K.K. Zhang, W.H. Cheung, M. Valix, Roles of physical and chemical properties of activated carbon in the adsorption of lead ions, Chemosphere 60 (2005) 1129–1140.
[3]K.G. Bhattacharyya, S.S. Gupta, Adsorption of a few heavy metals on natural and modified kaolinite and montmorillonite: a review, Adv. Colloid Interface Sci. 140 (2008) 114–131.
[4]C. Souza, D. Majuste, M.S.S. Dantas, V.S.T. Ciminelli, Selective adsorption of gold over copper cyanocomplexes on activated carbon, Hydrometallurgy 147–148 (2014) 188–195.
[5]D. Feng, C. Aldrich, H. Tan, Treatment of acid mine water by use of heavy metal precipitation and ion exchange, Miner. Eng. 13 (2000) 623–642.
[6]N. Haddou, M.R. Ghezzar, F. Abdelmalek, S. Ognier, M. Martel, A. Addou, Plas-macatalytic removal of lead acetate assisted by precipitation, Chemosphere 107 (2014) 304–310.
[7]K. Khider, D.E. Akretche, A. Larbot, Purification of water effluent from a milk factory by ultrafiltration using Algerian clay support, Desalination 167 (2004) 147–151.
[8]L.Y. Wang, M.S. Lee, Separation of Zr and Hf from sulfuric acid solutions with amine-based extractants by solvent extraction, Sep. Purif. Technol. 142 (2015) 83–89.
[9]A.K. Zulhairun, A.F. Ismail, The role of layered silicate loadings and their dis-persion states on the gas separation performance of mixed matrix membrane, J. Membr. Sci. 468 (2014) 20–30.
[10]U. Farooq, J.A. Kozinski, M. Ain Khan, M. Athar, Biosorption of heavy metal ions using wheat based biosorbents – a review of the recent literature, Bioresour. Technol. 101 (2010) 5043–5053.
[11]R. Tabaraki, A. Nateghi, S. Ahmady-Asbchin, Biosorption of lead(II) ions on Sargassum ilicifolium: application of response surface methodology, Int. Biode-terior. Biodegrad. 93 (2014) 145–152.
[12]M. Yuan, H. He, L. Xiao, T. Zhong, H. Liu, S. Li, P. Deng, Z. Ye, Y. Jing, Enhancement of Cd phytoextraction by two Amaranthus species with endophytic Rahnella sp. JN27, Chemosphere 103 (2014) 99–104.
[13]S. Qaiser, A.R. Saleemi, M. Umar, Biosorption of lead from aqueous solution by Ficus religiosaleaves: batch and column study, J. Hazard. Mater. 166 (2009) 998–1005.
[14]M. Houari, B. Hamdi, J. Brendle, O. Bouras, J.C. Bollinger, M. Baudu, Dynamic sorption of ionizable organic compounds (IOCs) and xylene from water using geomaterial-modified montmorillonite, J. Hazard. Mater. 147 (2007) 738–745.
[15]L. Boudriche, R. Calvet, B. Hamdi, H. Balard, Effect of acid treatment on surface properties evolution of attapulgite clay: an application of inverse gas chro-matography, Colloids Surf. A: Physicochem. Eng. Aspects 392 (2011) 45–54.
[16]L. Boudriche, A. Chamayou, R. Calvet, B. Hamdi, H. Balard, Influence of different dry milling processes on the properties of an attapulgite clay, contribution of inverse gas chromatography, Powder Technol. 254 (2014) 352–363.
[17]S. Mohammadi-Jam, K.E. Waters, Inverse gas chromatography applications: a review, Adv. Colloid Interface Sci. 212 (2014) 21–44.
[18]W.F. Bradley, The structural scheme of attapulgite, Am. Mineral. 25 (1940) 405–410.
[19]D.A. Mckeown, J.E. Post, E. Etz, Vibrational analysis of palygorskite and sepiolite, Clays Clay Miner. 50 (2002) 667–680.
[20]E. Galan, Properties and applications of palygorskite-sepiolite, Clay Miner. 31 (1996) 443–453.
[21]L. Boudriche, B. Hamdi, Z. Kessaissia, R. Calvet, A. Chamayou, J.A. Dodds, H. Balard, An assessment of the surface properties of milled attapulgite using inverse gas chromatography, Clays Clay Miner. 58 (2010) 143–153.
[22]G.M. Dorris, D.G. Gray, Adsorption spreading pressure and London force inter-actions of hydrocarbons on cellulose and wood fiber surfaces, J. Colloid Interface Sci. 71 (1979) 93–104.
[23]H. Balard, E. Brendlé, E. Papirer, Determination of the acid–base properties of solid surfaces using inverse gas chromatography: advantages and limitations, in: K. Mittal (Ed.), Acid–Base Interactions, Relevance to Adhesion Science and Technology, VSP, Utrecht, The Netherlands, 2000, pp. 299–316.
[24]H. Balard, D. Maafa, A. Santini, J.B. Donnet, Study by inverse gas chromatogra-phy of the surface properties of milled graphites, J. Chromatogr. A 1198–1199 (2008) 173–180.
[25]H. Balard, Estimation of the surface energetic heterogeneity of a solid by inverse gas chromatography, Langmuir 13 (1997) 1260–1269.
[26]W. Rudzinski, J. Jagiello, Y. Grillet, Physical adsorption of gases on heteroge-neous solid surface: evaluation of the adsorption energy distribution from adsorption isotherms and heats of adsorption, J. Colloid Interface Sci. 87 (1982) 478–491.
[27]J.R. Conder, C.L. Young, Physicochemical Measurement by Gas Chromatogra-phy, Wiley Interscience, New York, 1979, pp. 385–390.
[28]I. Langmuir, The adsorption of gases on plane surfaces of glass, mica and plat-inum, J. Am. Chem. Soc. 40 (1918) 1361–1403.
[29]H.M.F. Freundlich, Uber die adsorption in lasungen, Z. Phys. Chem. 57 (1906) 385–470.
[30]R. Shawabkeh, A. Al-Harahsheh, M. Hami, A. Khlaifat, Conversion of oil shale ash into zeolite for cadmium and lead removal from wastewater, Fuel 83 (2004) 981–985.
[31]M.A.P. Cechinel, S.M.A.G.U. de Souza, A.A.U. de Souza, Study of lead(II) adsorp-tion onto activated carbon originating from cow bone, J. Clean. Prod. 65 (2014) 342–349.
[32]M. Al-Harahsheh, R. Shawabkeh, A. Al-Harahsheh, K. Tarawneh, M.M. Batiha, Surface modification and characterization of Jordanian kaolinite: application for lead removal from aqueous solutions, Appl. Surf. Sci. 255 (2009) 8098–8103.
[33]H. Chen, A. Wang, Kinetic and isothermal studies of lead ion adsorption onto palygorskite clay, J. Colloid Interface Sci. 307 (2007) 309–316.
[34]N. Frini-Srasra, E. Srasra, Acid treatment of south Tunisian palygorskite: removal of Cd(II) from aqueous and phosphoric acid solutions, Desalination 250 (2010) 26–34.
[35]M. Shirvani, M. Kalbasi, H. Shariatmadari, F. Nourbakhsh, B. Najafi, Sorption–desorption of cadmium in aqueous palygorskite, sepiolite, and calcite suspensions: isotherm hysteresis, Chemosphere 65 (2006) 2178–2184.
[36]A. Chahi, S. Petit, A. Decarreau, Infrared evidence of dioctahedral-trioctahedral site occupancy in palygorskite, Clays Clay Miner. 50 (2002) 306–313.
[37]M. Suarez, E. Garcia-Romero, FTIR spectroscopic study of palygorskite: influ-ence of the composition of the octahedral sheet, Appl. Clay Sci. 31 (2006) 154–163.
[38]E. Papirer, P. Roland, M. Nardin, H. Balard, Variation of the surface energy char-acteristics of mica muscovite upon grinding, J. Colloid Interface Sci. 113 (1986) 62–66.
![Fig. 1. (a) Crystal structure of palygorskite “from Galan [20, Fig. 1]. Reproduced with kind permission of the Mineralogical Society, publisher of Clay Minerals” and (b) its polyhedral representation “from McKeown et al](https://thumb-eu.123doks.com/thumbv2/123doknet/11602677.299619/4.892.188.722.112.371/structure-palygorskite-reproduced-permission-mineralogical-publisher-polyhedral-representation.webp)