A
TL-TILECAL-PROC-2015-019
17/11/2015
Upgrade of the Laser Calibration System of the Atlas
Hadron Calorimeter
Ph. Gris, on behalf of the ATLAS Tile Calorimeter System
Abstract–The new laser calibration scheme of the ATLAS Tilecalorimeter is presented with a focus on improvements of three critical aspects (optics, calibration, electronics). The resulting performance in terms of stability is also indicated.
I. INTRODUCTION
HE Tile Calorimeter (TileCal) [1] is the barrel and endcap hadronic sampling calorimeter of the ATLAS experiment at the CERN LHC. It uses plastic scintillator as active material and low-carbon steel (iron) as absorber. Wavelength shifting fibers connected to the tiles collect the produced light and are readout by photomultiplier tubes (PMTs). PMT response drift is one of the main sources of systematic uncertainty in estimating the calorimeter energy scale: a continuous, percent-level calibration of each cell is then required to maintain the overall performance within 4%.
To achieve this goal, a redundant calibration scheme is operated (Fig. 1). A survey of the entire acquisition chain (from the plastic scintillator to the digital signal) is performed thanks to a moving radioactive Cesium source inside the detector, and a charge injection system which is used to follow the stability of the front-end electronics. The laser system monitors both the PMTs and the front-end electronics. Light pulses similar to those produced by ionizing particles are transmitted simultaneously to all TileCal PMTs through a bunch of ~100 meter long clear fibers. The light injected is measured by a set of photodiodes.
Fig. 1 : Scheme of the TileCal calibration system.
II. DESIGN OF THE NEW LASER SYSTEM
The laser system has been upgraded for 2015 LHC run with the goal to monitor signal stability at the sub-percent level. Its main components include (Fig. 2) :
Manuscript received November,xx 2015. This work was supported in part by by the CERN, European Organization for Nuclear Research, Switzerland, by the Centre National de la Recherche Scientifique (CNRS), France, by the Instituto Nazioanle di Fisica Nucleare (INFN), Italy, and by the Laboratorio de Instrumentacao e fisica experimental de Particulas (LIP) , Portugal.
Ph. Gris is with the Laboratoire de Physique Corpusculaire (IN2P3/CNRS) of Clermont-Ferrand, Campus des Cézeeaux, 24 avenue des Landais, BP 80026, 63171 Aubière Cedex (gris@clermont.in2p3.fr).
1. The optics box : houses the main optical elements of the system (laser head, filter wheel, beam expanders, optics fibers). The light issued by the beam expanders is transmitted to a set of ten photodiodes measuring the light intensity at three points of the laser light path (ouput of the laser head, after the filter wheel, after the beam expander).
2. The photodiode box : composed of ten modules (referred to as "K7") containing each a photodiode and its preamplifier.
3. The PMT box : contains two PMTs that are used to trigger the acquisition when the laser is flashing.
4. The PHOtodiode CALibration (PHOCAL)
system : used to monitor the response of the photodiodes.
5. The VME crate : houses two cards : a VME processor (to communicate with ATLAS) and a special board used to drive the laser system. Many improvements with respect to the previous laser system have been realized. They concern three critical points : the laser light distribution, the internal calibration system, and the electronics.
Fig. 2: Scheme of the new Laser system.
The laser light distributing scheme has been re-designed to improve its stability. A new setup of end-line beam expander has been inserted so as to improve light mixing and
P M T P M T Box L I C P M T L I C M O T L I C P H D C H A R I N J K7 K7 K7 K7 K7 K7 K7 K7 K7K7 K7 amppre + amppre + amppre + amppre + amppre + amppre + amppre + amppre + amppre + amppre + P R O C L A S C A R Light Mixer Beam Expander ~ 400 fibers Filter Wheel LightMixer L A S E R Filters Filters +preamp source PHOCAL VME Crate POLAS Power Supplies LED LASER pump TTC (Triggers, Trigger type, LHC Clock)
SHAFT (TileCal) ATLAS DAQ
PMT Box
Shutter
LASCAR= qADC + SLAMA + LASTROD+LILAS
LOCAL DCS Ethernet Switch Optics Box
T
transmission and to reduce sensitivity to misalignment effects. The optics box is now installed in an horizontal position (it was in a vertical position in the previous laser system) thanks to a more compact arrangement of the optic components. This configuration should allow a decrease of the amount of dust on the optical elements and should improve ease of maintenance. The sensitivity to vibrations has also been reduced.
A new internal calibration scheme has been developed to cope with the increase of the number of photodiodes used to monitor the laser light. A LED signal is generated in the PHOCAL system and transmitted to the ten photodiodes (that are used to measure the laser signal) and to a reference photodiode (located in the PHOCAL box) through optical fibers. The stability of the photodiodes may be estimated by studying the LED signal received by the ten photodiodes normalized to the one measured by the reference photodiode. The response of the reference photodiode is monitored with a static radioactive source.
Fig. 3 : Picture of the LASCAR board. The main components (digitization, charge injection, interface with LHC and ATLAS TDAQ) are indicated.
Innovative electronics has been designed to drive the system, perform signal digitization, and communicate with LHC. The LASer Calibration Rod (LASCAR) card (Fig. 3) is a new VME board integrating all control, timing and readout functionalities : analog-to-digital conversion through 32 channels of 14-bits (2000 pC full scale) charge ADC, charge injection part to monitor the stability of the photodiode electronics, time response measurement of the laser using a TDC, interfaces with ATLAS TDAQ and with the laser pump. The dynamic range of the electronics has been increased to avoid saturation for higher laser intensity.
III. PERFORMANCE OF THE NEW LASER SYSTEM
The laser upgraded system was installed on October 2014 and has been used on a regular basis since then. During collision runs, laser pulses are emitted every second (in empty bunch-crossings). Internal calibration runs are performed twice a week. Performance of the new laser system may be
expressed in terms of stability both for the internal calibration system and for the PMTs of the TileCal.
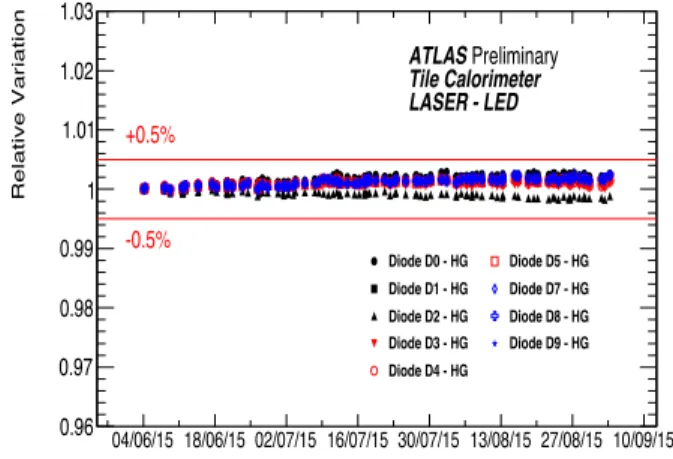
Three aspects of the internal calibration system may be monitored: the electronics, by studying the pedestal stability and the response to the charge injection; the ten photodiodes, by analyzing the LED signal normalized to the reference photodiode one; the reference photodiode, by quantifying how its response is stable with respect to the radioactive source emission. A RMS variation response at the sub-percent level is observed for electronics and photodiodes over a three-months period (see Fig. 4 for an illustration of results with respect to LED signal). These results make us confident about the possibility for using the photodiodes as reliable monitors.
Fig. 4 : Stability of the photodiodes (LED signal) over a three-month period.
The behaviour of the PMTs of the TileCal is checked with laser runs performed twice a week between Cesium scans (done on a monthly basis). Over a four-month period, a RMS variation lower than one percent is observed for the response of internal monitors. If TileCal PMTs laser outputs are normalized to the signal of a monitor photodiode so as to integrate pulse-to-pulse fluctuations, a RMS value of 0.2% of the distribution of the variation of the PMT responses is observed.
IV. CONCLUSIONS
The laser system is a centerpiece of the calibration scheme of the ATLAS Tile calorimeter. A new setup has been designed, built and installed to monitor the response of the TileCal PMTs. Improvements to critical parts of the system (light distribution, internal calibration, electronics) have led to stability results at the sub-percent level [2]. This performance is compatible with expectation.
REFERENCES
[1] ATLAS Tile Calorimeter Community, “The Optical Instrumentation of the ATLAS Tile Calorimeter”, Journal of Instrumentation, Volume 8, January 2013. [2] https://twiki.cern.ch/twiki/bin/view/AtlasPublic/ApprovedPlotsTileCalib ration. Time [dd/mm/yy] 04/06/15 18/06/15 02/07/15 16/07/15 30/07/15 13/08/15 27/08/15 10/09/15 Relative Variation 0.96 0.97 0.98 0.99 1 1.01 1.02 1.03 Diode D0 - HG Diode D1 - HG Diode D2 - HG Diode D3 - HG Diode D4 - HG Diode D5 - HG Diode D7 - HG Diode D8 - HG Diode D9 - HG +0.5% -0.5% ATLAS Preliminary Tile Calorimeter LASER - LED