HAL Id: insu-00338893
https://hal-insu.archives-ouvertes.fr/insu-00338893
Submitted on 14 Nov 2008HAL is a multi-disciplinary open access
archive for the deposit and dissemination of sci-entific research documents, whether they are pub-lished or not. The documents may come from teaching and research institutions in France or abroad, or from public or private research centers.
L’archive ouverte pluridisciplinaire HAL, est destinée au dépôt et à la diffusion de documents scientifiques de niveau recherche, publiés ou non, émanant des établissements d’enseignement et de recherche français ou étrangers, des laboratoires publics ou privés.
Compartmentalization of physical and chemical
properties in hard-rock aquifers deduced from chemical
and groundwater age analyses
Virginie Ayraud, Luc Aquilina, Thierry Labasque, Hélène Pauwels, Jérôme
Molenat, Anne-Catherine Pierson-Wickmann, Véronique Durand, Olivier
Bour, Corinne Tarits, Pierre Le Corre, et al.
To cite this version:
Virginie Ayraud, Luc Aquilina, Thierry Labasque, Hélène Pauwels, Jérôme Molenat, et al.. Com-partmentalization of physical and chemical properties in hard-rock aquifers deduced from chem-ical and groundwater age analyses. Applied Geochemistry, Elsevier, 2008, 23 (9), pp.2686-2707. �10.1016/j.apgeochem.2008.06.001�. �insu-00338893�
Compartmentalization of physical and chemical properties in hard rock
aquifers deduced from chemical and groundwater age analyses
Virginie AYRAUD
a,b,g, Luc AQUILINA*
a,g, Thierry LABASQUE
a,g, Hélène PAUWELS
b,
Jérôme MOLENAT
c,g, Anne-Catherine PIERSON-WICKMANN
a,g, Véronique DURAND
d,
Olivier BOUR
a,g, Corinne TARITS
e,g, Pierre LE CORRE
e,g, Elise FOURRE
f, Philippe
MEROT
c,gand Philippe DAVY
a,ga
CAREN - Géosciences, UMR 6118 Université Rennes1-CNRS, Rennes, France. b
BRGM Water Department, Orléans cedex, France. c
CAREN - Sol Agronomie Spatialisation, UMR INRA-Agrocampus, Rennes, France. . d
UMR Sisyphe, université Paris IV-CNRS, Paris. e
IUEM – Domaines Océaniques, UMR 6538 Université de Bretagne Occidentale-CNRS, Brest, France f
LSCE, UMR 1572 CEA-CNRS, Gif sur Yvette, France. g
Université Européenne de Bretagne (European University of Brittany).
Abstract
Using groundwater age determination through CFC analysis and geochemical data from 7 sites in Brittany (France) a hydro-geochemical model for hard rock aquifers is presented. According to the geological structure 3 zones can be defined: the weathered layer, about 30m thick; the weathered-fissured layer (fractured rock with a high density of fissures induced by weathering) which represents a transition zone between the weathered zone and the lower fractured and unweathered part of the aquifer. (1) The weathered layer (alterites) is often considered as a porous medium and is frequently the only part used in hard rock aquifers. Recent apparent ages (0 to 10 a) are observed in the groundwater fluctuation zone in a thin layer from 1-2 m-thick in the lower parts, to 10-15 m-thick in the upper parts of the catchments. Below this thin layer, the groundwater apparent age is high (between 10 and 25 a) and unexpectedly homogeneous at the regional scale. This groundwater apparent age contrast, which also corresponds to a Cl- concentration contrast, is attributed to rapid lateral transfers in the fluctuation zone which limit water transfer to the underlying weathered zone. Groundwater chemistry is characterized by NO3- and Cl- concentrations related to land uses (high in agricultural areas, low in preserved ones). (2) At the interface between the weathered and the weathered-fissured layers a strong biogeochemical reactivity is observed. Autotrophic denitrification is enhanced by a higher availability of sulfides. (3) Under this interface, in the weathered-fissured layer and the underlying fractured deep part of the aquifer, groundwater apparent age is clearly correlated to depth. The vertical groundwater velocity is estimated to be 3 m/a whatever the site which seems to indicate a regional topographic control on groundwater circulation in the deep part of the aquifer. In this deep part groundwater chemistry is modifed by water-rock interaction processes as indicated by Ca and Na concentration, and a slight water contribution (from 0.1 to 0.65%) in the sites close to the sea-coast. One site inland shows a saline and old end-member. The global hydrogeochemical scheme is modified when the aquifer is pumped at a high rate in the fissured-weathered and/or the fractured layer. The increase in water velocity leads to a homogeneous groundwater apparent age whatever the depth in the weathered-fissured and fractured layers.
1. Introduction
Hard rock formations (composed of igneous and metamorphic rocks) cover more than 20% of the present continental surface. They are located in large shield areas and in the cores of mountain ranges. Groundwater from hard-rock aquifers constitutes a water resource that is important but vulnerable to pollution. In Europe, as a consequence of their relatively poor productivity, these aquifers are presently under-exploited. Their use is however increasing, in response to the increase of the water demand and degradation of the surface river-water quality. In developing countries with semi-arid and arid climates, groundwater constitutes the only available resource. There are various sources of groundwater contamination which may have important consequences on the population’s health. However, even if anthropogenic activities could led to a high degree of pollution of shallow groundwaters, recent studies have demonstrated that these aquifers can represent a major water resource that has not been fully investigated yet (Krasny and Hrkal, 2003; Oenema et al., 2004; Struckmeier et al., 2004; Tilman et al., 2002).
The structure of hard-rock aquifers is complex. Due to a decreasing weathering intensity from surface to depth, hard rock aquifers are divided into 3 major zones (Aquilina et al., 2004; Berkowitz, 2002; Bonnet et al., 2001; Durand et al., 2006; Maréchal et al., 2004; Mazurek et al., 1996; Taylor and Howard, 2000; Van der Hoven et al., 2005; Wyns et al., 2004). (1) The unconsolidated saprolite, called weathered layer, is a capacitive layer and mostly ensures the storage function of the aquifer. In eroded areas, the thickness of this layer can be drastically reduced. (2) The underlying weathered-fissured zone (also called weathered-fractured by other authors) shows a lesser degree of weathering and ensures the transmissive function of the aquifer. In this layer, the first few meters are characterized by dense horizontal fissuring and this fracture density decreases with depth. Nevertheless, recent studies have demonstrated that the homogeneous hydrogeological properties of the water reservoir can be defined for the overall weathered-fissured horizon (Maréchal et al., 2003, 2004, 2006). (3) Finally, the deep fractured part corresponds to the fresh and fractured rock where the main permeability is related to tectonic fractures. The transition between the two latter parts (weathered-fissured and fractured) is gradual and thus not easy to locate accurately. Consequently, these two parts are often considered as a whole in the present study.
A major hydrogeological division exists between the weathered layer on the one hand and the weathered-fissured layer and the fresh, fractured rock on the other hand. The weathered layer can be considered as a porous medium. The occurrence of fissures in the weathered-fissured layer and the deep fractured part favors preferential fluxes and can be represented as a dual porosity system. In the fractured medium however, the water reservoir properties will depend on fissure and fracture connection and distribution. Assessing precise characteristics (volume, thickness, watershed area …) of this type of aquifer is difficult and determining
hydrogeological equivalent properties, at different scales constitutes an important research domain (Berkowitz, 2002; Cook et al., 2005; Neuman, 2005; Voss, 2005).
Groundwater apparent ages in a hard-rock context are poorly constrained and a wide range from 0 to 140 a has been proposed (Mazurek et al., 1996). However, groundwater apparent age determination is a key parameter to understand the hydrochemical functioning of aquifers, pollution transfer, mixing processes and relationships between surface water and groundwater (Cook et al., 2005; McGuire et al., 2005; Modica et al., 1998; Rademacher et al., 2001; Toth and Katz, 2006). It is particularly important to define the response lag time of an aquifer to diffuse pollution so as to set up appropriate and realistic remediation strategies. Furthermore, only a few investigations in hard-rock aquifers have been carried out to address a detailed combined characterization of groundwater chemistry and age (Aeschbach-Hertig et al., 1998 ; Bockgard et al., 2004; Cook and Simmons, 2000; Plummer et al., 2001).
The purpose of this paper is to investigate the hydrogeochemical properties of the different compartments of hard rock aquifers. The different sites investigated allowed the different compartments to be investigated independently. The hydrogeological properties are investigated using the groundwater apparent age determination. The hydrochemical characteristics are then compared to the groundwater apparent age spatial distribution in the different compartments. The goal is to determine potential regional hydrogeological and hydrogeochemical characteristics. To reach an overall overview, the discussion is based on a data set of analyses of waters collected in 7 sites distributed around Brittany (France), a 27,000 km2 region mainly composed of hard-rock aquifers with various geological contexts. This area is also characterized by intensive agricultural activities which lead to contaminant diffusion in the different parts of the hard-rock aquifers.
Figure 1: Brittany’s topography and major faults.
Letters correspond to each site. From west to east: Kerbernez (K), Hanvec (H), Ploemeur (P), Naizin (N), Arguenon (A), Pleine-Fougères (F) and Betton (B)
2. Geology and hydrogeology of the studied sites
In order to investigate all depth profiles and the influence of the geological context, water geochemistry and groundwater transfer times were determined in 7
sites in hard rock aquifers located all around Brittany (France) (Fig. 1 and Table 1). The geology of Brittany is complex and usually 3 domains are defined between the two main shear zones (Bernard-Griffiths et al., 1985). The northern part of Brittany is a crystalline basement affected by Cadomian plutonism and tectono-metamorphic events (600-540 Ma). The central domain is composed of Brioverian (600-700 Ma) to Carboniferous sedimentary rocks modified by a low-grade Hercynian metamorphism. The southern domain is a Hercynian high-grade metamorphic belt containing schists, gneisses and granites. These rocks have recorded tectono-metamorphic events from Ordovician to late Carboniferous with a major tectonic phase during the Siluro-Devonian (435-355 Ma).
The study sites are located in various topographic and geological contexts (Table 1), they also facilitate depth investigation (see Table 1 for the well depth range). Kerbernez, Naizin and Pleine-Fougères are experimental catchments where scientists investigate the impact of intensive agriculture on groundwater chemistry at rather shallow depth (2 to 20 m). All the wells have a screened interval which ranges from 1 to 2 m. Kerbernez is a first-order catchment in a granitic area (in contrast to Naizin and Pleine-Fougères where the lithology is schist) devoted to investigation of recharge processes (Legout et al., 2007; Martin et al., 2004; Ruiz et al., 2002). All the sampled wells (except B4 and F4 in the mid-slope and A1b in the wetland) are located in the highest topographic areas where recharge occurs. The wells in these 3 catchments are shallow (maximum depth 30 m) and sample the weathered layer. All wells (except Pz4) in the Naizin catchment are shallow too but, as the weathered layer is inexistent at this site, they directly reach the weathered-fissured layer (Molénat et al., 2002; Pauwels et al., 1998, 2000). Pleine-Fougères is characterized by a large wetland and a confined aquifer, which both influence water hydrogeology (artesianism) and chemistry (mixing) (Clément et al., 2003; Négrel and Pauwels, 2004).
Figure 2: Well design along a hydrogeological section in the Kerbernez catchment
Ploemeur and Betton are two aquifers pumped for tap water production. In these two sites, short wells characterize the weathered layer at shallow depth (< 35 m) and deep wells (70 to 110 m) characterize the deep part of these aquifers. These wells are screened over the whole length below 30 m. The Ploemeur area is characterized by a high-rate production (up to 1.106 m3/a, the production well has not been sampled, but well F11 is close to the pumping well) in a complex geology with a flat lying contact between granite and micaschist (Le Borgne et al., 2004; Tarits et al., 2006; Touchard, 1999). Most of the boreholes intersect the weathered-fissured layer and the deep fractured part but 3 wells have been drilled in the weathered layer (MF1, MF2 and F36). The Ploemeur site is divided into two sub-sites: the pumping zone, Kermadoye, and a non–influenced zone, Loyan located 4 km away from the water plant of Kermadoye (these two sub sites will be called Ploemeur-Kermadoye and Ploemeur-Loyan in the next sections). The pumping rate at Betton is lower (1.105 m3/a; deep pumping well is F1, Pz3 is close to the surface pumping) and the aquifer develops in almost homogeneous schists (Ayraud et al., 2006). Brackish water (Cl- concentration up to 700 mg/L in) has been encountered there in deep boreholes (more than 50 m) (Ayraud, 2006). The shallowest wells (less than 13m in depth) are at the interface between the weathered and the weathered-fissured layers (except Pz1 which is clearly in the weathered layer).
Hanvec (LeRoux-Roignant, 2004) is an observation site that will be used for tap water production in the future. The geology is composed of schist. The weathered layer does not seem to be sampled by the shallow (near 10 m in depth) boreholes.
The wells sampled at Arguenon are observation wells for the survey of a water reservoir in a gneissic basement used in a mineral water plant (Durand, 2005; Durand et al., 2006). The well density allows sampling of the weathered layer as well as of the weathered-fissured layer. In these two last sites the well design is similar to the Ploemeur and Betton one.
The Ploemeur, Kerbernez and Betton sites belong to a national observatory (National observatory INSU-CNRS), which provides long-term monitoring of the hydrogeological parameters, temperatures, conductivity and chemical composition of the sites (http://hplus.ore.fr/; http://www.caren.univ-rennes1.fr/ORE-AgrHys/).
Permeabilities have been measured in the Kerbernez, Ploemeur and Pleine-Fougères sites (Clément et al., 2003; Le Borgne et al., 2004; Martin et al., 2006). In the weathered part of the aquifers, permeabilities vary in the range 3 10-6 to 10-4 ms-1. In the deeper fractured part, permeabilities in the water inflow sections range from 10-6 to 2 10-5 ms-1.
Nitrate concentrations in shallow groundwater (10-20 m) are directly related to land uses, with higher NO3- concentrations (> 50 mg/L) in sites with intensive agriculture (Kerbernez, Naizin, Betton and PF12 at Pleine-fougères) than in protected areas (< 20 mg/L such as most wells at the Arguenon site). At all sites, denitrification processes have been demonstrated and explain the NO3- concentration variation within a site (Ayraud et al., 2006; Clément et al., 2003; Durand, 2005;
Martin et al., 2004; Pauwels et al., 2000; Pauwels and Talbo, 2004; Tarits et al., 2006). Due to Fe-silicate and sulfide minerals present in crystalline rocks along with low C contents, as soon as water has left the soil, NO3 -reduction is coupled to sulfide oxidation through an autotrophic denitrification process according to the following equation (either S (1) or Fe (2) atoms in pyrite can be oxidized) (Kölle et al., 1985; Nordstrom and Southam, 1997): + +
→
+
+
+
+
+
2 2 -2 4 2 -32
14NO
4H
7N
10SO
2H
O
5Fe
5FeS
(1) ++
+
+
→
+
+
30NO
20H
O
10Fe(OH)
20
SO
15N
10H
10FeS
2 -3 2 3 24- 2 (2)The deepest wells sampled (more than 25 m in depth) have low NO3- concentrations whatever the site, except at Ploemeur-Kermadoye where the pumping clearly affects the groundwater chemistry (Tarits et al., 2006). No evidence has been provided by previous studies that denitrification occurs in these deep groundwaters.
3. Sampling and analytical methods
3.1. Sample collection and geochemical analyses
The sampling for groundwater age determination and geochemical analyses was carried out during the 2004-2005 winter, but the lack of significant rainfall over the previous summer had caused low piezometric levels. Ten samples were also collected a few months later (04-06) in the Kerbernez site, during a high water period. Water was sampled after pumping for one day before using a two-holed automatic groundwater sampler (open tube that can be closed at a determined depth based on the Niskin® bottle principle - Ayraud, 2006), except for pumped wells (at Betton F1 and C1, sampled at pump tap). The vertical precision of the sampling method has been tested; it allows chemical variations at the scale of several meters to be observed. As far as possible, chemical logging of the wells was carried out before sampling and specific levels corresponding to water influxes were selected. When different fractures producing different fluids were intersected, each of them was sampled (e.g. F28 well in Ploemeur-Kermadoye). Water for groundwater age determination was collected from the sampler immediately after well sampling, washing through at least 3 volumes of the glass ampoule before closing it. No contact with air was allowed during sampling. Potential air contamination was also checked 1) by repeated sampling in well F28 which has varying vertical concentrations, and 2) by repeated analyses in the lower part of Pz7 well which has CFC concentrations below detection limit (see Table 3). Conductivity, pH and Eh were measured directly in the field. A Combined SenTix 50 electrode calibrated with WTW standards was used for pH. Redox potential was measured using a Pt Ag/AgCl electrode (Mettler Pt 4805). Dissolved O2 data have been measured using a field O2 probe. They typically range between 1 and 6 mg/L, however, no clear relationship between depth or NO3 concentrations has been observed. For anion and cation analyses, the water was filtered through a 0.2 µm cellulose acetate mesh sieve and stored in PTFE bottles, rinsed twice with
bi-distilled acid and then with ultrapure water. Bottles for cation analysis were acidified with 7 N ultrapure HNO3. All bottles were stored at 4°C in the dark and were analyzed within a week for anions. Nitrate, Cl-, and SO42- were analyzed using ion chromatography (Dionex DX-100). Calcium, Na+, Mg2+ and K+ were measured using an ICP-MS HP 4500 following laboratory standard methods (Bouhnik-Le Coz et al., 2001; Yeghicheyan et al., 2002). The analytical uncertainty was about 5% for major anions and cations. All analyses were performed at the Geosciences Rennes Laboratory.
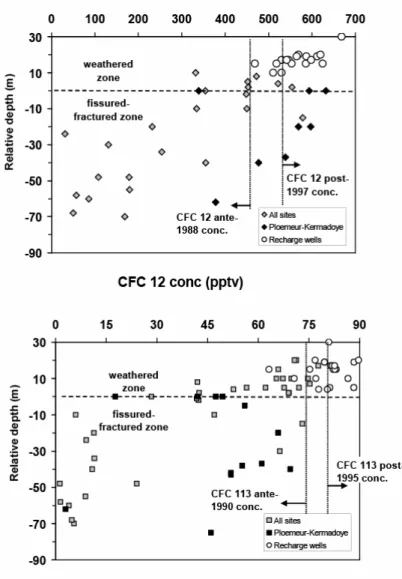
Figure 3: CFC 12 and CFC 113 concentrations versus relative depth
3.2. CFC analyses and groundwater age determination
Developed in the 1930s, chlorofluorocarbons (CFCs) are man-made compounds used as refrigerants, solvents, propellants and blowing agents (Plummer and Busenberg, 2000). Their atmospheric accumulation has been well documented for the past 50 a, and their concentration has increased linearly from 1960 to 1990. For this period, the annual variation is higher than uncertainty and to a CFC atmospheric composition corresponds only one year. The principle of groundwater age dating with CFCs is to calculate a CFC atmospheric concentration from the CFC concentration in water in order to deduce the year that the water was last in
equilibrium with the atmosphere (see Plummer and Busenberg, 2000 and Höhener et al., 2003 for a review).
The CFC analytical methodology was adapted from Pruvost et al., 1999. Groundwater CFC concentrations were obtained by degassing water samples by N2 stripping. Gases were trapped in a stainless-steel tube filled with Porasil C and maintained at -100°C in an ethanol bath. After 15 min of preconcentration, the gases were injected into a gas chromatograph equipped with an electron capture detector (GC-ECD) by immersing the trap into boiling water. The CFC concentration obtained by chromatographic analysis was converted to atmospheric mixing ratio (pptv) through a solubility function (modified Henry’s Law for trace gases – Bu and Warner, 1995; Warner and Weiss, 1985; Weiss and Price, 1980):
F
x
C
*=
'.
(3)C* = concentration of the gas in water in mol.L-1 x’ = atmospheric mixing ratio of the gas in pptv
F = solubility function in mol.L-1.atm-1 dependent on temperature and salinity
Recharge temperature has been precisely measured in all the sites during the sampling campaign. Furthermore, in the national observatory sites (Ploemeur, Naizin, Kerbernez, Betton) and in the Pleine-Fougères site also, long-term monitoring provides a good information of the recharge temperature. According to field data, the recharge temperature for the calculation of the solubility function is 12°C. Excess air has been deduced from Ar, Ne and N2 measurements (Labasque et al., 2006) but, due to the high solubility of CFC, this only induces a small variation of the groundwater age (< 1 a). With a conductivity below 600 µS for all samples (except Pz6), the impact of salinity is considered to be negligible (calculations indicated that it is still negligible for Pz6). The CFC atmospheric mixing ratios obtained were compared to the atmospheric evolution curve (Walker et al., 2000) to determine the year of recharge, and thus the groundwater apparent age.
The analytical uncertainty of the method has been determined through the analysis of 10 samples pumped rapidly from a borehole, and analysed with the analytical system. For CFC-12, the average value measured is 1.44 pmol/L, with an uncertainty ((t*s)/n1/2)) of +/-0.12 pmol/L. The uncertainties are 0.13 pmol/L for CFC-11 and 0.03 pmol/L for CFC-CFC-113 (Labasque et al., 2006). At 12°C recharge temperature, the CFC-12 value indicates equivalent atmosphere concentration of 289.7 pptv, with an uncertainty of 26.1 pptv. Thus the uncertainty for CFC-12 groundwater age determination is 1978.7 +/-1.6a. The uncertainty is +/-0.8a for CFC-11 and 1.6a for CFC-113 (Table 2). These low uncertainties allow an accurate determination of the groundwater recharge date before 1990 whereas the stabilization of atmospheric concentrations of CFCs since that time makes age dating more difficult (see groundwater apparent age determination section). Three CFCs were analyzed in this study, which gave 3 independent recharge dates for each sample. Contamination or degradation of one or two CFCs is highlighted by the
intercomparison between the 3 recharge dates obtained. The apparent water recharge date is the average value of the recharge dates obtained through the different CFCs without taking into account the dates for which a contamination or a degradation of CFCs is suspected.
Two hundred and fifty samples were analyzed for the 3 CFCs in the Geosciences Laboratory (Rennes - France), and 70% of the groundwater samples were dated with at least 2 CFCs (which exhibited no contamination or degradation) (Table 3). For these samples, the observed mean standard deviation of recharge dates was 1.7a. The global uncertainty on age, including sampling, analysis, selection of the recharge temperature using Henry’s law and dispersion-adsorption effects, was estimated to be +/- 2a from these results. Nevertheless, the groundwater age obtained by CFC analyses may differ from the true mean groundwater age in the case of mixing processes (Katz et al., 2004; Weissmann et al., 2002) and the term ‘apparent age’ is used throughout the paper. Such mixing effects may be effective at different scales but the sampling methodology allowed potential contribution zones in the wells to be selected. The most common contamination of groundwater with CFCs observed in Brittany is that with CFC-12 (Ayraud, 2006). As denitrifiers can degrade CFC-11 (Höhener et al., 2003; Semprini et al., 1992), and as denitrification is a common process, the application of CFC-11 data for age determination requires precautions.
Twelve samples have also been analysed using the 3
H-He method since intercomparison is useful (Ekwurzel et al., 1994; Reilly et al., 1994). The 3He, 4He and 20Ne isotopes were measured in the Climate & Environment Sciences laboratory (LSCE, CNRS-CEA) on a mass spectrometer in order to determine the tritiogenic 3He and correct the measurement for excess air and radiogenic contribution (Table 4). 3He was also determined on a degassed sample after a 6-month period in order to determine the 3H content (Table 4). An age could not be determined on two samples and one sample could not be analyzed for CFC, thus the CFC to 3He-3H comparison (see Fig. 4) is only based on 9 points.
Figure 4: Tritium-Helium apparent ages versus CFC apparent ages (Ploemeur aquifer)
3.4. Well network and relative depth
The wells in each site have been designed to address a specific research question. In the Ploemeur-Kermadoye, Ploemeur-Loyan, Betton, Arguenon and Hanvec sites, they have been drilled in order to monitor the aquifer evolution and the wells are relatively deep. In the Pleine-Fougères site they have been located in a wetland, at shallow depth, in the lower part of the catchment. In the Naizin and, Kerbernez sites, the wells are scientific wells which allow the weathered zone of the catchment to be investigated. Furthermore, the H, J and L wells in the Kerbernez site have been drilled in the framework of a CNRS project devoted to the unsaturated zone investigation. The design of the Kerbernez wells is shown in Figure 2. Further in the text, the wells which sample the water-table variation zone (or variably saturated zone) are interpreted as representing the ‘recharge zone’. In this case, it does not mean that recharge does not occur in other places, but that these wells sample the water which is characteristic of the final recharge process. As can be seen in Figure 2, the ‘recharge wells’ can not be determined directly from the depth below the soil or the relative depth to the weathered/weathered-fissured interface. In order to investigate the potential hydrogeochemical compartimentalization of the hard rock aquifers, the geological context of each aquifer has been used in order to determine the location of each well as regards the weathered and/or fissured/fractured zone. Their attribution is presented in Table 3. However, 3 wells in the Pleine-Fougères site and one in the Kerbernez site, although close to the surface, are interpreted as representing water originating from the fractured zone which is collected in the discharge part of the aquifer (Fig. 2). Although, the geological context is different from the usual models in porous media, the interpretation is strengthened by i) artesianism which clearly indicates that the waters have a relatively deep origin, and ii) a chemical composition, which differ from the wells in the weathered zone (Clément et al., 2003). These wells are indicated as ‘mixing’ in Table 3. The hydrogeological context has also been used to indicate specific wells which intersect the water-table variation zone (Fig. 2). These wells represent mainly the H, J and L wells in Kerbernez, the Pk wells in the Naizin site (with potential mixing in the Pk3 and Pk6 wells) and, with a lesser degree of confidence, the Hpz wells in the Arguenon site which differs from the other wells in this site with water levels close to the surface, a thin weathered zone and different recharge origin (Durand, 2005; Durand et al., 2006). The well compartment (recharge, weathered, fissured/fractured or mixing) is indicated in Table 3.
In order to investigate the influence of the weathering profile on the groundwater chemistry and apparent age, and to compare the different aquifers, a relative depth has been estimated. The relative depth corresponds to the distance between the sampling depth and the weathered/weathered-fissured interface (similar to the IWF defined by Durand et al., 2006). The depth of the interface between the weathered and the weathered-fissured layers has been determined per site or for each point using information provided during borehole
drilling (cuttings) or by geophysical data (magnetic resonance soundings). The uncertainty in the accurate localization of the interface (i.e. the top of the weathered-fissured layer) has been estimated to be +/-4 m and is represented by a transition zone in the figures. The relative depth for each well is indicated in Table 3: positive values indicate sampling in the weathered layer while negative values correspond to sampling in the weathered-fissured layer or even in the fresh and fractured rock, as discrimination between these two parts is difficult (gradual transition).
Figure 5: Chloride concentrations versus apparent CFC ages in the recharge zone and the weathered zone
4. Results
4.1. Groundwater apparent age determination
The groundwater age is determined from the gas concentration in air at equilibrium with the gas concentration measured in water. The air concentrations are from NOAA data but potential local contaminations have been checked. Bimensual air measurements have been carried out in the Rennes laboratory (close to one of the sites). Air samples were also taken in some of the sites and, when possible, local open systems such as lakes or ponds have been sampled in order to check local CFC ratio variations. No regional or local departure from the atmospheric ratios was observed during the course of the study (2004-2006). The equivalent concentration (pptv) is presented in Figure 3 vs the relative depth. A clear concentration increase is observed from the deepest depth towards surface. Due to the CFC atmospheric flattening, the apparent age determination is made more difficult during the 1990-2005 period. Two different cases have been distinguished for the concentrations corresponding to this period.
(1) The concentrations which correspond to atmospheric concentrations before 1990-1995 lead to a quite precise age. This age is further confirmed by the 3
H-He measurements. Nine samples can be compared to CFC determinations in the fractured zone of the Ploemeur aquifer (Fig. 4). The CFC vs 3He-3H ages correlate with a slope of 0.77 and a correlation coefficient R2 = 0.76. The mean age delta between the two methods is 3.2 a. However, this low correlation is mainly due to one point which has a mixing zone, quite poorly constrained (F34-30m) which could differ 0 10 20 30 40 50 60 0 5 10 15 20 25 age/transfer time (yr)
Chl or id e con cen tr at ion (mg /L) Recharge wells Kerbernez Hanvec Naizin Betton Arguenon Pleines-Fougères Série3 Série9
mean chloride conc. Weathered zone
mean chloride conc. Recharge wells
hydrogeologically between the CFC and the 3He-3H campaigns. When this point is removed, the slope becomes 0.93 and the correlation coefficient R2 = 0.82 (Fig. 4). The authors thus consider the CFC apparent ages as reliable until 1995. However, a potential uncertainty towards more recent values has been introduced in the figures and tables for the points which have an age ranging from 1985 to 1990; i.e. it is considered that values such as 1988 for example correspond to 1988 to 1995.
(2) For the highest concentrations (i.e. the more recent waters), the apparent age determination is made difficult since the CFC atmospheric concentration is no longer increasing due to the Montreal protocol. For CFC 11 and CFC-113, the atmospheric concentration reached a maximum (by 1994-1995; 2001 for CFC-12) and then slightly decreased, which induces two potential ages for a unique concentration. Although, the precision for the last 15a is clearly lower than before, the values measured are sufficiently precise to be interpreted in terms of age range, even if a precise value can not be given. The concentrations show a gap above the concentration equivalent to 1990 (Fig. 3), i.e. they show two different concentration ranges. Most of the CFC-12 concentrations are below 450 pptv i.e. before 1988, or above 535 pptv i.e. after 1995 with several oversaturated concentrations (uncertainty is 26 pptv). CFC-113 concentrations are below 75 pptv i.e. before 1990 or above 83 pptv i.e. after 1995 (uncertainty is 5 pptv). CFC-11 interpretation is more difficult since the decrease is more important after a maximum in 1994, which often produces two potential values during the last 15a. However, there are very few concentrations above 265 i.e. in the 1990-2000 range (uncertainty is 6). For CFC-12 and CFC-113, two value ranges and groundwater apparent ages appear to be different.
The highest concentrations are interpreted as ‘recent’, on the basis of the concentrations which produce recent apparent ages (> 2000) for at least two of the CFC. A recent apparent age has been attributed to these samples on the basis of both CFC-12 and CFC-113 high concentrations (saturated or recent age) for 11 of the samples, and both high CFC-11 and CFC-113 for two of them. For the 2006 campaign in the Kerbernez site, most of the points indicate a recent apparent age (> 2000) for CFC-12 and both a recent or 1990-1995 apparent age for CFC-113 (and also CFC-11 for 4 points). This recent age is also confirmed by CCl4 concentrations. CCl4 degrades rapidly and is not preserved (Bockgard et al., 2004); the concentrations are above detection limit for these samples (Ayraud, 2006). A precise value is not given for these points: this ‘recent’ age is considered as lower than 10a; it is represented in Figures 5 and 6 as 5 +/- 4.
Since almost no CFC concentrations lead to ages between 1990 and 2000, there are still two apparent age ranges : 2005-1995 (recent apparent ages) and 1995-1985, which do not overlap. Although a high uncertainty is associated with the 1995-1985 values, they are considered as different from the ‘recent’ ones. Such distinction induces a contrast between the recharge zone (variably saturated zone) and the weathered zone immediately below. Such a contrast is also observed
from a chemical point of view. In the recharge zone, the Cl- concentrations are highly variable and very low during the recharge process (Legout, 2005; Legout et al., 2007). In Figure 5 the Cl- concentrations are represented as a function of the apparent ages. The Cl -concentrations in the recharge zone are clearly lower than in the weathered zone with a mean concentration of 29.8 and 34.8 mg/L, respectively.
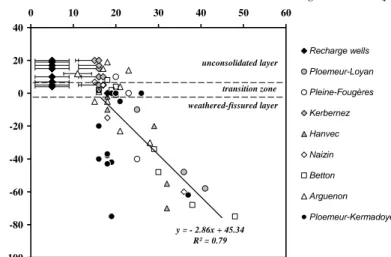
Figure 6: Groundwater age (transfer time) versus relative depth.
The dashed lines (and the associated transition zone) represent the uncertainty in the exact weathered-fissured top location.
4.2. Groundwater apparent age distribution
The groundwater apparent age versus the relative depth is presented in Figure 6. Drastic partitioning is shown by these data: either (1) recent (i.e. less than 10a old as stated above) or (2) homogeneous apparent ages ranging from 12 to 25a old (mean 17.7 +/- 3) in the weathered layer and (3) more than 25a old water and depth-related apparent ages in the weathered-fissured and fractured parts.
(1) Most of the samples with the highest CFC concentrations which have been interpreted as ‘recent’ waters in the previous section correspond to the ‘recharge’ wells. This is particularly clear in the Kerbernez site which has been devoted to recharge process observation and equipped with numerous shallow wells. Both the 2005 and 2006 campaigns show recent waters in the recharge zone, i.e. in the variably saturated zone. An older age (1992 and 1989/recent) is given for the deepest wells (H15 and J15, immediately below the variably saturated zone in the 2006 campaign. Recharge areas are thus characterized by recent waters. In Brittany, the homogeneous topographic (relatively flat) and climatic (temperate) context implies homogeneous recharge processes all over the area. In small gentle-sloping catchments (for example at Naizin, the slope remains <2 %), recent waters have been found 1 to 2 m below the water table. The layer where recent waters have been sampled is thin. In steeper catchments (Kerbernez for example with a slope of 7 %), recent groundwaters have been found in a thicker layer (up to 10 or 15 m deep) in topographic highs but this layer narrows downhill. These results indicate that, despite a
-100 -80 -60 -40 -20 0 20 40 0 10 20 30 40 50 60
age/transfer time (yr)
re lative de pth (m ) Recharge wells Ploemeur-Loyan Pleine-Fougères Kerbernez Hanvec Naizin Betton Arguenon Ploemeur-Kermadoye Série9 Série11 unconsolidated layer weathered-fissured layer transition zone y = - 2.86x + 45.34 R² = 0.79
global flat topography, the steeper the catchment slope, the deeper unmixed recent waters sink.
(2) In the weathered layer, observed groundwater apparent ages range from 10 to 25a with an average of 17.7 +/- 3a. As stated in the previous section, even if a high uncertainty is associated to these apparent ages, they are considered as older than 1995 and different from the ‘recent’ ages observed in the recharge zone. This average value is unexpectedly homogeneous with regards to the scale of the investigated area (27,000 km²). No correlation between groundwater apparent ages and depth or relative depth has been observed when analyzed either globally or site by site. However, the uncertainty associated with the last 15a may prevent such observations. The contrast between the recharge and the weathered zone will be mainly emphasized.
(3) In the weathered-fissured layer and the underlying deep fractured part, groundwater apparent ages range from 20 to 40a. In this zone, the groundwater apparent age is clearly related to the relative depth (i.e. to the depth within the weathered-fissured layer) (slope = -2.86, R²=0.79 significant for p=0.05, Fisher and Yates, 1938).
Figure 7: Chloride concentrations versus relative depth
4.3. Origin of chemical element determination
In order to determine the origin of chemical elements, and potential processes, it is important to characterize the atmospheric source. Within all the sites, meteorological monitoring has been carried out, i.e. precipitations, air and/or soil temperature and precipitation chemistry (mainly on a 1 to 3 month basis) have been monitored. Precipitations in Brittany mainly vary from 700-900 mm in the eastern part (Betton, Pleine-Fougères, Arguenon, Naizin) to 1200 mm in the western part (Ploemeur, Kerbernez, Hanvec). Chloride concentration has been measured in the Pleine-Fougères for 2a on a monthly basis (Clément et al., 2003). Chemical monitoring has also been carried out in the Naizin, Kerbernez and Plomeur sites which are French
national observatories (ORE), since 2001 with an annual frequency of 6 to 4 samples (Ayraud, 2006; Legout, 2005; Martin et al., 2004; http://hplus.ore.fr/; http://www.caren.univ-rennes1.fr/ORE-AgrHys/;
hydrological data are available in these web sites). Brittany has a temperate oceanic climate and, close to the sea coast, the maximum mean Cl- concentration in precipitation is 10 to 18 mg/L, with a weighted mean close to 8 to 12mg/L. Evapotranspiration has been determined in all sites using a Penman type computation from meteorological stations, and several direct measurements in the Naizin site (Robin et al., 1998). It corresponds to 50-60% of precipitations which is in agreement with the mean annual data from Météo-France (45 to 60% for the 1961-2005 period). Infiltration ranges from 300 to 400 mm in the eastern part to 600 to 700 mm in the western part. Such infiltration and precipitation concentration ranges lead to maximum expected mean annual Cl- concentrations in recharge water of 20 to 40 mg/L. Although the meteorological stations do not cover the whole of Brittany, their location in each site allows a general computation to be carried out. Although local variations may occur, the sampling area can be considered as a regional one and the evapotranspiration can be considered as well constrained. Thus later-on it is considered that concentrations above 40-45 mg/L imply a non atmospheric source.
The Cl- concentrations are presented vs relative depth in Figure 7. In the weathered zone, high Cl- values are observed in the Pleine-Fougères site (44-49 mg/L), Betton site (41-54 mg/L) and Ploemeur-Kermadoye (45-56 mg/L). In the Kerbernez site, the concentrations are closer to the range indicating an atmospheric origin. In the fissured and fractured parts at Ploemeur-Kermadoye (49-78 mg/L), Ploemeur-Loyan (104-147 mg/L), Hanvec (47-69 mg/L), and Betton (203-743 mg/L), the Cl -concentrations in groundwaters clearly exceed 40-50 mg/L, indicating an important non atmospheric source of Cl-.
5. Discussion
5.1. Distribution of groundwater transfer time related to aquifer structure
5.1.1. In un-exploited sites
Recharge zone: All the recent values, whatever the site,
correspond to sampling at shallow depth. Many recent values are observed in the Kerbernez site. The well design at Kerbernez (which is dedicated to unsaturated zone monitoring) favors the sampling of the water table fluctuation zone between 6 to 15 m. Some other shallow wells (sampling depth between 2 and 8 m at Pleine-Fougères and Naizin) reveal higher apparent ages (higher than 15a old); they are located in topographic lows with a marked interception of deep circulation loops as deduced from the chemistry (Pauwels and Talbo, 2004) or hydrogeological observations (artesian wells for example). Such wells do not represent recharge zones, but discharge zones of various deep flows. These observations indicate that a more or less thin layer contains recent waters, unmixed with deeper waters (from 2 to 5 m at Naizin, up to 15 m at Kerbernez). This layer containing unmixed recent waters corresponds to
the water table fluctuation zone. Potential rapid lateral transfers have been recently demonstrated in the zone (Legout et al., 2007), which can limit the vertical transfer to the weathered zone immediately below.
Weathered zone: In the weathered layer, no age
gradient is observed. Waters show values ranging between 11 and 25a, most of them ranging from 15 to 19a. A relative homogeneity of the apparent age is observed in the weathered layer below the water table fluctuation zone, although the sampling depth varies from 10 to 35 m. Indeed, only one value is observed between 0 and 15a. Although the curve of the atmospheric CFC mixing ratios present a relative plateau during the past 10a, the apparent ages can be considered as different between the variably saturated zone (or recharge zone) and the weathered zone, as explained in the results section.
A potential mechanism explaining the lack of groundwater apparent ages between 0 and 15a is related to CFC degradation or sorption in the unsaturated zone. A slight but permanent decrease (several %) of the CFC concentration would lead to a systematic increase of the age of some 10 to 15a. However, this hypothesis requires a slow degradation or sorption process effect for the 3 CFC. Although CFC degradation may occur, it has been related to very low redox-potentials (Busenberg and Plummer, 1992; Semprini et al., 1992 ; Cook et al., 1995; Shapiro et al., 1997; Höhener et al., 2003) and has been mainly demonstrated for CFC-11 and, to a less extent CFC-113 (Semprini et al., 1992 ; Höhener et al., 2003). CFC-12 is thought to remain undegraded in oxic waters. For these reasons, this hypothesis will not be favored, although the groundwater apparent age vertical distribution in the weathered zone remains puzzling. However, the ages corresponding to the end of the atmospheric curve increase have to be used quite carefully and probably have a higher age uncertainty, especially for the 1990-2005 period. As explained in the result section, the main emphasis is on the contrast between the weathered and the variably saturated zone, rather than precise ages.
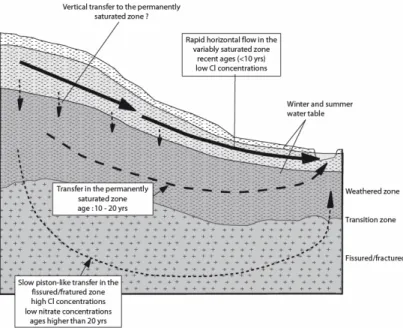
The homogeneous apparent age in the weathered zone is difficult to interpret from a hydrogeological point of view. This is particularly true if the weathered layer is considered as a unique reservoir: no hydrogeological model might explain such a lag-time between the surface and rest of the reservoir. Using the hypothesis of Legout et al., 2007, it is considered that very different transfer processes occur in the variably saturated zone and in the weathered zone. They are presented in Figure 8. Rapid lateral transfers predominate in the variably saturated zone and only a limited annual amount of recent water is transferred to the weathered zone. The contrast between lateral and vertical fluxes may explain the apparent age contrast since rapid lateral transfer is induced by the low thickness of the variably saturated zone and only limited transfer occurs down to the weathered layer. In the case of a complete mixing of the groundwater weathered-reservoir, the CFC concentration in the groundwater will be related to the ratio between recharge water and groundwater and not to the real groundwater age. However, there is no evidence for potential mixing processes in the weathered zone and one should expect a
relative increase of the age with depth. The lack of a depth-age relationship might be related to the relatively slight thickness of the weathered zone, as well as the high uncertainty of the CFC ages in the 2005-1990 age scale. The high uncertainty of groundwater ages during this period, although it indicates a relative homogeneity of the apparent age, is probably too imprecise to characterize groundwater flow-paths. The data mainly demonstrate the quite sharp contrast between the variably saturated zone and the underlying weathered zone. Although the hydrogeological processes can not be clearly established from the vertical distribution of the groundwater apparent ages, it is suggested that the variably saturated zone has a high renewal and recent waters, which contrast with the immediately underlying layer where the apparent ages may range from 10 to 25a.
Figure 8: Hydrogeological hypothesis of water transfer in the different hard rock aquifer compartments
Weathered-fissured and fractured zones: In
contrast to the weathered layer, the groundwater apparent age within the weathered-fissured and fractured layers is strongly correlated with the sampling depth. The vertical groundwater apparent velocity is estimated at about 3m/a either for the whole data set or for each site interpreted independently. Although the 7 studied sites have distinct geologies and geological histories, a strong homogeneity is observed in the vertical water velocities. In fractured media, waters mainly circulate along fractures and fissures, and the flow is mainly governed by the physical properties of the rock heterogeneities such as opening, spacing and connectivity (Berkowitz, 2002; de Dreuzy et al., 2004; Neuman, 2005). The differing geological characteristics of the studied sites induce different physical properties of fractures and consequently should lead to different vertical water velocities. As a result, the observed homogeneity seems induced by a regional process related to the general topography-induced flow, rather than by local aquifer characteristics. Since the water samples were collected in front of circulating fractures in the weathered-fissured and fractured sections, they represent the most circulating fraction of the waters in
the aquifer. Discrete sampling has induced a focus on the most rapid part of the circulation flow-paths. Brittany is a relatively flat area with a low topographic gradient from the centre to the periphery (Fig. 1). The regional topographic characteristic leads to a global hydraulic gradient that directly influences water circulation in deep aquifers whatever the site. The age distribution indicates that rapid flow paths are governed by regional and depth-related parameters such as simple Darcy’s circulation loops. A plot of one CFC vs another allows the equivalent hydrogeological models to be tested (Maloszewski, 1996). The relationship of CFC-11 vs CFC-12 or CFC-113 (not shown) confirms the CFC-11 relative degradation. In the CFC-12 vs CFC-113 plot (Fig. 9), the points from the Brittany aquifers in the weathered section plot close to a piston flow or linear-piston flow model, this confirms the regional control and the linear increase with depth. Several point from 3 different aquifers show low CFC-113 concentrations, far from the potential aquifer mixing models. The samples from the Ploemeur-Kermadoye and the Betton plot far from the mixing models. Ploemeur-Kermadoye samples show slight contamination with CFC-12, whilst 3 of the Betton points indicate a mixing model, which is in good agreement with the geochemical data (Ayraud et al., 2006).
Figure 9: CFC-12 vs CFC-113 concentrations in the deep fractured section of the Brittany aquifers.
Different CFC concentration distribution models are presented; they have been computed using the TRACER code (Bayari, 2002).
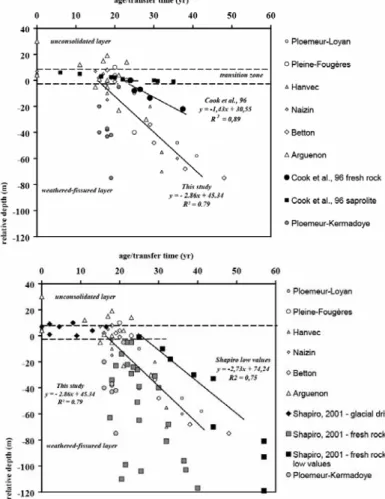
In order to determine the potential generalization of the results, in Figure 10 the Brittany data have been compared to the few data available in the literature. The investigation of a shallow saprolite aquifer (0-25 m) has been reported by Cook et al. (1996). A large increase of the water age is observed in the upper weathered section of the aquifer (Fig. 10a). Although only few points are available in the fractured section, and a large variability is observed at the transition zone, the relationship defined with depth in the fractured section is in the same order as the one observed in Brittany. The Mirror Lake site investigation (Shapiro, 2001; Fig. 10b) gives more details of the groundwater apparent age variation. The position of the samples relative to the glacial drift/fractured aquifer limit has been used as a relative depth. A sharp decrease is observed in the glacial drift
which covers the fractured aquifer, with groundwater apparent ages ranging from 0 to 20a, although the drift thickness is less than 20 m. In the fractured section, no correlation with depth is observed since a large variability of the apparent age is observed for a similar depth. However, for each depth, a low value is observed, which defines a group which appears slightly separated from the other values. When these specific points are selected, they define a correlation (Fig. 10b) which slope is extremely close from the Brittany correlation. This result seems to indicate that the Brittany study has underestimated the apparent age variability. This difference is interpreted as being a result of the sampling method used in both studies, i.e. two-holed sampler in front of the main productive zones in the Brittany wells, vs isolated sections in the Mirror Lake site, which could induce a bias in the apparent age sampling representativeness. Isolated sections allow rapid transfer to be identified whilst sampling the most productive zones induces a homogenization of the apparent ages which are more clearly related to regional transfer. This result implies further investigations, with a detailed correlation to hydrogeological measurements to determine potential matrix contribution versus fracture contribution and the regional and vertical distribution of groundwater apparent ages in circulating fractures.
Figure 10: Comparison of the present results with the data from Cook et al., 1996 (a) and Shapiro, 2001 (b).
However, the most important point is that both the Oak Ridge Reservation (Cook et al., 1996) and the Mirror Lake site (Shapiro, 2001) present results that are in good agreement with the Brittany results, regarding the shape of the age vs depth distribution. In the upper weathered section, a large range of groundwater apparent age is observed with a rapid decrease with depth leading to 10 to 20a old waters at a few meters below the surface. In the 7 different sites from Brittany, recent ages are only observed in the variably saturated zone, and more homogeneous ages are observed below, which agrees with those observed in America. In the fractured section, an apparent age linear increase with depth seems to be verified in all the French and American sites, although a variability is specifically observed in the Mirror Lake site. The general shape of the groundwater distribution with depth, as well as the common hydrochemical properties of the 7 sites from Brittany allows a generalization of these properties to be given to the hard rock aquifers.
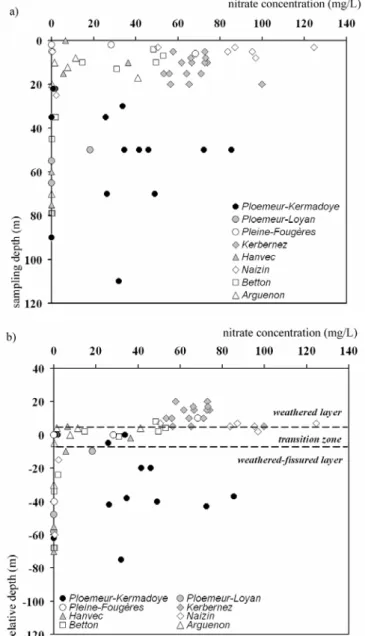
Figure 11: Nitrogen behavior. a) Nitrate concentrations versus sampling depth. b) Nitrate concentration versus relative depth.
5.1.2. In aquifers influenced by high-rate pumping
Data from the Ploemeur-Kermadoye site do not follow the general trend described previously for the other sites (Fig. 6). The apparent age in the weathered part is higher than in other aquifers with values exceeding 19a. In the weathered-fissured part, the correlation between apparent age and depth is less clear (slope = -9.5, R²=0.53 non-significant, Fisher and Yates, 1938), with groundwaters having a rather homogeneous apparent age of 18 +/- 2 years. Since Loyan and Ploemeur-Kermadoye are situated in the same geological setting, the different apparent age-versus-depth relationship can be related to a high-rate pumping effect. As expected in the case of water extraction, the apparent age of the pumped water is reduced as a result of the water velocity increase. The groundwater sampled in the weathered zone above the pumping zone exhibits apparent ages slightly higher than those of the water in the underlying part. This indicates that pumping creates short circuits or a preferential fluid circulation in the weathered zone that can not be deemed completely representative of the water supply reservoir if considered as a whole. However, the relatively constant water age observed all along the profile in the deep fractured zone in the Ploemeur-Kermadoye site indicates that i) pumping does not induce a complete short circuit directly from the surface of the watershed, and ii) the transfer in the fractured zone influenced by pumping is rapid, at least in the 30-to-110 m deep section.
5.2. Processes governing groundwater chemistry related to geological structure
5.2.1. Biogeochemical reactivity
Due to the high N supply from agricultural activities, there is considerable groundwater biogeochemical reactivity involving the N cycle. All the studied sites show a common NO3
-concentration-to-sampling depth relationship (Fig. 11a); above 20 m, concentrations (all concentrations in mg-NO3-) range from 0 to 120 mg/L whereas only low NO3
concentrations are observed below that depth, except in the Ploemeur-Kermadoye site, due to the high-rate pumping influence (Tarits et al., 2006). Nevertheless, depth is not the only parameter controlling the NO3
-concentration variability since low NO3
-concentrations (below 20 mg/L) are observed in both shallow and deep groundwaters. In the upper part, the NO3
-concentration range clearly reflects land use: in agricultural areas (Kerbernez, Naizin, Betton, Pleine-Fougères and Ploemeur-Kermadoye), the maximum NO3- concentration exceeds 50 mg/L whereas in areas protected from agricultural activites (Arguenon and Hanvec) the concentrations are lower than 40 mg/L. When NO3
concentrations are plotted as a function of the geological structure (Fig. 11b), the interface between the weathered and the weathered-fissured layers appears as a transition zone where concentrations seem to rapidly decrease. Because groundwater apparent ages are similar immediately above and below this transition zone (Fig. 6), the decrease in NO3
concentrations attests to the rapidity of the NO3
abatement process along this transition zone. It is assumed that the process is mainly
of biogeochemical origin, since previous geochemical studies of the investigated sites have revealed denitrification processes (Ayraud et al., 2006; Burns et al., 2003; Clément et al., 2003 ; Durand, 2005; Pauwels et al., 1998, 2001; Rademacher et al., 2001; Tarits et al., 2006). The influence of autotrophic denitrification is also emphasized by SO4/NO3 ratios which show a clear increase along the transition zone. The transition zone is a discontinuity between two parts of the aquifer and is characterized by a difference in permeability of several orders of magnitude (Maréchal et al., 2004; Van der Hoven et al., 2005). This contrast in aquifer hydrogeological characteristics is also a mineralogical limit (weathering limit). Along the transition zone, a decrease in water flow and the presence of S minerals favors the development of reduced conditions and autotrophic denitrification is enhanced (Ayraud et al., 2006; Pauwels et al., 1998; Tarits et al., 2006).
Potential evolution of groundwaters through water-rock interaction processes seems fairly weak relative to biogeochemical processes. In the fractured part of the non-influenced aquifers, a slight increase of Ca2+ concentrations with depth is the main tenuous sign of groundwater evolution related to apparent age, except for the Betton site which is characterized by a sharp increase of salinity with depth. Water-rock interaction processes can also explain the excess of Na in deep groundwaters of Betton relative to seawater mixing (see next section). High groundwater Na+ concentrations are usual after long-term water-rock interactions (Aquilina et al., 1997) and are related to Na-bearing minerals such as plagioclase, common in crystalline rocks.
Figure 12: Cl versus Na concentrations in deep groundwaters (relative depth <-10m).
The shaded area represents the domain of evapo-transpirated meteoric water and dashed lines delimit the concentrations that can be explained by a mixing between meteoric and seawater. Dotted lines represent the concentration calculated for mixing between sea water and meteoric water with a sea water contribution (x) of 0.5 or 1%.
5.2.2. Mixing in the weathered- fissured and fractured parts
The Cl- concentrations are presented versus the relative depth in Figure 7. The concentrations range from 30 to 50 mg/L for most of the samples in the weathered-fissured zone. In the weathered-fissured and fractured parts, the concentrations range from 17 to more than 700 mg/L. In agricultural areas, a strong correlation between Cl- and NO3- concentrations is observed, indicating an anthropic origin of Cl- (Hamilton and Helsel, 1995; Pauwels and Talbo, 2004; Saffigna and Keeney, 1977). In the Kerbernez site, on the basis of the Cl- to Br relationship, the agricultural influence has been clearly established (Martin et al., 2004). Although, potential local variations of evapotranspiration can not be ruled out, the agricultural origin of part of the Cl- is highly likely. It may constitute a potential source which could increase the concentration from 30-45 mg/L (see section 4.3) to 50 mg/L. While the agricultural origin is obvious for the weathered part of the investigated aquifers, agriculture can not be the Cl- source in waters recharged prior to the intensification of agricultural practices. Waters with transfer times greater than 25 a in Figure 7 i.e. in the fissured-fractured zone, show Cl- concentrations that indicate non-atmospheric and non-anthropogenic origin. At Ploemeur (Kermadoye and Loyan), Betton and Hanvec, the Cl- concentrations in groundwater clearly exceed 40-50 mg/L, indicating an external, i.e. a non-atmospheric source of Cl- (Fig. 7). Local evapotranspiration variations can be ruled out, at least in the Ploemeur and Betton sites, on the basis of (1) rainwater measurements in Ploemeur and Betton, (2) very high Cl- concentrations in different parts of these sites.
High Cl- concentrations in groundwater are usually attributed to saltwater intrusion in coastal areas (Jones et al., 1999). Seawater constitutes a potential salt source in the sites close to the seacoast which is clear for the Ploemeur-Loyan and Hanvec sites, but also in the Ploemeur-Kermadoye site. In this site, although further from the coast (about 5 km), the pumping zone creates a depression where the water table is near sea level. In crystalline rock aquifers, seawater intrusion is observed through high Cl- and Na+ concentrations since adsorption or exchange processes are slow due to the high stability of silicate minerals (Appelo and Postma, 1993). Figure 12 shows Cl- versus Na+ concentrations in groundwater sampled in the deep parts (weathered-fissured and/or fractured) of the aquifers (relative depth < -10 m). Low-salinity waters fall in the domain of evapo-transpirated meteoric waters, whereas more saline waters (Cl-> 50 mg/l) exhibit Cl- and Na+ concentrations that can result from a mixing between meteoric water and seawater. Such high Cl -concentrations and old ages are observed at the Ploemeur-Loyan and Hanvec sites, for one point at the Arguenon site, and in the two deep wells at Betton that show extremely high Cl- concentrations (Pz6 and Pz7, 743.5 and 203.7 mg/L, respectively). However, the seawater contribution (calculated from Cl -concentrations) is limited to 0.12 to 0.2 % at the Hanvec and Arguenon sites, to 0.35 to 0.65 % at the Ploemeur-Loyan site and reaches 0.9 and 3.8 % in the Pz7 and Pz6
deep wells at the Betton site. For the two deep wells at Betton, potential seawater intrusion can be ruled out. The very high salinity is interpreted as a mixing between recent waters and a CFC-free old and saline end-member (Ayraud, 2006). This interpretation is strengthened by 14
C analyses (Geoarmor, 2002) indicating a potential age in the order of 10 ka, which does not correspond to any transgression time in the zone and thus indicates a dilution of the original saline water by recent water. Saline end-members have been encountered worldwide in hard rock aquifers at depths higher than 0.5-0.7 km (e.g. Aquilina et al., 1997, 2004; Bottomley and Clark, 2004; Fritz, 1997; Mölleret al., 1997; Nordstrom et al., 1989; Nurmi et al., 1988; Stober and Bucher, 1999). The origin of the saline end-member at Betton will not be discussed here but the results in Betton suggest that saline solutions in hard rock aquifers may occur at shallower depths than previously thought.
Figure 13: Hard rock aquifer model.
5.3. A hard rock aquifer model
Hard rock aquifer compartmentalization has been observed worldwide (Cook and Simmons, 2000; Maréchal et al., 2003; Sukhija et al., 2006; Taylor and Howard, 2000; Wyns et al., 2004). The difference between the weathered zone and the deeper fractured one is well known. It allows the findings to be extended to most of the hard rock aquifers. The physical properties of the water table fluctuation zone are mainly related to the capillarity effect (Berkowitz et al., 2004) and are not directly related to the geological structure. Weathering of
hard rocks occurs all over the world and the major distinction between weathered and unweathered zones is thought to be an intrinsic characteristic of hard rock aquifers. Furthermore, the transition between the weathered and the weathered-fissured layers is accepted as the effect of initial weathering of crystalline rocks, i.e. it corresponds to the weathering front (Durand et al., 2006; Maréchal et al., 2003; Wyns et al., 2004). The reactivity of the transition layer should also be considered as a characteristic of hard rock aquifers.
The main physical and chemical properties of hard-rock aquifers derived from the investigation in Brittany are summarized in Figure13. Such a structure has strong implications for the physical transfer of water, which shows very different characteristics depending on the zone considered. The transfer of solutes or pollutants in these aquifers, will strongly depend on the zone being considered. Furthermore, the apparent ages in such aquifers will have different meanings depending on the sampling zone. In the weathered zone, they mainly represent a complex recharge process leading to a strong homogenization of apparent ages. As soon as the
groundwater enters the weathered-fissured part (and the fractured part), the groundwater apparent ages represent the increase in residence times as long as the water circulates in the main fractured zone of the aquifer. They show a correlation with the solute evolution, as long as water-rock interactions proceed.
The understanding and modeling of hard rock aquifers implies an integration of the various properties observed in the investigated aquifers and is presented in Figure 13. Very different behaviors can be expected depending on the part of the aquifer involved. Such a model should help water management in hard-rock aquifers that have been rather under-exploited until now.
Finally, further studies are needed to investigate in greater details the apparent ages in the aquifer since the sampling of circulating fractures has introduced a bias. Different ages and hydrochemical compositions could be observed along other parts of the aquifer. The fraction of slowly moving water and its chemical and age properties have still to be determined.
6. Conclusions
Groundwater apparent ages in hard-rock aquifers were determined through CFC analyses at the regional scale in 7 sites in Brittany, France. Associated with geochemical data, groundwater apparent ages highlight a strong compartmentalization of the transfer properties and chemical reactivity in the aquifers.
At the top of the watershed, in the water table fluctuation zone, recent ages (0-10a) represent the annual recharge. The recharge water constitutes a several-meter thick layer, thicker in the most elevated zones. No age gradient is observed and the apparent ages move sharply from zero to values ranging mainly from 10 to 20a in the weathered zone below the water table fluctuation zone. This indicates that i) rapid lateral transfers are important in this latter zone and ii) only a small fraction of the recharge water moves downward to the weathered layer.
Below the water table fluctuation zone, the age and the solute concentrations exhibit a compartmentalization induced by the geological structure:
(1) A weathered layer, where groundwater is highly influenced by land use, exhibits a homogeneous apparent age ranging mostly from 10 and 20a. (2) A transition zone between this weathered and the
weathered-fissured layers. This transition zone is characterized by a high chemical reactivity. Particularly, the availability of electron donors (e.g. sulfide minerals) enables autotrophic denitrification to proceed along this layer.
(3) A weathered-fissured layer and an underlying deep fractured zone where a linear increase in groundwater apparent age with depth of 3 m/a is observed whatever the site. The homogeneity of the apparent age–depth relationship highlights a regional control on groundwater circulation. Such a control is attributed to the sampling of the rapid water flow in heterogeneous aquifers. The groundwater chemical composition seems to be influenced by a slight seawater component (0.1 to 0.65 %) in the sites close to the seacoast, despite the long distance from the shore (up to 10 km).
Increase in transfer time in the fractured zone favors the development of water-rock interaction and leads to Ca and Na increases in several sites. The strong compartmentalization observed indicates that the physical transfer in and the chemical reactivity of hard-rock aquifers cannot be understood as a whole. The modeling of hard rock aquifers implies complex models integrating various kinds of parameters to simulate the heterogeneous distribution of the properties observed.
The effect of the anthropogenic pumping in the Ploemeur-Kermadoye aquifer highlights the importance of the compartmentalization. Pumping induces an increase in water velocity in the deep fractured part of the aquifer with an almost constant groundwater age along the whole section (30-110 m). This age is close to or even slightly lower than the groundwater age in the weathered part of the aquifer, which indicates that pumping might create preferential water flows and produce a homogenization of the aquifer. Determination of groundwater apparent ages proves to be an interesting tool for the understanding of hard rock aquifers and water management.
Acknowledgements:
Thanks to all municipalities for providing access to the sites. Thanks to Odile Hénin, Patrice Petitjean, Martine Bouhnik-Le Coz, Jean-Claude Foucher, Mikael Faucheux, Boris Cocquempot and Sandra Forner for field work and analyses. Thanks to Anne-Marie Aquilina, Yves Quété, Gérard Gruau and Jean-Pierre Réhault for sharing their knowledge about the investigated sites. Financial and field supports have been provided by the region Bretagne, the regional Council (PRIR DATEAU), the National Education Ministry, CNRS (Environmental Research Observatories H+ and AgrHys) and BRGM (funding of V. Ayraud thesis). Three reviews greatly improved the original manuscript, as well as the editorial work of R. Fuge.
References
Aeschbach-Hertig, W., Schlosser, P., Stute, M., Simpson, H. J., Ludin, A., Clark, J. F., 1998. A H-3/He-3 study of ground water flow in a fractured bedrock aquifer. Ground Water 36, 661-670.
Appelo, C.A.J., Postma, D., 1993. Geochemistry, Groundwater and Pollution. A.A. Balkema, Rotterdam.
Aquilina, L., de Dreuzy, J.R., Bour, O., Davy, P., 2004. Porosity and fluid velocities in the upper continental crust (2 to 4km) inferred from the injection tests at the Soultz-sous-Forêts geothermal site. Geochim. Cosmochim. Acta 68, 2405.
Aquilina, L., Sureau, J.F., Steinberg, M. and the GPF team, 1997. Comparison of surface, aquifer, and pore waters form a Mesozoïc sedimentary basin and its underlying Paleozoïc basement, Southeastern France : Chemical evolution of waters with diagenesis and relation ship between aquifers. Chem. Geol. 138, 185-209.